Modern offices depend heavily on technology. Employees use laptops, cloud software, internal systems, networks, printers, and security tools every single day. Therefore, even a small IT issue can slow down productivity. Moreover, unresolved tickets increase frustration and operational costs.Office IT Helpdesk Dashboard in Power BI
However, many organizations still track IT support requests using emails, manual logs, or scattered Excel sheets. As a result, managers struggle to identify ticket backlogs. They also fail to measure response time properly. Consequently, they lose visibility into department-level IT performance.
So, how can you track total tickets, cost, resolution performance, response time, department workload, and monthly trends in one structured system?
Click to buy Office IT Helpdesk Dashboard in Power BI
You need an Office IT Helpdesk Dashboard in Power BI.
In this detailed guide, you will learn:
- What an Office IT Helpdesk Dashboard in Power BI is
- Why organizations need it
- Detailed explanation of all 5 dashboard pages
- Key KPIs included in the dashboard
- Advantages of the Office IT Helpdesk Dashboard in Power BI
- Best Practices for the Office IT Helpdesk Dashboard
- Frequently Asked Questions with Answers
Let us explore everything step by step.
What Is an Office IT Helpdesk Dashboard in Power BI?
An Office IT Helpdesk Dashboard in Power BI is a ready-to-use business intelligence solution designed to monitor, analyze, and improve IT support performance within an organization.
It captures and analyzes:
- Total support tickets
- Ticket status (In Progress, On Hold, Closed)
- Resolution performance
- Cost in USD
- Department-level ticket distribution
- Location-based IT workload
- Response time by request channel
- Monthly ticket trends
Instead of checking multiple reports, managers get one interactive dashboard with slicers. Therefore, they can filter data by month, department, location, or channel instantly.
Why Does Every Office Need an IT Helpdesk Dashboard?
Today, offices rely on technology more than ever. Therefore, IT teams handle dozens or even hundreds of tickets daily. Without structured tracking, problems quickly increase.
Here is why organizations need this dashboard:
- Improve Visibility
Managers can instantly see total tickets, in-progress tickets, and closed tickets. As a result, they gain complete control over IT performance.
- Reduce IT Costs
When teams track cost USD by category and department, they identify areas of overspending. Therefore, they can optimize budgets effectively.
- Increase Accountability
Departments can no longer hide recurring IT issues. Instead, leaders see exact ticket distribution by department and location.
- Improve Response Time
Tracking average response time by request channel helps managers reduce delays. Consequently, employee satisfaction improves.
- Make Data-Driven Decisions
Power BI visuals make trends clear. Therefore, leadership makes smarter decisions backed by real numbers.
Detailed Explanation of All 5 Dashboard Pages
This Office IT Helpdesk Dashboard in Power BI contains 5 interactive pages. Each page focuses on a specific analysis area.
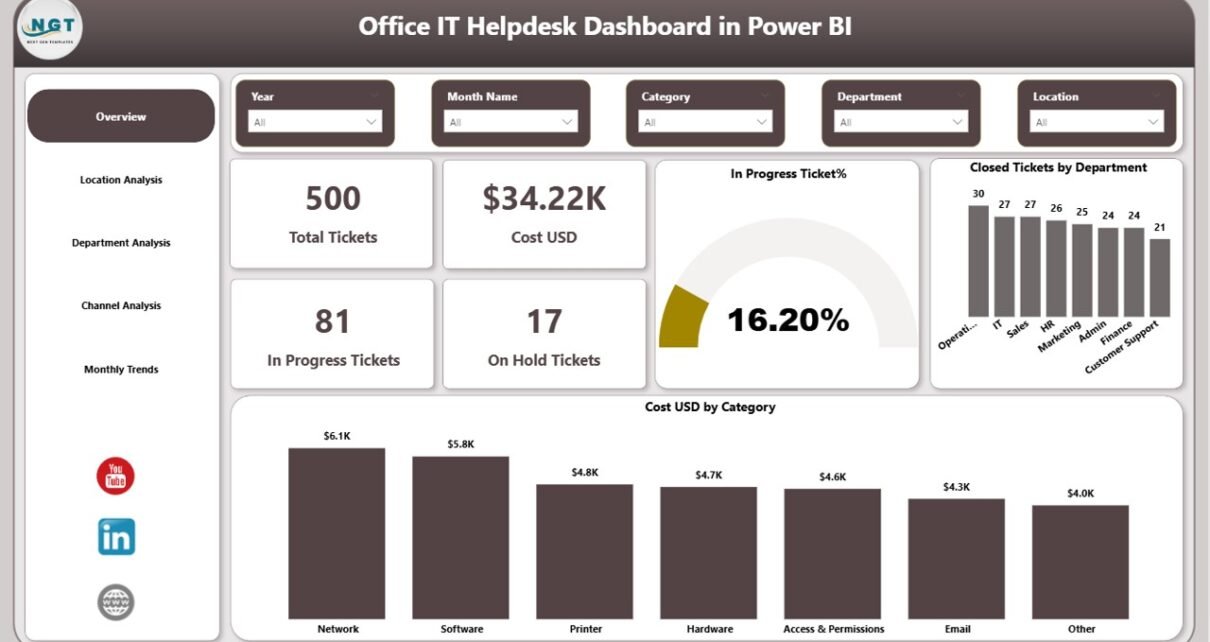
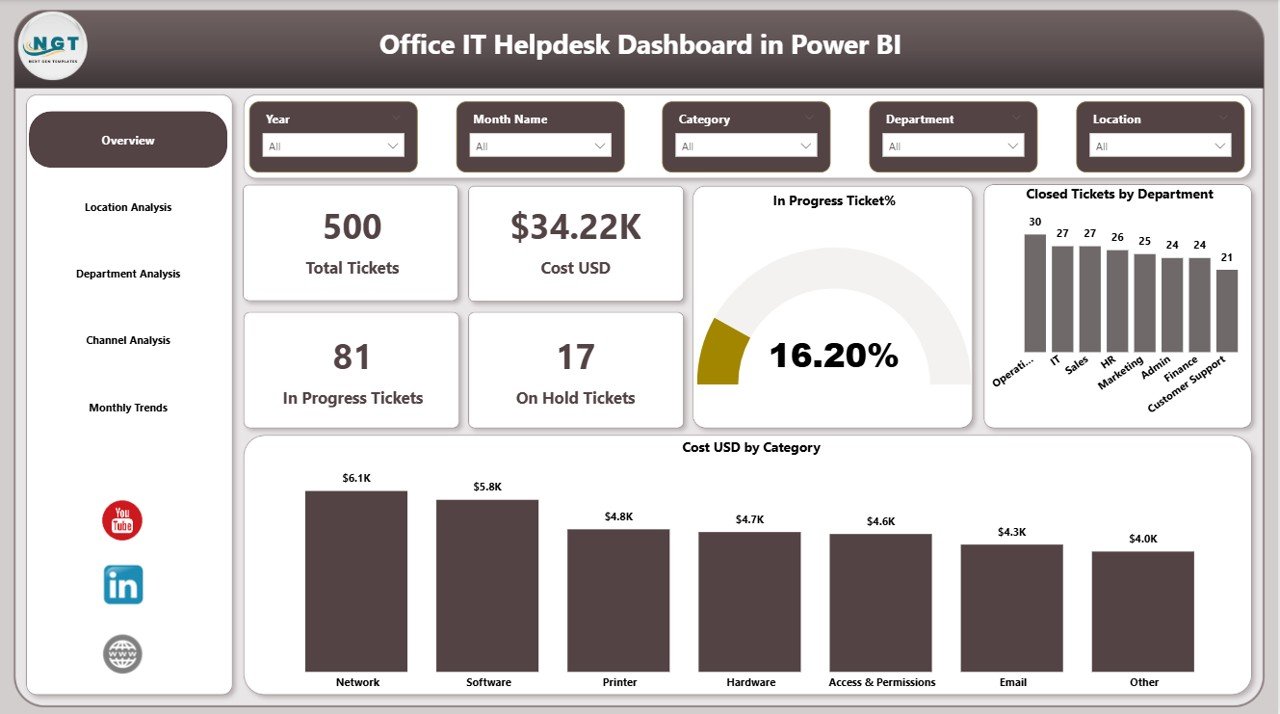
Overview Page – What Is the Overall IT Performance?
The Overview Page acts as the main control center.
Key KPI Cards:
- Total Tickets
- Cost (USD)
- In Progress Tickets
- On Hold Tickets
- In Progress %
- Closed Tickets by Department
- Cost USD by Category
This page provides a quick snapshot of IT operations.
What Insights Can You Get?
- How many tickets are active right now?
- How much money has the IT team spent?
- Which department generates the most tickets?
- Which category costs the most?
Because this page includes slicers, managers can filter by month or department instantly. Therefore, decision-making becomes faster and easier.
Click to buy Office IT Helpdesk Dashboard in Power BI
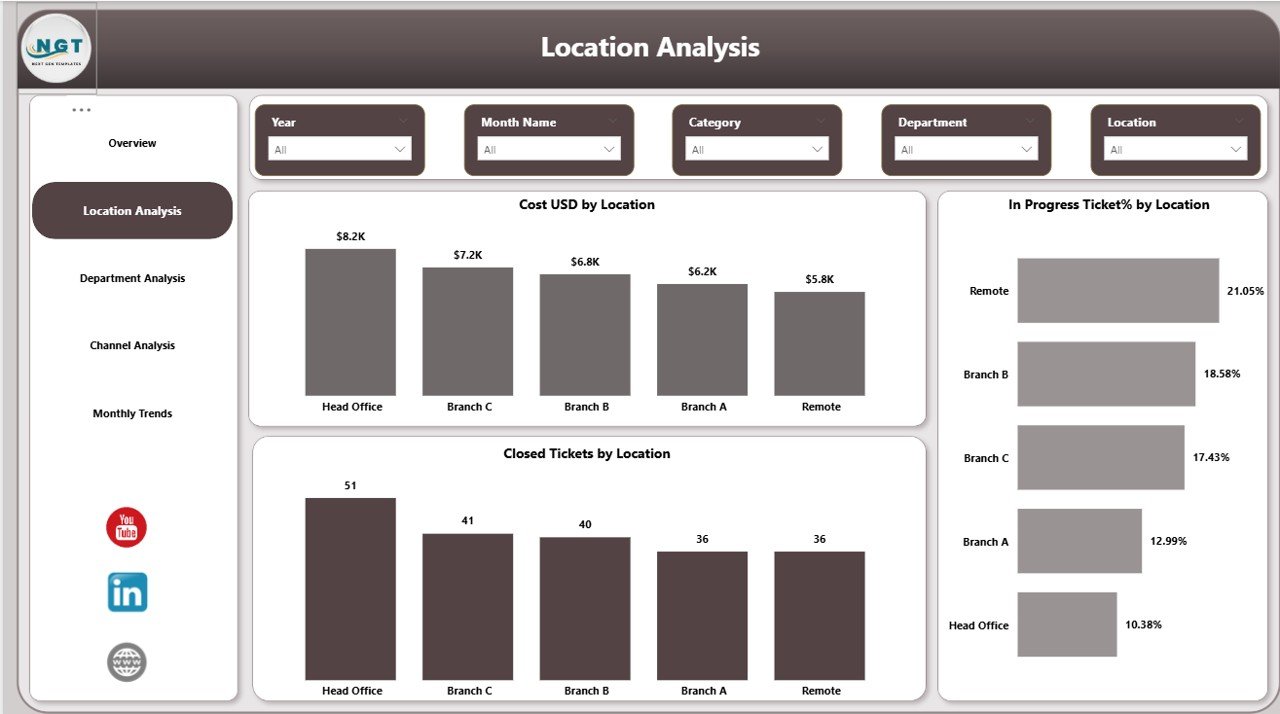
Location Analysis – Which Office Location Needs More IT Support?
Many organizations operate in multiple locations. Therefore, IT workload varies across offices.
The Location Analysis Page includes:
- Cost USD by Location
- In Progress Tickets % by Location
- Closed Tickets by Location
Why Is Location Analysis Important?
- It shows which branch has recurring issues.
- It highlights high-cost locations.
- It identifies underperforming IT support zones.
For example, if one location shows higher in-progress percentage, managers can allocate more technical staff there. As a result, resolution speed improves.
Click to buy Office IT Helpdesk Dashboard in Power BI
Department Analysis – Which Department Raises the Most Tickets?
Different departments use different tools. Therefore, their IT needs differ.
The Department Analysis Page includes:
- Cost USD by Department
- Resolved Tickets by Department
- On Hold Tickets % by Department
What Does This Page Reveal?
- Which department creates the highest IT workload
- Which department has the most unresolved tickets
- Which department costs the organization the most
Moreover, leaders can identify recurring technical issues in specific departments. Consequently, they can invest in training or better infrastructure.

Click to buy Office IT Helpdesk Dashboard in Power BI
Channel Analysis – Which Request Channel Performs Best?
Employees raise tickets using different channels such as:
- Web Portal
- Phone
- Mobile App
- Chat
The Channel Analysis Page includes:
- Average Response Time (Hours) by Request Channel
- Resolved Tickets by Request Channel
Why Is Channel Analysis Critical?
- It shows which channel responds fastest.
- It identifies delays in specific communication channels.
- It helps improve user experience.
For instance, if email tickets take longer than portal tickets, managers can encourage employees to use faster channels. As a result, response time reduces.

Click to buy Office IT Helpdesk Dashboard in Power BI
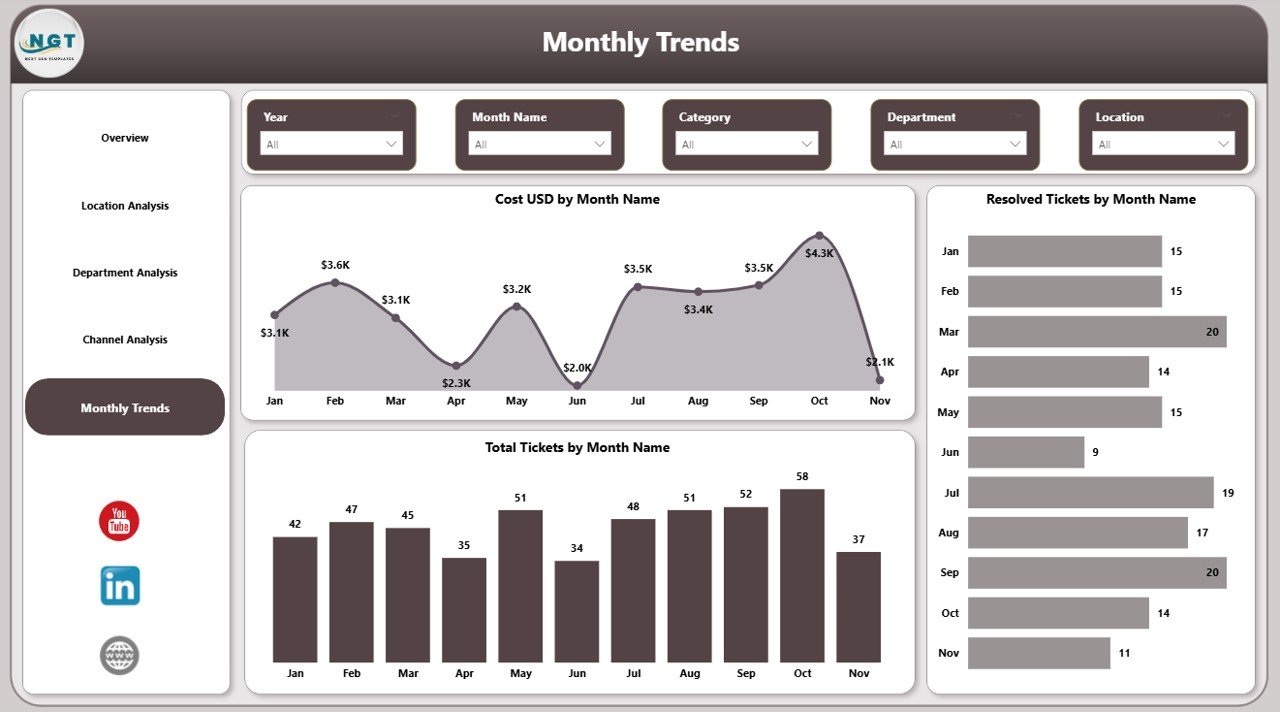
Monthly Trends – Is IT Performance Improving Over Time?
Tracking trends helps organizations grow.
The Monthly Trends Page includes:
- Cost USD by Month
- Resolved Tickets by Month
- Total Tickets by Month
Why Monthly Trends Matter?
- They show seasonal ticket spikes.
- They reveal cost fluctuations.
- They help forecast future IT workload.
For example, ticket volume may increase during software upgrades. Therefore, managers can prepare extra support resources in advance.
Key KPIs Included in the Dashboard
This dashboard tracks multiple critical KPIs.
Operational KPIs:
- Total Tickets
- In Progress Tickets
- On Hold Tickets
- Closed Tickets
- Resolved Tickets
Financial KPIs:
- Total Cost (USD)
- Cost by Category
- Cost by Department
- Cost by Location
Performance KPIs:
- In Progress %
- On Hold %
- Average Response Time (Hours)
- Resolution Trend by Month
These KPIs ensure complete performance visibility.
Click to buy Office IT Helpdesk Dashboard in Power BI
Advantages of Office IT Helpdesk Dashboard in Power BI
Now let us explore the major benefits.
- Real-Time Monitoring
Power BI updates data automatically. Therefore, managers see live IT performance.
- Interactive Filtering
Users can apply slicers to filter by month, location, or department. As a result, analysis becomes dynamic.
- Better Resource Allocation
Location and department analysis helps assign IT resources effectively.
- Cost Control
Cost tracking prevents unnecessary spending. Moreover, it improves budgeting accuracy.
- Improved Employee Satisfaction
Faster ticket resolution increases employee trust in IT services.
- Clear Performance Tracking
Monthly trends help measure progress over time.
- Professional Reporting
Power BI visuals create clean and executive-ready reports.
Best Practices for the Office IT Helpdesk Dashboard
To get maximum benefit, follow these best practices.
- Maintain Clean Data
Always enter accurate ticket information. Therefore, insights remain reliable.
- Standardize Ticket Categories
Define categories clearly such as hardware, software, network, or security.
- Monitor Response Time Regularly
Check average response time weekly. Consequently, you can detect delays early.
- Review Monthly Trends
Conduct monthly performance meetings based on dashboard data.
- Train Employees on Proper Ticket Submission
Encourage employees to use structured channels instead of informal emails.
- Set KPI Targets
Define clear targets for response time and resolution rate.
- Automate Data Refresh
Schedule automatic refresh in Power BI Service for real-time insights.
How Does This Dashboard Improve IT Team Performance?
This dashboard increases transparency. Therefore, IT teams become more accountable.
Moreover:
- Managers detect bottlenecks quickly.
- Teams prioritize high-cost categories.
- Leaders reduce ticket backlog.
- Decision-makers forecast future IT needs.
Consequently, the entire organization benefits.
How Can You Use This Dashboard in Your Organization?
You can integrate this dashboard with:
- Excel ticket logs
- ITSM tools
- ERP systems
- Helpdesk software exports
After importing data into Power BI, you can build relationships and measures. Then, you can design interactive visuals and slicers.
Within a few hours, you can transform raw IT data into meaningful insights.
Conclusion
Technology drives modern offices. Therefore, IT helpdesk performance directly impacts productivity. However, manual tracking creates confusion and delays.
The Office IT Helpdesk Dashboard in Power BI solves this problem.
It provides:
- Clear visibility of total tickets
- Department-level insights
- Location analysis
- Channel performance tracking
- Monthly cost and resolution trends
Because it centralizes data in one interactive platform, decision-making becomes faster and smarter.
If you want better control over IT support, reduced costs, improved response time, and higher employee satisfaction, this dashboard becomes your ideal solution.
Frequently Asked Questions with Answers
- What data do I need to build this dashboard?
You need ticket data including ticket ID, date, department, location, category, status, request channel, response time, and cost.
- Can small businesses use this dashboard?
Yes. Small businesses can use it easily. Moreover, they can scale it as they grow.
- How often should I update the dashboard?
You should update it daily or weekly. However, automated refresh provides better accuracy.
- Can I customize KPIs?
Yes. You can modify KPIs based on organizational requirements.
- Does this dashboard require advanced Power BI skills?
Basic Power BI knowledge helps. However, ready-to-use templates reduce development time significantly.
- How does this dashboard reduce IT costs?
It highlights high-cost categories and locations. Therefore, managers can control unnecessary spending.
Visit our YouTube channel to learn step-by-step video tutorials
Watch the step-by-step video tutorial:
Click to buy Office IT Helpdesk Dashboard in Power BI