Managing purchasing operations in a clinic involves much more than placing orders and tracking invoices. Clinics deal with medical supplies, pharmaceuticals, equipment, vendors, budgets, compliance rules, and tight timelines every single day. Therefore, without structured performance tracking, purchasing teams often face cost overruns, stock shortages, vendor delays, and unclear accountability.
That is exactly why a Clinic Purchasing KPI Dashboard in Power BI becomes an essential analytical solution. This ready-to-use dashboard converts raw purchasing data into clear KPIs, visual indicators, and actionable insights. As a result, clinic administrators and procurement teams gain full visibility into purchasing performance and can make confident, data-driven decisions.
In this detailed and SEO-friendly article, you will learn what a Clinic Purchasing KPI Dashboard in Power BI is, how it works, its page structure, Excel data design, key KPIs, advantages, best practices, and frequently asked questions. By the end, you will clearly understand how this dashboard improves purchasing efficiency, cost control, and operational transparency in clinics.
Click to buy Clinic Purchasing KPI Dashboard in Power BI
What Is a Clinic Purchasing KPI Dashboard in Power BI?
A Clinic Purchasing KPI Dashboard in Power BI is a centralized reporting and analytics tool designed to track, analyze, and monitor key performance indicators related to clinic purchasing activities.
Instead of managing purchasing metrics in multiple Excel sheets or manual reports, this dashboard consolidates all KPIs into a single interactive Power BI report. Moreover, it enables purchasing teams to monitor targets, actuals, trends, and year-over-year performance from one place.
Because the dashboard uses Excel as the data source, clinics can implement it quickly without complex system integrations. At the same time, Power BI provides advanced visualization, filtering, and drill-through capabilities that improve decision-making.
Why Do Clinics Need a Purchasing KPI Dashboard?
Clinic purchasing directly impacts cost efficiency, patient care quality, and operational continuity. However, manual tracking methods often create delays and errors. Therefore, clinics need a structured KPI dashboard to maintain control.
Here is why a purchasing KPI dashboard matters:
- Clinics manage multiple vendors and contracts at the same time
- Medical supplies require strict availability and compliance
- Budget overruns directly affect profitability
- Manual reports consume time and reduce accuracy
- Leadership needs real-time visibility into purchasing performance
With a Clinic Purchasing KPI Dashboard in Power BI, clinics can overcome these challenges effectively.
How Does a Clinic Purchasing KPI Dashboard in Power BI Work?
The Clinic Purchasing KPI Dashboard works by combining structured Excel data with interactive Power BI visuals.
First, purchasing data gets captured in predefined Excel worksheets. Then, Power BI connects to this Excel file and automatically calculates KPIs using built-in logic. After that, the dashboard displays results using cards, tables, icons, and charts.
Because Power BI refreshes data easily, users can update KPIs monthly without redesigning the dashboard.
What Is the Overall Structure of the Clinic Purchasing KPI Dashboard?
This ready-to-use dashboard contains three well-structured pages inside the Power BI Desktop file. Each page serves a specific analytical purpose.
What Does the Summary Page Show?
The Summary Page acts as the main landing page of the dashboard. It provides a complete overview of all purchasing KPIs at a glance.
Key Elements of the Summary Page
At the top of the page, the dashboard includes interactive slicers:
- Month Slicer – Select the reporting month
- KPI Group Slicer – Filter KPIs by category
These slicers allow users to focus on specific time periods and purchasing areas instantly.
KPI Cards on the Summary Page
Below the slicers, the dashboard displays three KPI cards:
- Total KPIs Count
- MTD Target Meet Count
- MTD Target Missed Count
These cards provide an instant snapshot of purchasing performance.
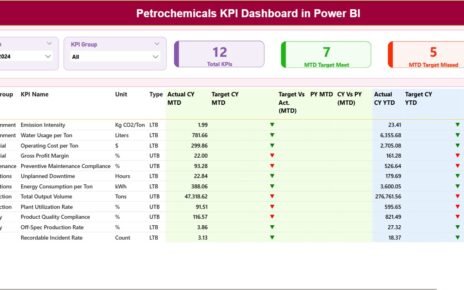
Detailed KPI Table on the Summary Page
Below the cards, a detailed KPI table shows complete purchasing metrics, including:
- KPI Number – Sequential identifier of the KPI
- KPI Group – Category or group of the KPI
- KPI Name – Name of the purchasing KPI
- Unit – Unit of measurement (%, Amount, Count, etc.)
- Type – KPI type such as LTB (Lower the Better) or UTB (Upper the Better)
MTD (Month-to-Date) Metrics
- Actual CY MTD – Actual value for the current year MTD
- Target CY MTD – Target value for the current year MTD
- MTD Icon – ▲ or ▼ icons in green or red to indicate performance
- Target vs Actual (MTD) – Percentage calculated as
Actual MTD / Target MTD - PY MTD – Previous year MTD value
- CY vs PY (MTD) – Comparison percentage between current and previous year
YTD (Year-to-Date) Metrics
- Actual CY YTD – Current year actual YTD value
- Target CY YTD – Current year target YTD value
- YTD Icon – ▲ or ▼ icons showing YTD performance status
- Target vs Actual (YTD) – Percentage calculated as
Actual YTD / Target YTD - PY YTD – Previous year YTD value
- CY vs PY (YTD) – Year-over-year comparison percentage
Because of this structure, users can identify underperforming KPIs instantly.

Click to buy Clinic Purchasing KPI Dashboard in Power BI
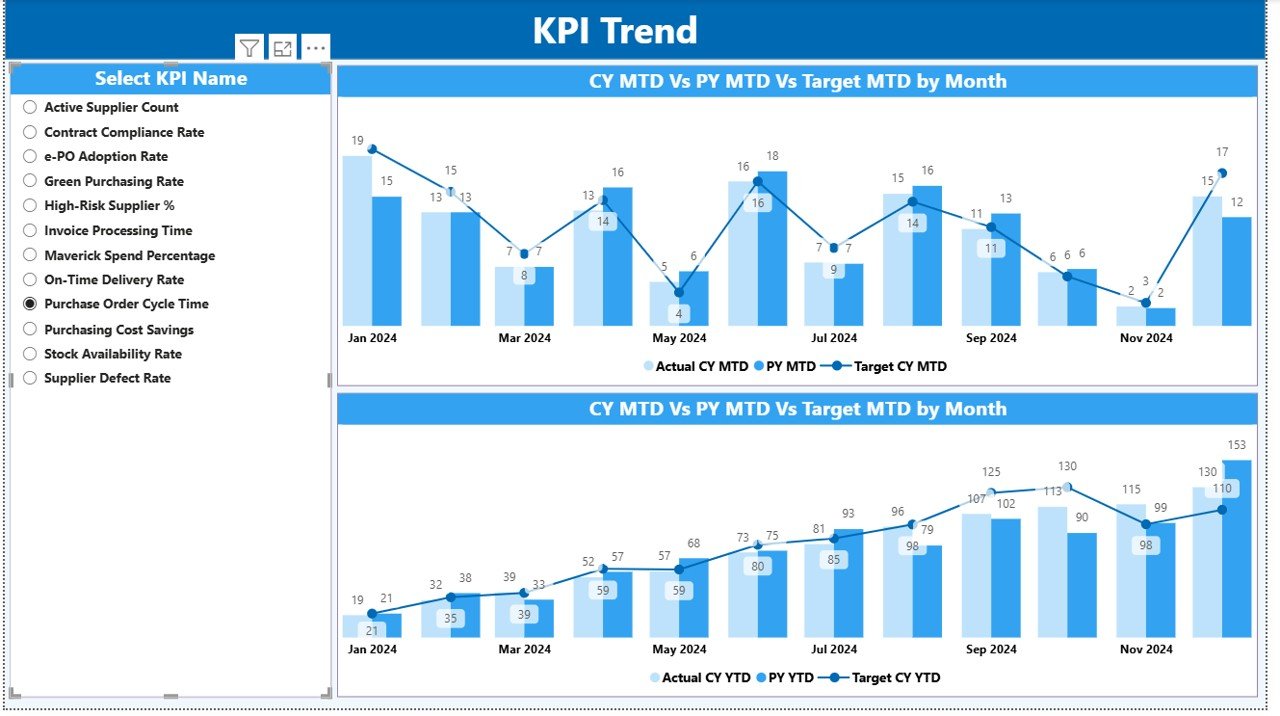
What Is the KPI Trend Page Used For?
The KPI Trend Page focuses on performance trends over time.
Features of the KPI Trend Page
Two combo charts display:
Actual values for the current year
Actual values for the previous year
Target values
One chart focuses on MTD trends
Another chart focuses on YTD trends
On the left side, a KPI Name slicer allows users to select a specific KPI. As a result, users can analyze purchasing performance trends clearly and quickly.
Click to buy Clinic Purchasing KPI Dashboard in Power BI
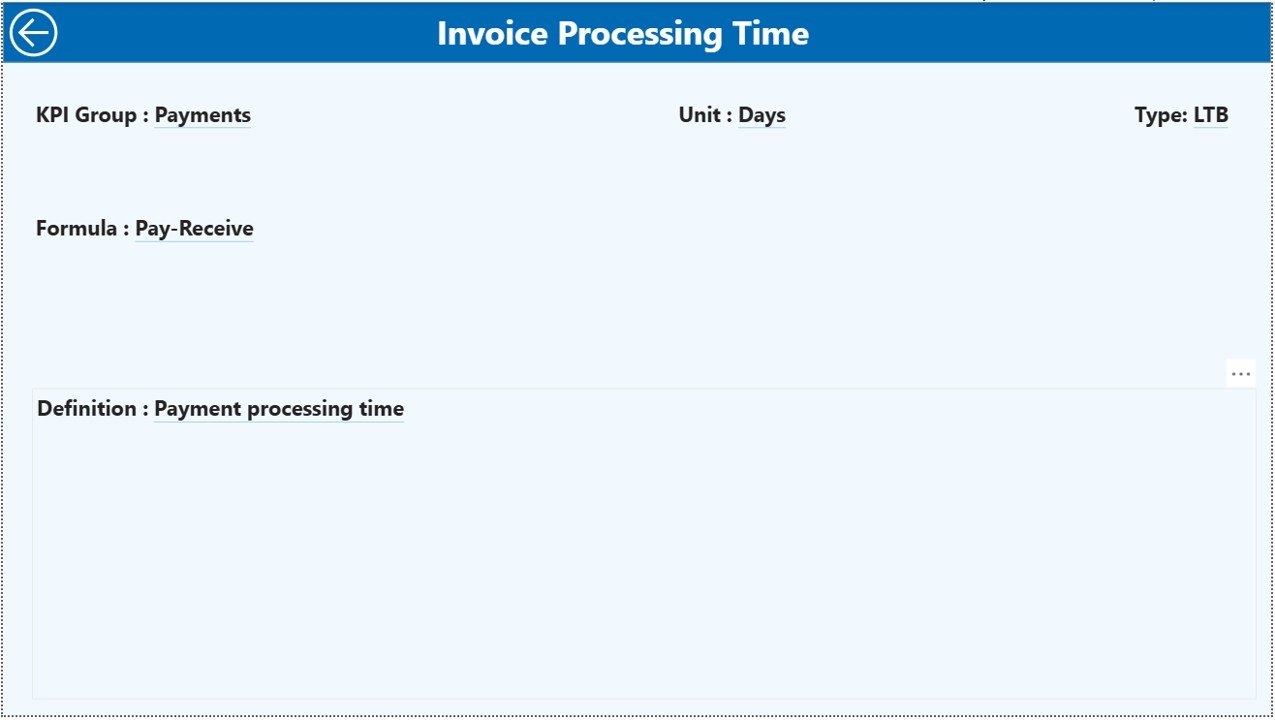
What Is the Purpose of the KPI Definition Page?
The KPI Definition Page acts as a drill-through reference page. This page remains hidden by default.
What Does the KPI Definition Page Contain?
- KPI Number
- KPI Name
- KPI Group
- Unit of Measurement
- KPI Formula
- KPI Definition
- KPI Type (LTB or UTB)
From the Summary Page, users can right-click on any KPI and drill through to view its detailed definition. To return to the main page, users simply click the Back button on the top-left corner.
Click to buy Clinic Purchasing KPI Dashboard in Power BI
How Is Excel Used as the Data Source?
The dashboard uses an Excel file as its data source. This approach ensures simplicity, flexibility, and quick adoption.
Excel Worksheets Required
The Excel file contains three mandatory worksheets:
Input_Actual Sheet
In this sheet, users enter:
- KPI Name
- Month (use the first date of the month)
- MTD Actual values
- YTD Actual values
Input_Target Sheet
In this sheet, users enter:
- KPI Name
- Month (use the first date of the month)
- MTD Target values
- YTD Target values
KPI Definition Sheet
In this sheet, users define:
- KPI Number
- KPI Group
- KPI Name
- Unit
- Formula
- Definition
- Type (LTB or UTB)
Because of this clean data structure, the dashboard stays accurate and easy to maintain.
What Are Common Purchasing KPIs Tracked in Clinics?
A Clinic Purchasing KPI Dashboard typically tracks metrics such as:
- Purchase Order Cycle Time
- Cost Savings Percentage
- Vendor On-Time Delivery Rate
- Inventory Stock-Out Rate
- Budget Utilization Percentage
- Emergency Purchase Ratio
- Supplier Compliance Rate
- Average Purchase Cost Variance
These KPIs help clinics control spending while maintaining supply availability.
Advantages of a Clinic Purchasing KPI Dashboard in Power BI
Centralized Purchasing Visibility
The dashboard brings all purchasing KPIs into one interactive view. Therefore, teams avoid scattered reports and manual tracking.
Faster Decision-Making
Because the dashboard updates automatically, decision-makers can act quickly on performance gaps.
Improved Cost Control
By tracking target vs actual values, clinics can identify overspending early.
Better Vendor Performance Management
Trend analysis helps clinics evaluate vendors and improve negotiations.
Enhanced Accountability
Clear KPIs assign ownership and responsibility across purchasing teams.
Easy Scalability
Because the dashboard uses Excel and Power BI, clinics can add new KPIs without redesigning the entire model.
Best Practices for the Clinic Purchasing KPI Dashboard in Power BI
Define KPIs Clearly
Always define each KPI with a clear formula and business meaning.
Use Consistent Data Entry
Ensure users follow the same month format and units in Excel sheets.
Separate Actuals and Targets
Maintain different sheets for actual and target data to avoid confusion.
Review KPIs Monthly
Schedule monthly reviews to keep purchasing aligned with goals.
Train Users on Drill-Through Features
Encourage teams to use the KPI Definition page for better understanding.
Monitor Trends, Not Just Numbers
Always analyze trends instead of focusing only on single-month results.
How Does This Dashboard Improve Clinic Purchasing Performance?
This dashboard transforms raw data into actionable insights. As a result, clinics reduce costs, improve supplier reliability, and maintain consistent inventory levels.
Moreover, leadership gains confidence in purchasing decisions because data supports every action.
Conclusion
A Clinic Purchasing KPI Dashboard in Power BI plays a critical role in modern healthcare operations. It replaces manual tracking with structured, visual, and reliable analytics. Because it uses Excel as the data source, clinics can deploy it quickly and maintain it easily.
With clear KPI definitions, interactive slicers, MTD and YTD tracking, and trend analysis, this dashboard empowers purchasing teams to improve efficiency, reduce costs, and support uninterrupted patient care.
Frequently Asked Questions (FAQs)
What is a Clinic Purchasing KPI Dashboard in Power BI?
It is a ready-to-use Power BI dashboard that tracks and analyzes clinic purchasing KPIs using Excel data.
Can clinics customize KPIs in this dashboard?
Yes, clinics can easily add or modify KPIs by updating the Excel sheets.
Do users need advanced Power BI skills?
No, users only need basic Power BI knowledge to operate the dashboard.
How often should data be updated?
Most clinics update purchasing KPIs monthly for accurate tracking.
Does the dashboard support year-over-year analysis?
Yes, the dashboard includes CY vs PY comparisons for both MTD and YTD.
Can this dashboard handle multiple KPI groups?
Yes, KPI Group slicers allow analysis across different purchasing categories.
Visit our YouTube channel to learn step-by-step video tutorials
Watch the step-by-step video tutorial:
Click to buy Clinic Purchasing KPI Dashboard in Power BI