Academic publishing has changed rapidly over the last decade. Today, publishers, editors, and research organizations must manage costs, revenues, acceptance rates, journal performance, and regional profitability at the same time. Therefore, relying on static reports or scattered Excel files no longer works. Instead, decision-makers need a clear, interactive, and real-time view of performance.
That is exactly where an Academic Publishing Dashboard in Power BI becomes essential.
This in-depth guide explains what an Academic Publishing Dashboard in Power BI is, why it matters, how it works, and how each dashboard page supports smarter decisions. Moreover, you will explore its advantages, best practices, and frequently asked questions. By the end of this article, you will clearly understand how this dashboard helps academic publishers gain control, transparency, and profitability—without complexity.
An Academic Publishing Dashboard in Power BI is an interactive analytics solution designed to monitor and analyze publishing performance in one centralized report. Instead of switching between multiple spreadsheets, financial reports, and editorial systems, this dashboard brings everything together.
As a result, publishers can easily track:
-
Costs and revenues
-
Profit margins
-
Acceptance and review performance
-
Journal, publisher, and publication type analysis
-
Monthly performance trends
Moreover, Power BI transforms raw academic publishing data into visual charts, KPI cards, and filters (slicers). Therefore, users can explore insights instantly without technical skills.
Why Do Academic Publishers Need a Dashboard in Power BI?
Academic publishing involves complex workflows and high financial stakes. However, many organizations still rely on manual reporting. This approach creates delays, errors, and missed opportunities.
An Academic Publishing Dashboard in Power BI solves these challenges effectively.
Key Reasons Publishers Need This Dashboard
-
First, it centralizes financial and editorial data in one place.
-
Second, it improves visibility into cost drivers and revenue streams.
-
Third, it supports evidence-based decisions instead of assumptions.
-
Finally, it helps publishers respond quickly to performance changes.
Because competition and open-access models continue to grow, publishers must monitor performance continuously. Therefore, a Power BI dashboard becomes a strategic necessity rather than a luxury.
How Does an Academic Publishing Dashboard in Power BI Work?
The dashboard typically connects to structured data sources such as Excel, databases, or publishing systems. Then, Power BI processes the data and displays insights through interactive visuals.
How the Workflow Looks
-
Data gets captured in structured formats such as Excel or databases
-
Power BI imports and models the data
-
Calculations for cost, revenue, profit, and margins run automatically
-
Visuals update dynamically based on slicer selections
-
Users explore insights instantly
As a result, teams save time and focus on decision-making instead of data preparation.
What Are the Key Pages of the Academic Publishing Dashboard in Power BI?
This dashboard includes five structured pages, each designed to answer specific business questions. Let us explore each page in detail.
What Insights Does the Overview Page Provide?
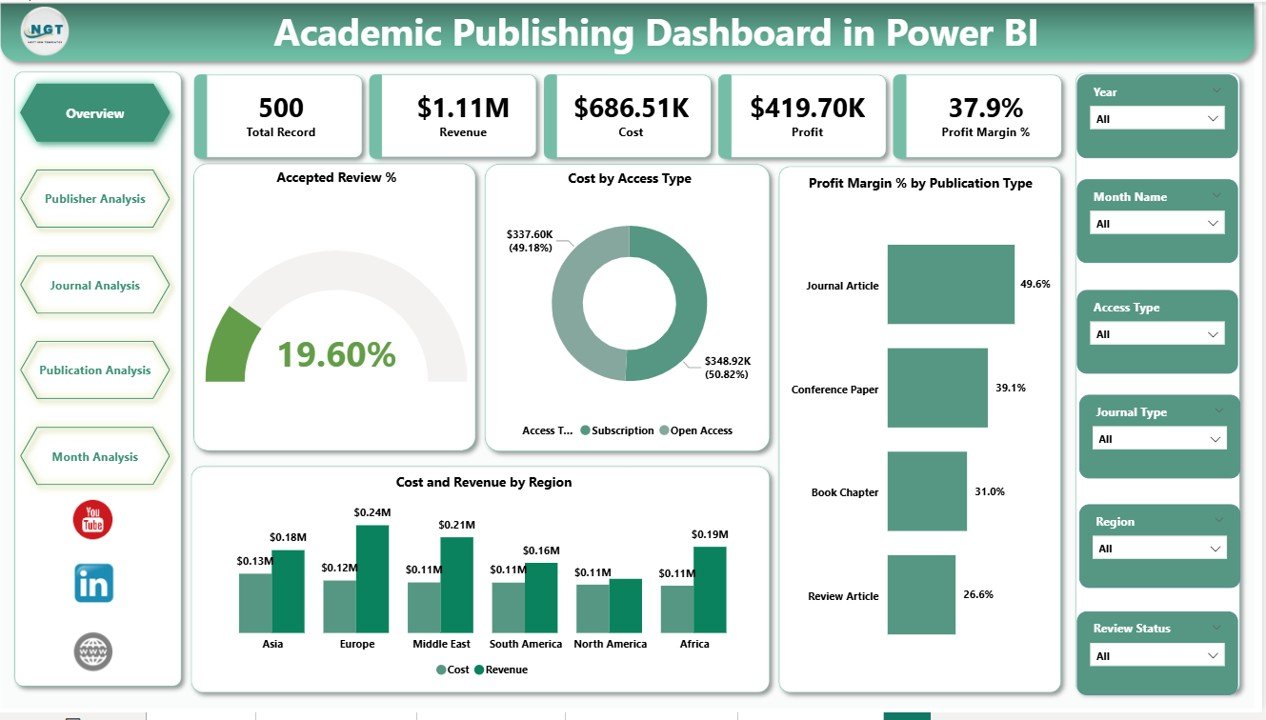
The Overview Page acts as the command center of the dashboard. Therefore, it gives a high-level snapshot of academic publishing performance.
Key Features of the Overview Page
-
Slicers (Filters): Quickly filter data by time, publication type, or other dimensions
-
KPI Cards:
-
Accepted Review %
-
Total Cost
-
Total Revenue
-
Overall Profit Margin %
-
Core Charts on the Overview Page
-
Accepted Review % – Shows editorial efficiency and review outcomes
-
Cost by Access Type – Compares open access vs subscription-based publishing costs
-
Profit Margin % by Publication Type – Highlights which publication models generate higher margins
-
Cost and Revenue by Region – Reveals geographic performance patterns
Because this page summarizes everything, executives can make quick decisions within seconds.
Click to Purchases Academic Publishing Dashboard in Power BI
How Does the Publisher Analysis Page Improve Publisher-Level Decisions?
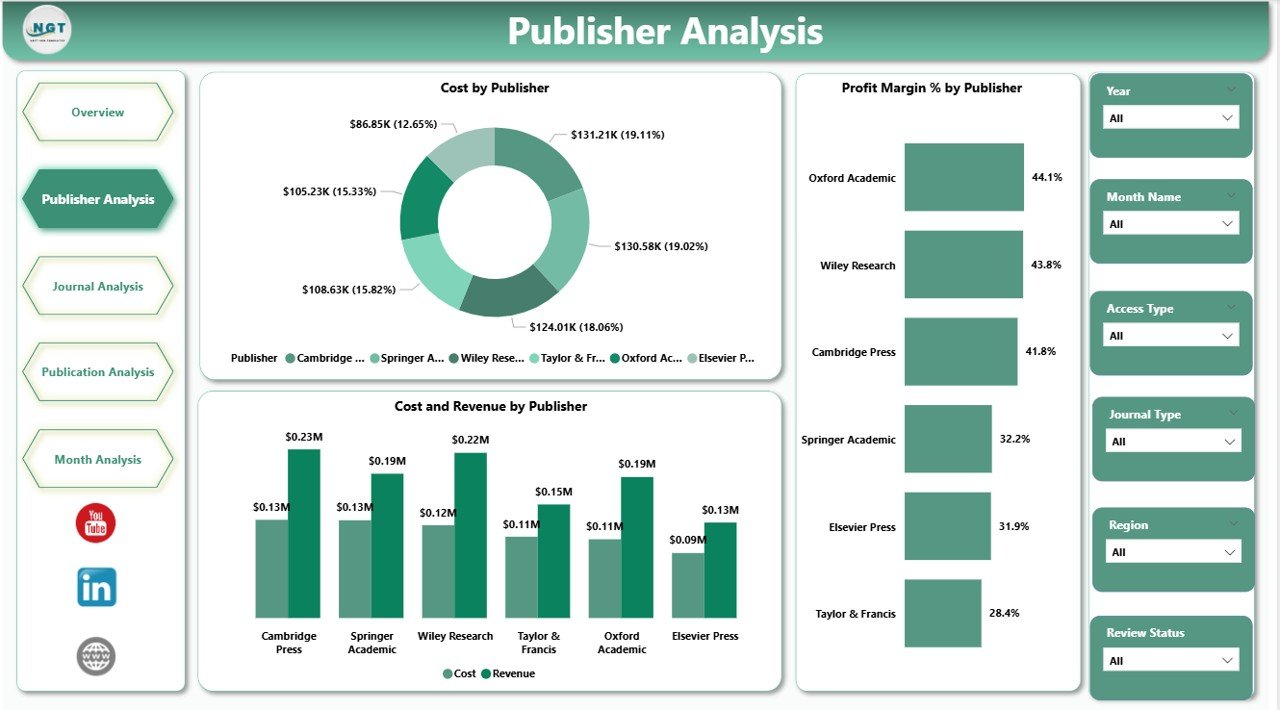
The Publisher Analysis Page focuses on performance across different publishers. Therefore, it helps organizations understand which publishers create value and which ones need attention.
Key Charts on the Publisher Analysis Page
-
Cost by Publisher – Identifies high-cost publishers
-
Profit Margin % by Publisher – Highlights profitable and underperforming publishers
-
Cost and Revenue by Publisher – Shows financial balance at the publisher level
With slicers in place, users can compare publishers easily. As a result, contract negotiations and strategic partnerships become data-driven.
What Does the Journal Analysis Page Reveal?
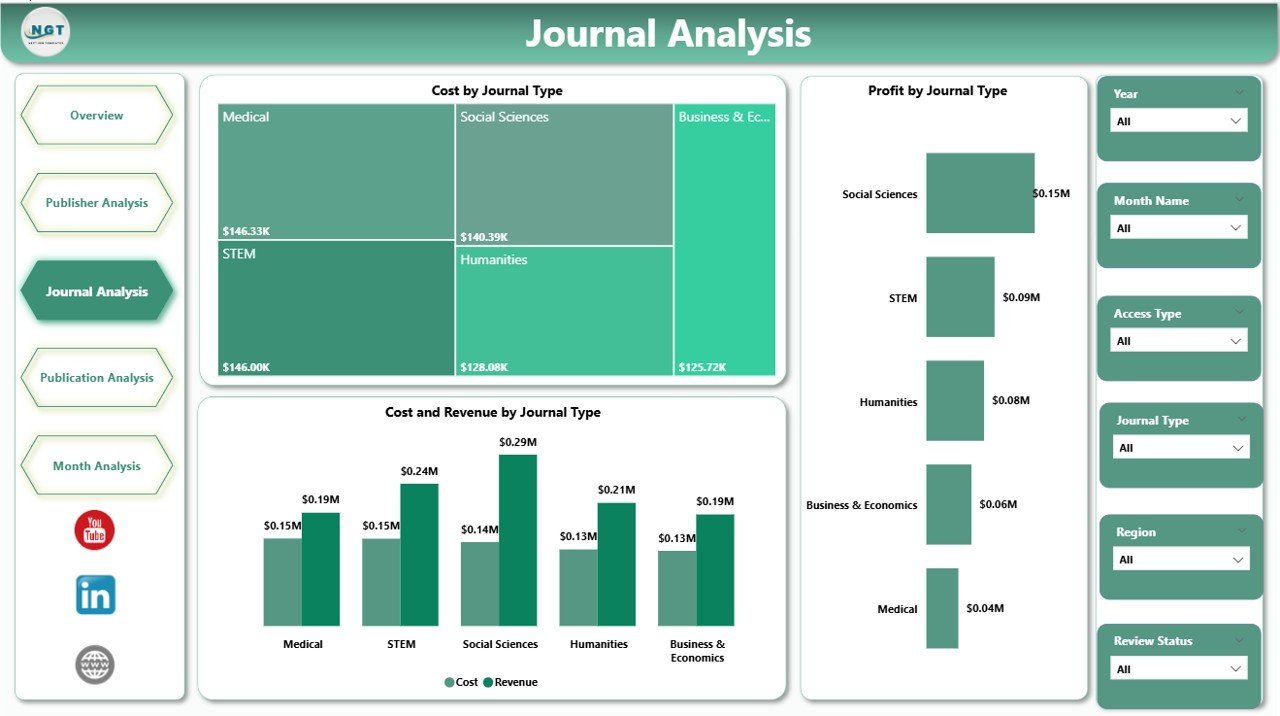
The Journal Analysis Page dives deeper into journal-level performance. Since journals form the backbone of academic publishing, this page becomes critical.
Key Charts on the Journal Analysis Page
-
Cost by Journal Type – Shows spending patterns across journal categories
-
Profit by Journal Type – Highlights journals that generate strong returns
-
Cost and Revenue by Journal Type – Compares investment vs outcomes
Because this page highlights journal-specific insights, editors and managers can refine pricing, scope, and editorial focus.
Why Is the Publication Analysis Page Important?
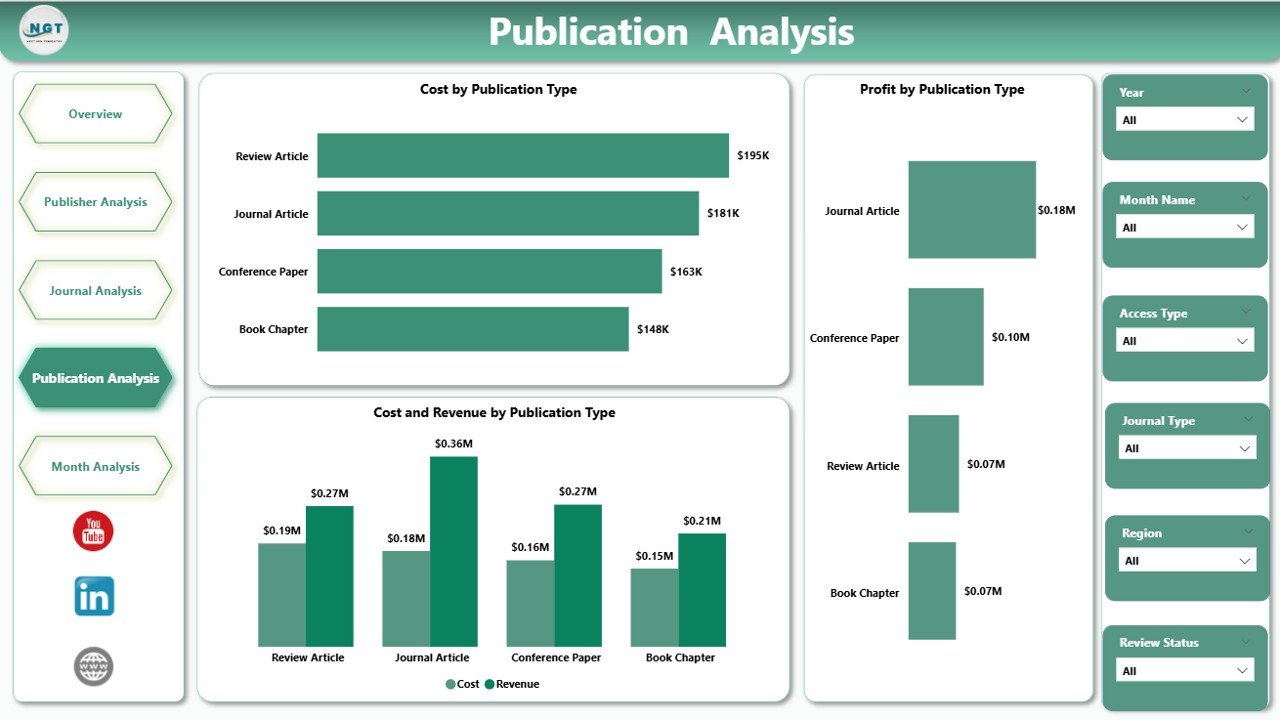
The Publication Analysis Page analyzes performance by publication type, such as research articles, reviews, conference papers, or editorials.
Key Charts on the Publication Analysis Page
-
Cost by Publication Type
-
Profit by Publication Type
-
Cost and Revenue by Publication Type
This page helps publishers understand which publication formats deliver value. Therefore, teams can prioritize high-impact publication types and optimize low-performing ones.
How Do Monthly Trends Help in Academic Publishing?
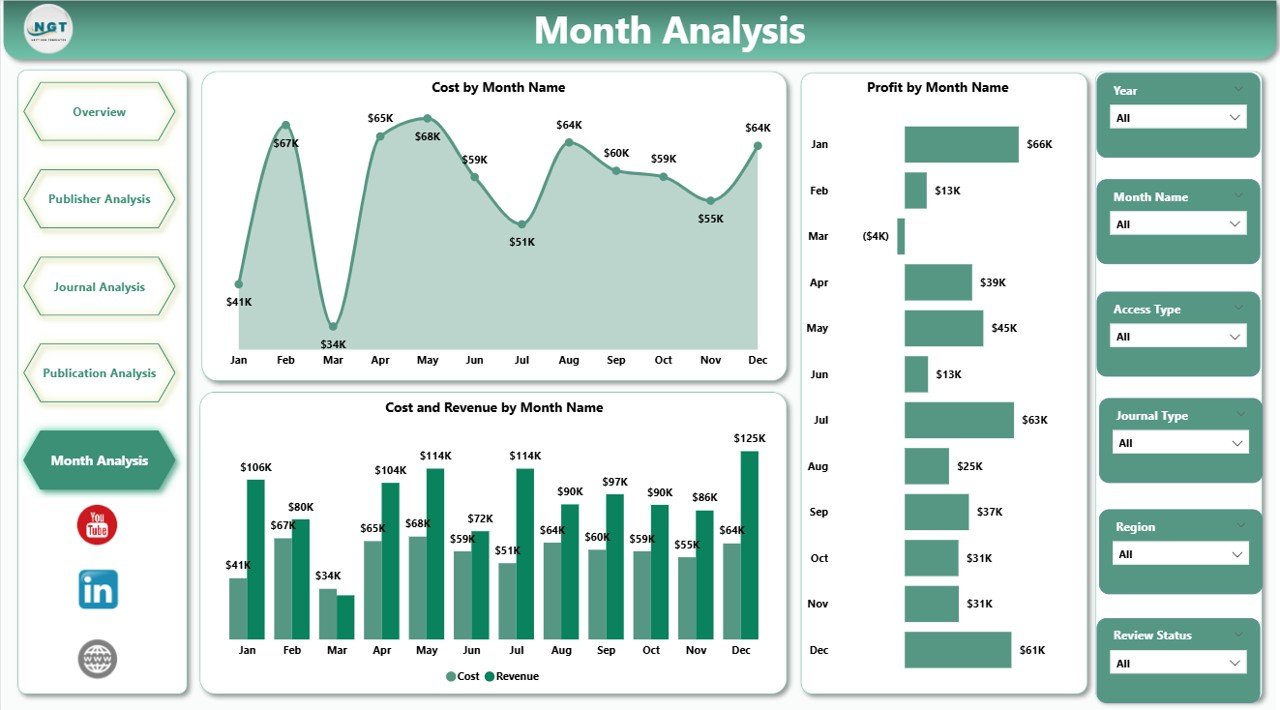
The Monthly Trends Page tracks performance over time. Therefore, it helps publishers identify seasonality, growth, and risks.
Key Charts on the Monthly Trends Page
-
Cost by Month
-
Profit by Month
-
Cost and Revenue by Month
Because trends reveal patterns, decision-makers can forecast budgets, plan editorial cycles, and manage cash flow effectively.
Advantages of an Academic Publishing Dashboard in Power BI
An Academic Publishing Dashboard in Power BI delivers significant advantages across editorial, financial, and strategic functions.
Key Advantages
-
📊 Centralized visibility across costs, revenue, and performance
-
⚡ Faster decision-making through real-time visuals
-
💰 Improved cost control by identifying high-expense areas
-
📈 Profit optimization through margin analysis
-
🌍 Regional insights for global publishing strategies
-
🔍 Transparency across publishers, journals, and publication types
Because of these advantages, publishers gain control and confidence in decision-making.
Click to Purchases Academic Publishing Dashboard in Power BI
How Does This Dashboard Improve Financial Control?
Financial discipline matters greatly in academic publishing. This dashboard supports financial control in several ways.
-
First, it tracks cost drivers clearly
-
Second, it compares revenue against expenses instantly
-
Third, it highlights profit margins by category
-
Finally, it supports budget planning using trend analysis
As a result, finance teams reduce surprises and improve forecasting accuracy.
How Does Power BI Enhance Editorial Decision-Making?
Editorial teams benefit equally from this dashboard.
-
They monitor acceptance and review performance
-
They identify journals with strong outcomes
-
They align editorial strategy with profitability
Therefore, editorial decisions align better with organizational goals.
Best Practices for Using an Academic Publishing Dashboard in Power BI
To maximize value, organizations should follow proven best practices.
Best Practices
-
✔ Maintain clean and structured source data
-
✔ Define consistent cost and revenue definitions
-
✔ Use slicers wisely to avoid clutter
-
✔ Review dashboards regularly with stakeholders
-
✔ Combine financial and editorial metrics
-
✔ Update data frequently for accuracy
By following these practices, users ensure reliable insights and long-term success.
Who Can Benefit from an Academic Publishing Dashboard in Power BI?
This dashboard supports a wide range of stakeholders.
Key Users
-
Academic publishers
-
Editorial managers
-
Finance and accounting teams
-
Research organizations
-
University presses
-
Publishing executives
Because the dashboard remains easy to use, both technical and non-technical users benefit.
How Does This Dashboard Support Strategic Growth?
Growth requires clarity and alignment. This dashboard supports growth by:
-
Identifying profitable publication models
-
Highlighting scalable journals
-
Revealing regional opportunities
-
Supporting long-term planning
Therefore, organizations move from reactive reporting to proactive strategy.
Conclusion: Why an Academic Publishing Dashboard in Power BI Is Essential
Academic publishing demands transparency, speed, and accuracy. Manual reporting no longer meets modern expectations. Therefore, an Academic Publishing Dashboard in Power BI becomes a powerful solution.
It centralizes data, improves visibility, supports financial discipline, and strengthens editorial decisions. Moreover, it empowers publishers to adapt, grow, and compete confidently in a complex publishing environment.
If you want clarity, control, and confidence in academic publishing decisions, this dashboard delivers exactly that.
Frequently Asked Questions About Academic Publishing Dashboard in Power BI
What is an Academic Publishing Dashboard in Power BI?
An Academic Publishing Dashboard in Power BI is an interactive reporting tool that tracks costs, revenues, profit margins, and publishing performance in one centralized dashboard.
Can non-technical users use this dashboard?
Yes, Power BI dashboards remain intuitive and user-friendly. Users interact through slicers and visuals without technical skills.
What data sources does this dashboard use?
Most dashboards use Excel files, databases, or publishing management systems as data sources.
Does this dashboard support open-access publishing analysis?
Yes, it includes cost and revenue analysis by access type, including open access and subscription models.
How often should data be updated?
Organizations should update data monthly or more frequently to maintain accuracy and relevance.
Can this dashboard scale for large publishers?
Yes, Power BI handles large datasets efficiently, making it suitable for both small and large academic publishers.
Visit our YouTube channel to learn step-by-step video tutorials