In today’s fast-moving mortgage industry, lenders must act quickly and accurately. However, when loan data stays scattered across spreadsheets, systems, and reports, decision-making slows down. As a result, lenders struggle with approval analysis, delinquency tracking, and regional performance monitoring. That is exactly why a Mortgage Lenders Dashboard in Power BI becomes an essential analytics solution.
A Mortgage Lenders Dashboard in Power BI transforms raw mortgage data into clear visuals, meaningful KPIs, and actionable insights. Moreover, it allows lenders, analysts, and decision-makers to monitor loan performance, borrower behavior, and monthly trends in one centralized system. Because the dashboard uses Microsoft Power BI, users can filter data dynamically and explore insights in real time.
In this in-depth article, you will learn what a Mortgage Lenders Dashboard in Power BI is, how it works, its key pages, advantages, best practices, challenges, and frequently asked questions. By the end, you will clearly understand how this dashboard improves efficiency, reduces risk, and supports smarter lending decisions.
Click to Purchases Mortgage Lenders Dashboard in Power BI
What Is a Mortgage Lenders Dashboard in Power BI?
A Mortgage Lenders Dashboard in Power BI is an interactive reporting and analytics tool designed to track, analyze, and visualize mortgage lending data. Instead of reviewing static reports, lenders can monitor KPIs such as approval rates, disbursed amounts, delinquency days, and borrower performance in real time.
Moreover, this dashboard brings together data from multiple sources into one structured view. As a result, mortgage teams gain better visibility into loan portfolios and operational performance. Because Power BI supports slicers and dynamic visuals, users can analyze data by lender, region, borrower type, property type, and time period.
Why Do Mortgage Lenders Need a Power BI Dashboard?
Mortgage lending involves complex processes and high financial risk. Therefore, lenders must track performance continuously. However, manual reporting often leads to delays and errors. That is why a Mortgage Lenders Dashboard in Power BI plays a critical role.
Here is why mortgage lenders rely on this dashboard:
-
It provides real-time visibility into loan approvals and disbursements
-
It helps identify high-risk borrowers early
-
It improves regional and lender-wise performance tracking
-
It supports data-driven credit and policy decisions
-
It reduces reporting time and manual effort
Because of these benefits, lenders gain better control over their mortgage portfolios.
How Does a Mortgage Lenders Dashboard in Power BI Work?
A Mortgage Lenders Dashboard in Power BI works by connecting raw mortgage data to interactive visuals. First, data flows from Excel files, databases, or loan management systems into Power BI. Then, data models organize this information into meaningful tables and relationships.
After that, visuals such as cards, charts, and trend graphs display KPIs clearly. Moreover, slicers allow users to filter results instantly. As a result, lenders can analyze loan performance from multiple angles without writing formulas or complex queries.
What Are the Key Pages of the Mortgage Lenders Dashboard in Power BI?
This Mortgage Lenders Dashboard in Power BI includes five powerful pages, each designed to answer specific business questions. Let us explore each page in detail.
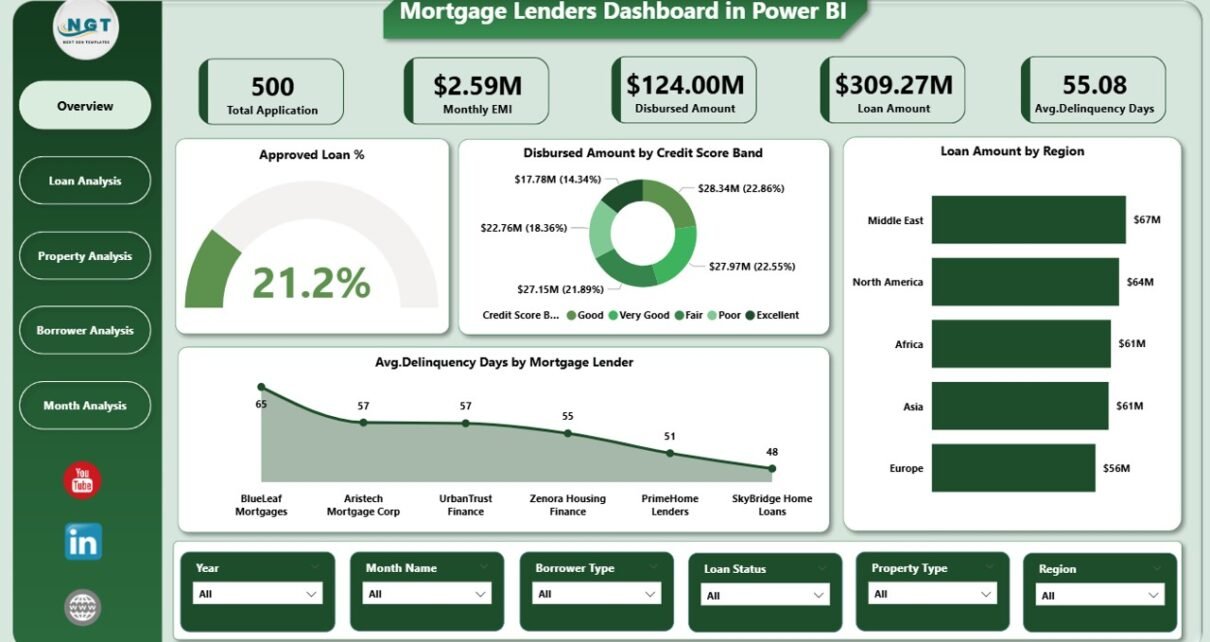
What Does the Overview Page Show?
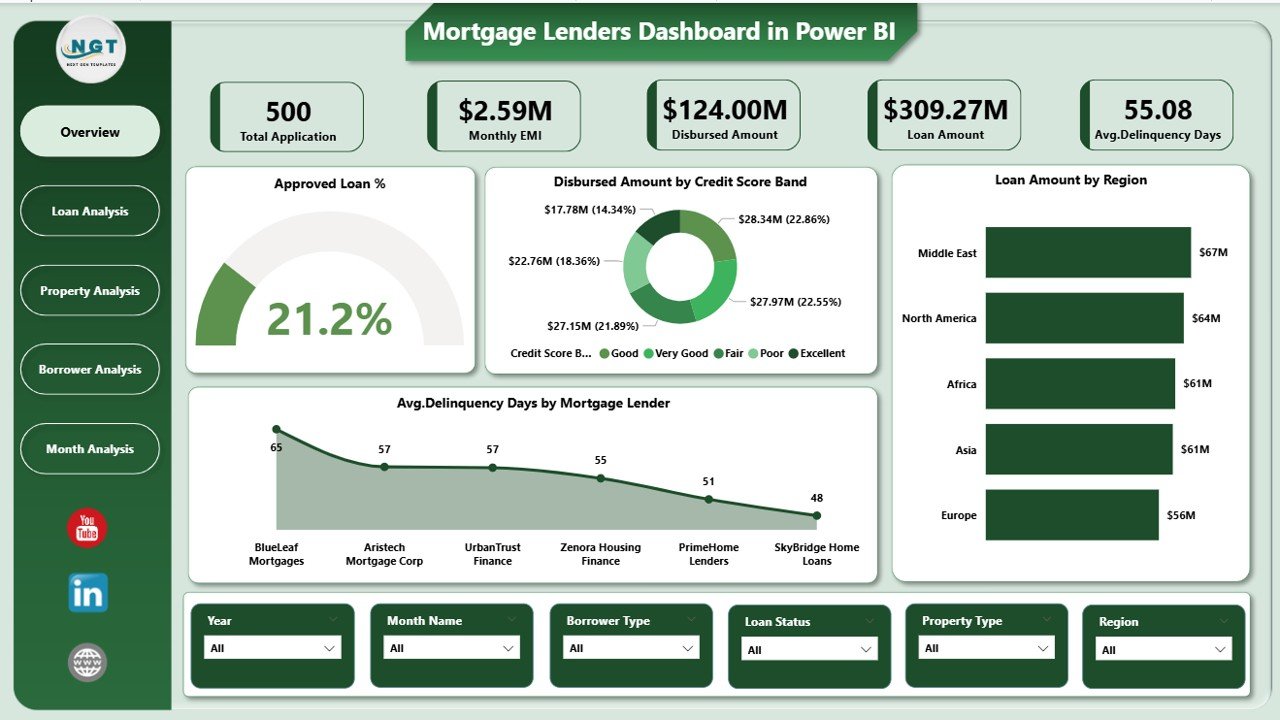
The Overview Page acts as the entry point of the dashboard. It provides a high-level snapshot of overall mortgage performance. Because decision-makers often need quick insights, this page focuses on summary KPIs and key trends.
Key Elements of the Overview Page
Cards
-
Approved Loan %
-
Total Disbursed Amount
-
Average Delinquency Days
-
Total Mortgage Lenders
Charts
-
Approved Loan % by Mortgage Lender
-
Disbursed Amount by Credit Score Band
-
Loan Amount by Region
-
Average Delinquency Days by Mortgage Lender
Because all these visuals update dynamically, users can instantly understand performance gaps and risk areas.
Click to Purchases Mortgage Lenders Dashboard in Power BI
How Does the Loan Analysis Page Help Lenders?
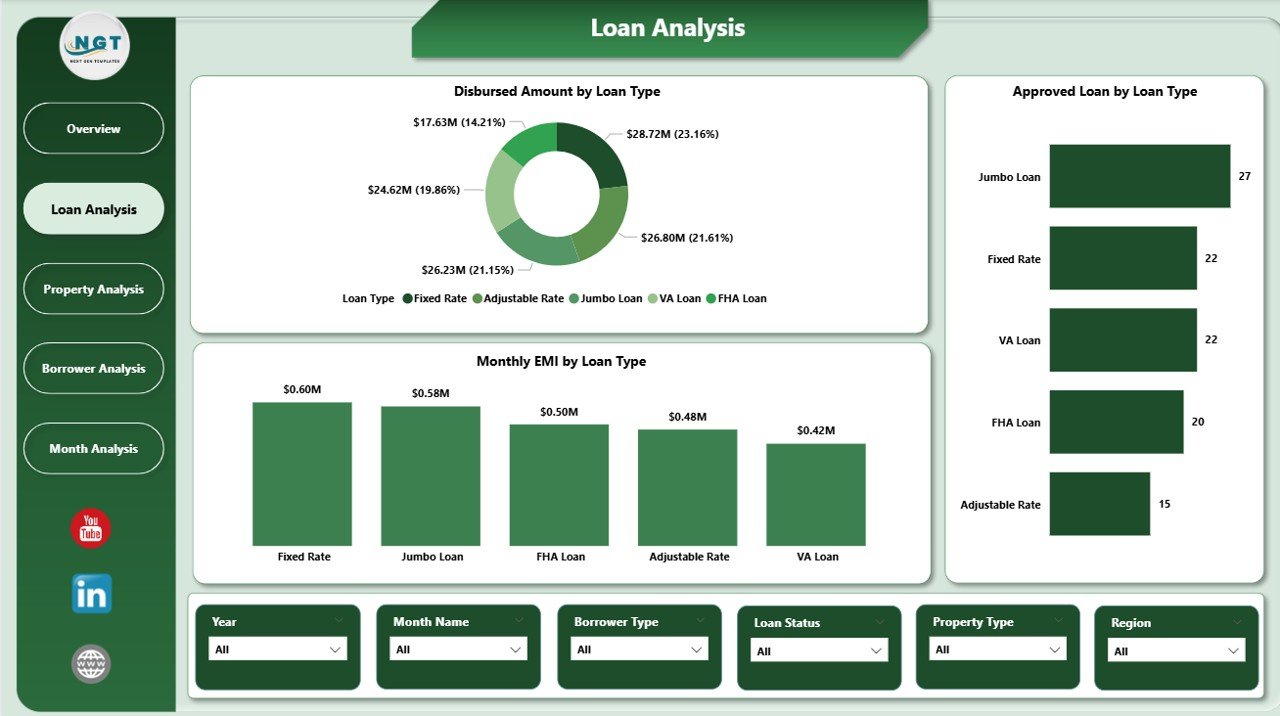
The Loan Analysis Page dives deeper into loan-level performance. Instead of viewing overall numbers, lenders can analyze metrics by loan type.
Key Charts in Loan Analysis
-
Disbursed Amount by Loan Type
-
Approved Loans by Loan Type
-
Monthly EMI by Loan Type
As a result, lenders can identify which loan types generate higher disbursements and which ones carry higher EMI burdens. Moreover, this page supports better product strategy and pricing decisions.
Why Is the Property Analysis Page Important?
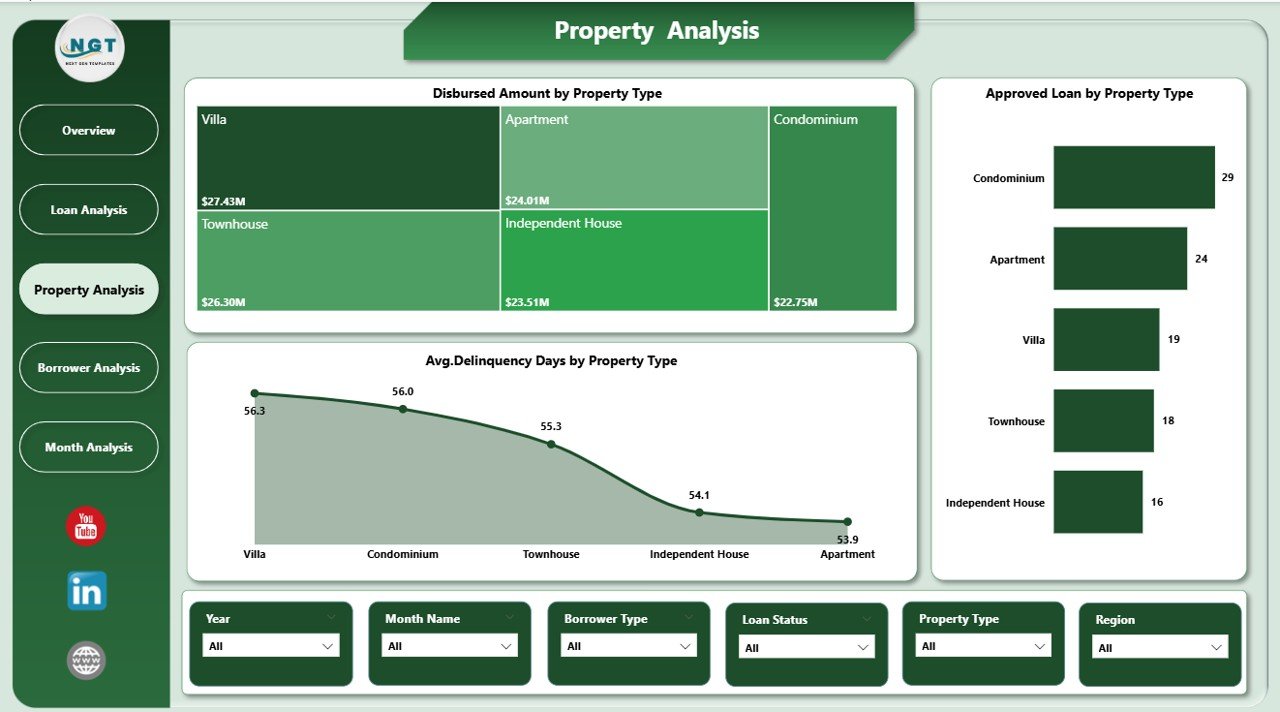
The Property Analysis Page focuses on property-based insights. Since property type influences risk and loan value, this page helps lenders evaluate portfolio quality.
Key Charts in Property Analysis
-
Disbursed Amount by Property Type
-
Approved Loans by Property Type
-
Monthly EMI by Property Type
Because these visuals highlight property trends, lenders can balance residential, commercial, and other property categories more effectively.
What Insights Does the Borrower Analysis Page Provide?
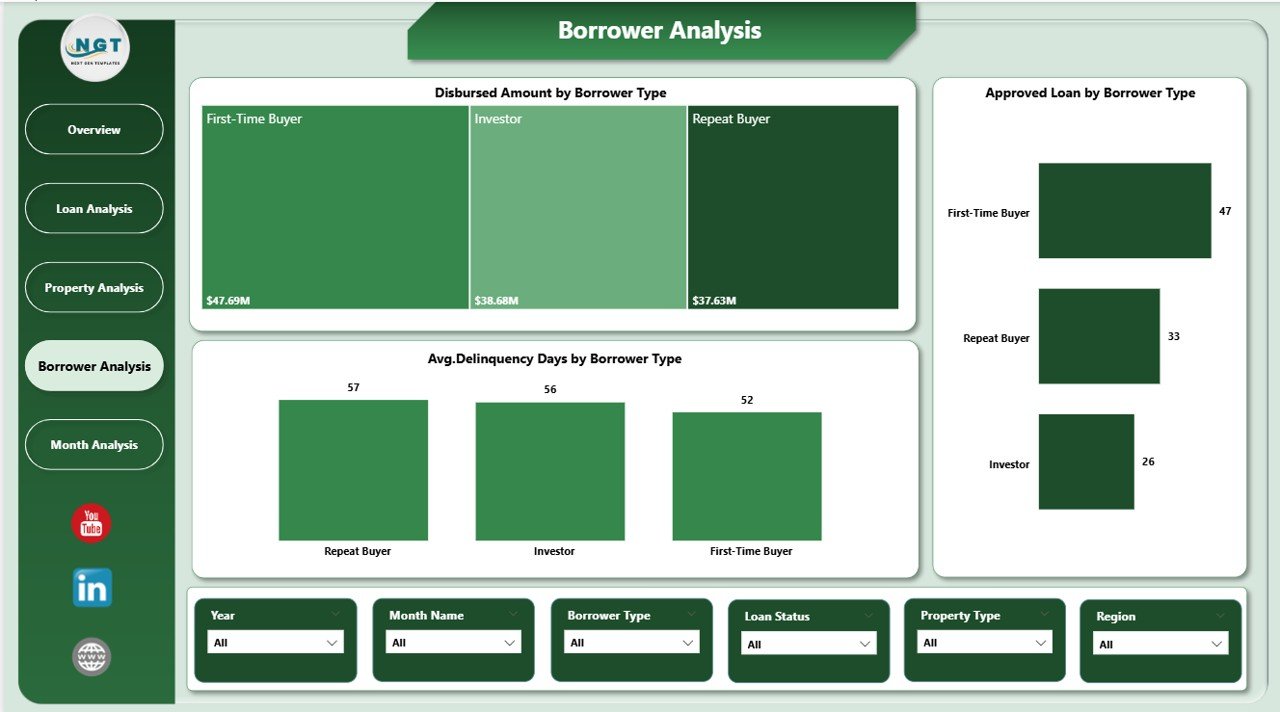
The Borrower Analysis Page evaluates borrower behavior and risk patterns. Since borrower type directly impacts delinquency and repayment, this page becomes crucial.
Key Charts in Borrower Analysis
-
Disbursed Amount by Borrower Type
-
Approved Loans by Borrower Type
-
Average Delinquency Days by Borrower Type
As a result, lenders can identify borrower segments with higher risk and adjust credit policies accordingly.
How Does the Monthly Trends Page Support Long-Term Planning?
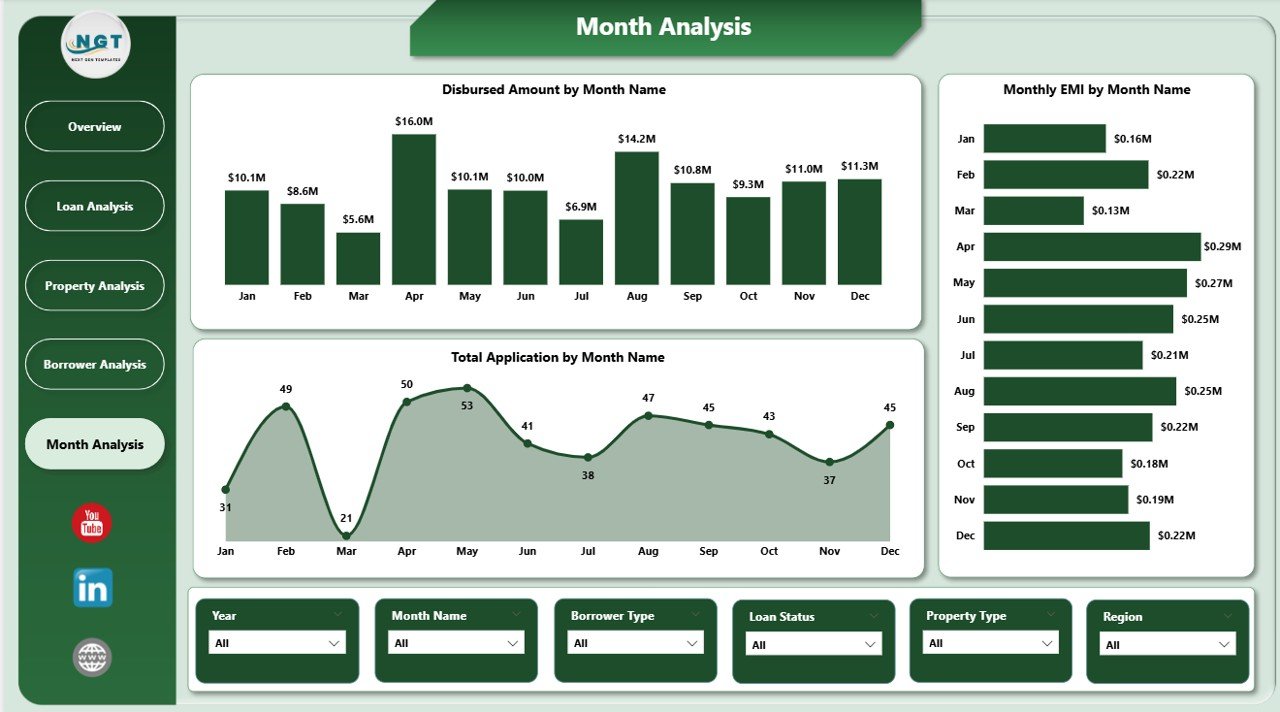
The Monthly Trends Page tracks performance over time. Because trends reveal growth patterns and seasonality, this page supports forecasting and planning.
Key Charts in Monthly Trends
-
Disbursed Amount by Month
-
Monthly EMI by Month
-
Total Applications by Month
With these insights, lenders can predict demand cycles and manage cash flow more efficiently.
Advantages of Mortgage Lenders Dashboard in Power BI
A Mortgage Lenders Dashboard in Power BI delivers measurable benefits across operations, risk management, and strategy.
Key Advantages
-
📊 Centralized reporting for all mortgage KPIs
-
⚡ Faster decision-making through real-time insights
-
🔍 Improved risk monitoring using delinquency analysis
-
🌍 Better regional visibility for expansion planning
-
⏱️ Reduced manual reporting effort
-
📈 Stronger portfolio performance tracking
Because of these advantages, lenders gain clarity and confidence in every lending decision.
Who Should Use a Mortgage Lenders Dashboard in Power BI?
Click to Purchases Mortgage Lenders Dashboard in Power BI
This dashboard suits a wide range of professionals in the mortgage ecosystem.
Ideal Users
-
Mortgage lenders and banks
-
Credit risk analysts
-
Loan operations managers
-
Financial analysts
-
Senior management and executives
Because the dashboard simplifies complex data, both technical and non-technical users can benefit.
What Are the Common Challenges in Mortgage Reporting?
Although mortgage dashboards offer many benefits, lenders often face challenges.
Common Challenges
-
Inconsistent data formats
-
Delayed data updates
-
Limited visibility into delinquency trends
-
Manual consolidation of reports
However, a well-designed Power BI dashboard addresses these issues effectively.
How Does This Dashboard Solve Those Challenges?
The Mortgage Lenders Dashboard in Power BI solves reporting challenges through automation and structure.
Solutions Provided by the Dashboard
-
Automated data refresh reduces delays
-
Standardized KPIs ensure consistency
-
Interactive visuals eliminate manual analysis
-
Centralized reporting improves transparency
As a result, mortgage teams focus more on strategy and less on data preparation.
Best Practices for the Mortgage Lenders Dashboard in Power BI
To get maximum value from the dashboard, lenders should follow proven best practices.
Best Practices
-
✅ Keep source data clean and validated
-
✅ Use consistent definitions for KPIs
-
✅ Apply slicers for focused analysis
-
✅ Review delinquency metrics regularly
-
✅ Update data models periodically
-
✅ Train users on dashboard navigation
By following these practices, lenders ensure accuracy and long-term usability.
How Does This Dashboard Support Compliance and Risk Management?
Mortgage lending involves strict regulations. Therefore, lenders must track performance carefully. This dashboard supports compliance by providing transparent and auditable metrics.
Moreover, delinquency tracking and borrower analysis help identify early warning signs. As a result, lenders can take corrective action before risks escalate.
How Can Mortgage Lenders Use This Dashboard for Strategic Growth?
Beyond operations, the dashboard supports growth planning. For example, regional analysis highlights expansion opportunities. Similarly, loan type trends guide product innovation.
Because insights remain data-driven, strategic decisions become more confident and sustainable.
Conclusion: Why Mortgage Lenders Should Use Power BI Dashboards
A Mortgage Lenders Dashboard in Power BI transforms complex mortgage data into clear, actionable insights. It improves visibility, enhances risk management, and supports smarter decisions across lending operations. Moreover, it reduces manual effort and strengthens portfolio performance.
In an industry where accuracy and speed matter, this dashboard becomes a competitive advantage. By using Power BI effectively, mortgage lenders gain clarity, control, and confidence in every decision.
Frequently Asked Questions About Mortgage Lenders Dashboard in Power BI
What is a Mortgage Lenders Dashboard in Power BI used for?
A Mortgage Lenders Dashboard in Power BI helps lenders track loan approvals, disbursements, delinquency, borrower behavior, and monthly trends in one interactive platform.
Can non-technical users use this dashboard easily?
Yes, the dashboard uses simple visuals and slicers, which makes it easy for non-technical users to explore insights without advanced skills.
Does this dashboard support real-time analysis?
Yes, when connected to live or scheduled data sources, the dashboard supports near real-time analysis.
Can lenders customize this dashboard?
Yes, lenders can customize KPIs, charts, and filters based on business requirements.
How does this dashboard help reduce risk?
The dashboard highlights delinquency patterns, borrower risk segments, and loan performance trends, which helps lenders take preventive action early.
Is Power BI suitable for large mortgage datasets?
Yes, Power BI handles large datasets efficiently and supports advanced data modeling for mortgage analytics.
Visit our YouTube channel to learn step-by-step video tutorials