Managing a Third-Party Logistics (3PL) business has become more complex than ever. Customers expect faster deliveries, lower costs, real-time visibility, and flawless service. At the same time, competition continues to rise, margins stay tight, and operational risks increase daily. Therefore, 3PL companies must track performance accurately and consistently to stay profitable and competitive.
That is exactly why a Third-Party Logistics (3PL) KPI Dashboard in Excel plays a critical role in modern logistics operations.
In this in-depth, SEO-friendly, and easy-to-understand guide, you will learn what a 3PL KPI Dashboard in Excel is, why it matters, how it works, and how each worksheet supports performance tracking. Moreover, this article explains its advantages, opportunities for improvement, best practices, and frequently asked questions. By the end, you will clearly understand how to use this dashboard to improve efficiency, control costs, and enhance customer satisfaction.
Click to buy Third-Party Logistics (3PL) KPI Dashboard in Excel
What Is a Third-Party Logistics (3PL) KPI Dashboard in Excel?
A Third-Party Logistics (3PL) KPI Dashboard in Excel is a structured and ready-to-use analytical template built in Microsoft Excel. It helps logistics providers monitor, analyze, and improve operational, financial, and service-level performance using key performance indicators (KPIs).
Instead of working with multiple Excel files, emails, and reports, this dashboard consolidates all critical KPIs into one centralized and visual format. As a result, managers can quickly identify trends, track targets, compare performance with previous years, and make data-driven decisions.
Because the dashboard runs entirely in Excel, it remains flexible, cost-effective, and easy to use for logistics teams of all sizes.
Why Do 3PL Companies Need a KPI Dashboard in Excel?
3PL operations involve warehousing, transportation, inventory management, order fulfillment, and customer service. Therefore, performance gaps in any one area can impact the entire supply chain.
Without a KPI dashboard:
- Data stays scattered across systems
- Performance issues remain hidden
- Decisions rely on assumptions instead of facts
- Customer satisfaction suffers
- Profitability declines
However, with a 3PL KPI Dashboard in Excel:
- Teams gain complete visibility into operations
- Managers track performance in real time
- Issues get identified early
- Continuous improvement becomes possible
As a result, logistics leaders gain confidence in their decisions.
What KPIs Does a 3PL KPI Dashboard in Excel Track?
A well-designed 3PL KPI Dashboard typically tracks KPIs across multiple areas, including:
Operational KPIs
- On-Time Delivery Rate
- Order Fulfillment Accuracy
- Warehouse Throughput
- Inventory Turnover
- Picking and Packing Accuracy
Financial KPIs
- Cost per Shipment
- Transportation Cost per Unit
- Warehouse Operating Cost
- Revenue per Client
- Profit Margin
Service-Level KPIs
- Customer Order Cycle Time
- Service Level Agreement (SLA) Compliance
- Return Rate
- Complaint Resolution Time
By tracking these KPIs together, organizations gain a holistic view of logistics performance.
How Does a Third-Party Logistics (3PL) KPI Dashboard in Excel Work?
The dashboard works by connecting structured input sheets with automated calculations and visual dashboards. Users enter monthly data for actuals, targets, and previous-year numbers. Then, Excel formulas calculate KPIs, variances, and trends automatically.
Moreover, slicers and drop-downs allow users to filter data by month or KPI. As a result, decision-makers can analyze performance instantly without manual reporting.
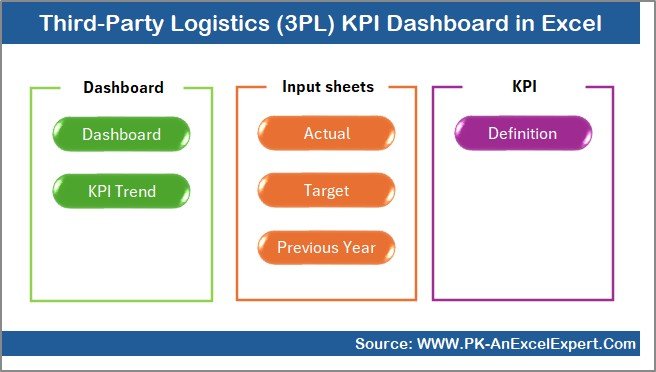
What Are the Key Features of the Third-Party Logistics (3PL) KPI Dashboard in Excel?
In this dashboard, we have created a structured and professional Excel template designed specifically for 3PL performance management. Below are the key features and worksheet explanations.
How Does the Summary Page Help Users Navigate the Dashboard?
Summary Page (Index Sheet)
The Summary Page acts as the navigation hub of the dashboard. Instead of scrolling through multiple worksheets, users can jump directly to any section using buttons.
Key benefits of the Summary Page:
- Improves usability and navigation
- Saves time for executives
- Enhances presentation quality
- Makes the dashboard user-friendly
This page ensures that even non-technical users can access insights easily.
Click to buy Third-Party Logistics (3PL) KPI Dashboard in Excel
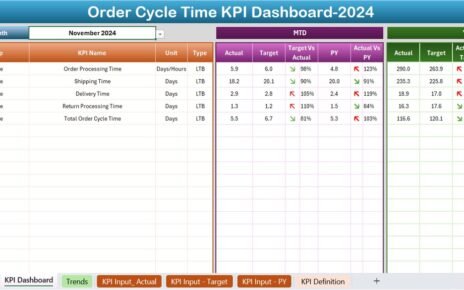
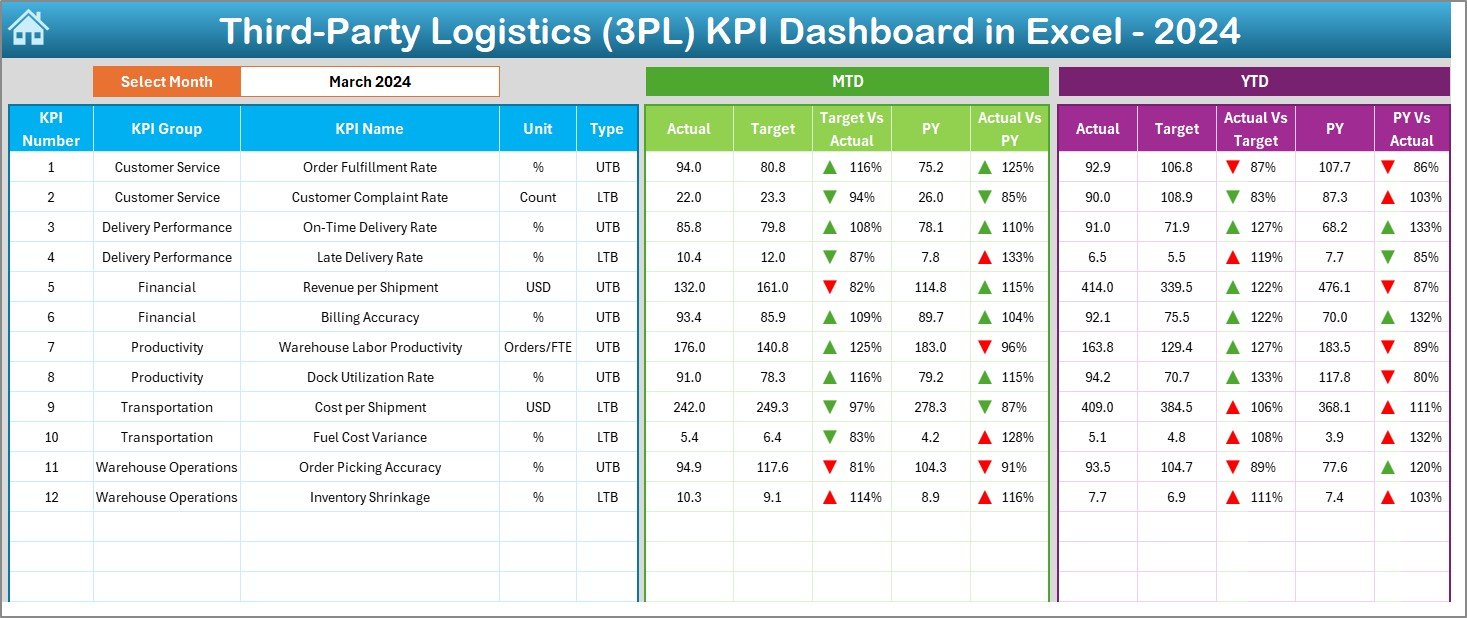
What Does the Dashboard Sheet Show?
Dashboard Sheet Tab
The Dashboard Sheet is the main visual reporting page. It displays all KPIs in a clear, structured, and executive-ready format.
Key functionalities include:
- Month selection using a drop-down in range D3
- Automatic update of all KPIs based on the selected month
- Display of MTD (Month-to-Date) performance
- Display of YTD (Year-to-Date) performance
Performance Comparisons Displayed:
- Actual vs Target
- Actual vs Previous Year
Moreover, the dashboard uses conditional formatting with up and down arrows. Therefore, users can instantly see whether performance improves or declines.
As a result, managers gain quick insights without deep analysis.
Click to buy Third-Party Logistics (3PL) KPI Dashboard in Excel
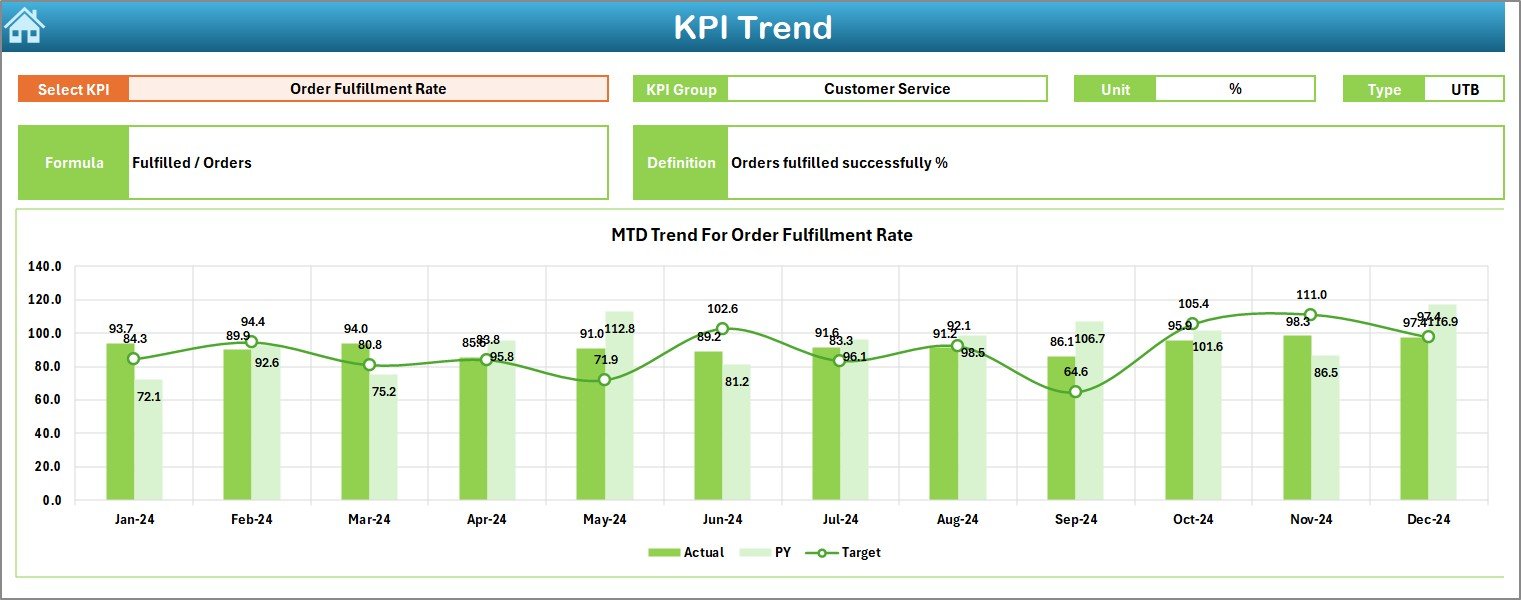
How Does the Trend Sheet Improve KPI Analysis?
Trend Sheet Tab
The Trend Sheet focuses on in-depth KPI analysis. Users can select a specific KPI from the drop-down available in range C3.
Once selected, the sheet displays:
- KPI Group
- Unit of Measurement
- KPI Type (Lower the Better or Upper the Better)
- KPI Formula
- KPI Definition
In addition, the sheet shows:
- MTD Trend Chart for Actual, Target, and Previous Year
- YTD Trend Chart for Actual, Target, and Previous Year
Because of this structure, users can analyze performance patterns over time and identify seasonal trends or recurring issues.
Click to buy Third-Party Logistics (3PL) KPI Dashboard in Excel
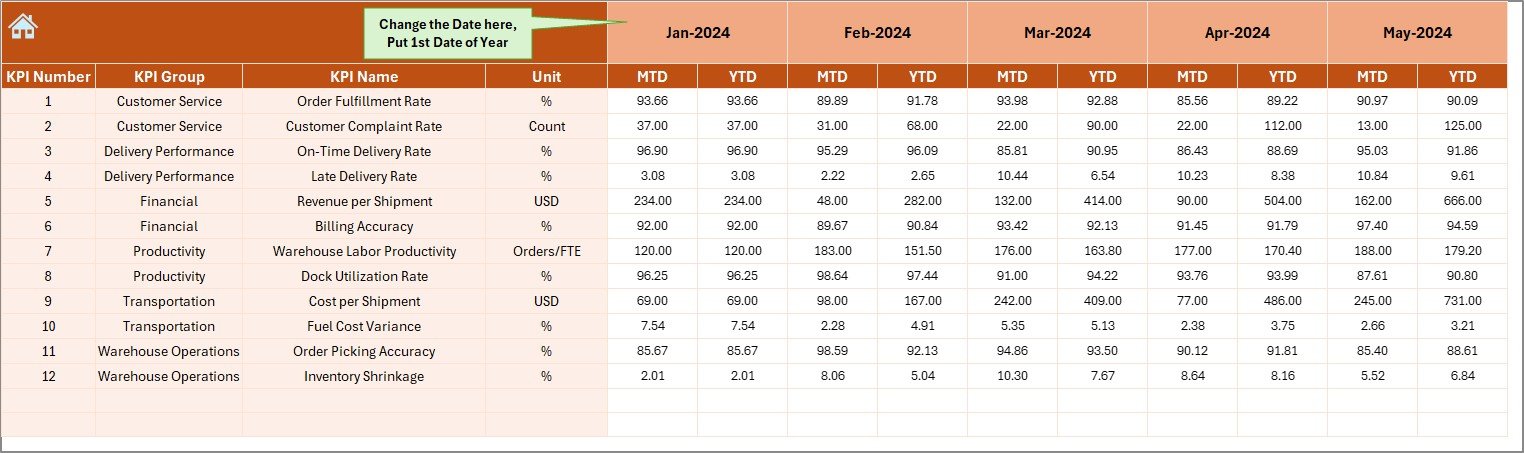
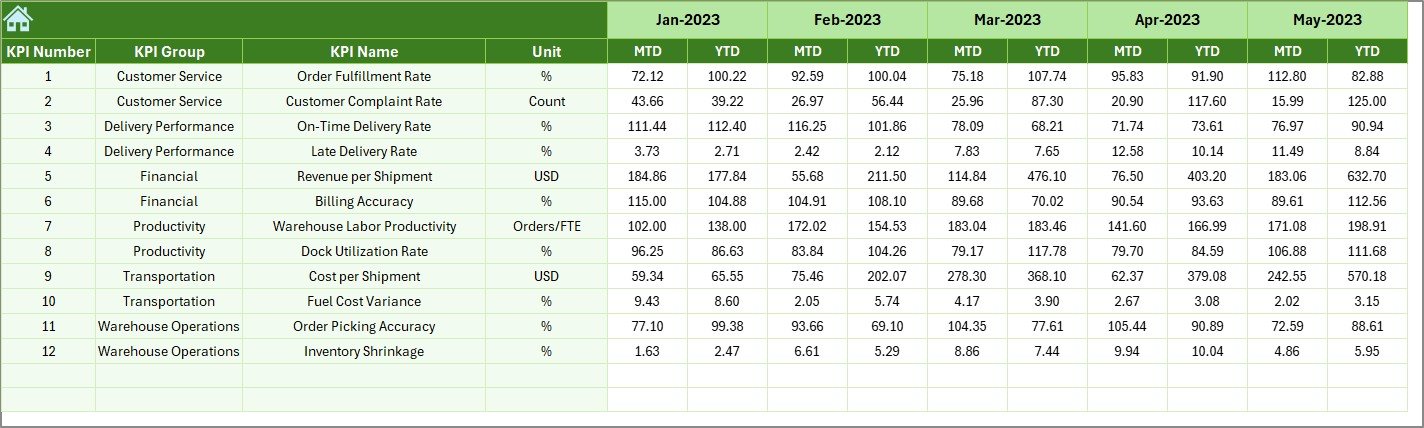
Why Is the Actual Numbers Input Sheet Important?
Actual Numbers Input Sheet
The Actual Numbers Input Sheet acts as the data entry layer for current-year performance.
How it works:
- Users enter MTD and YTD actual numbers
- Month selection happens in range E1
- Users input the first month of the year in range E1
This design ensures data consistency and prevents formula errors. Moreover, it separates data entry from analysis, which improves accuracy.
Click to buy Third-Party Logistics (3PL) KPI Dashboard in Excel
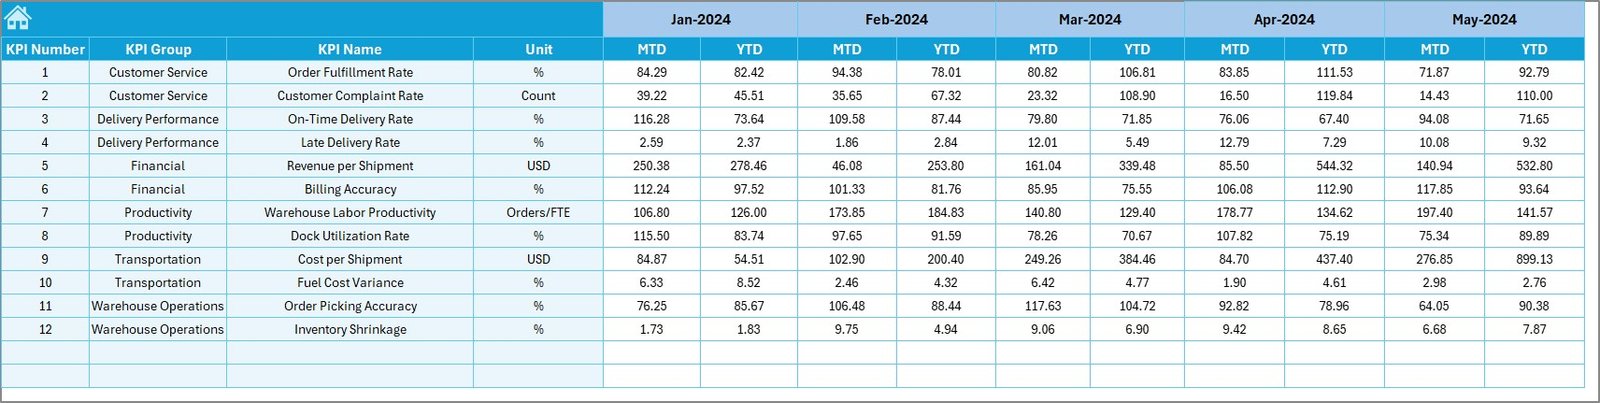
What Is the Role of the Target Sheet?
Target Sheet Tab
The Target Sheet stores planned performance values for each KPI.
Users enter:
- Monthly Target (MTD)
- Year-to-Date Target (YTD)
Because targets remain separate from actuals, the dashboard calculates variances automatically. As a result, managers can evaluate whether operations align with business goals.
Click to buy Third-Party Logistics (3PL) KPI Dashboard in Excel
Why Track Previous Year Numbers in a Separate Sheet?
Previous Year Number Sheet Tab
The Previous Year Sheet stores historical performance data.
Users enter previous-year values exactly as they enter current-year data. This structure enables:
- Year-over-Year (YoY) comparisons
- Trend analysis
- Seasonal performance review
Therefore, decision-makers can identify long-term improvements or declines.
Click to buy Third-Party Logistics (3PL) KPI Dashboard in Excel
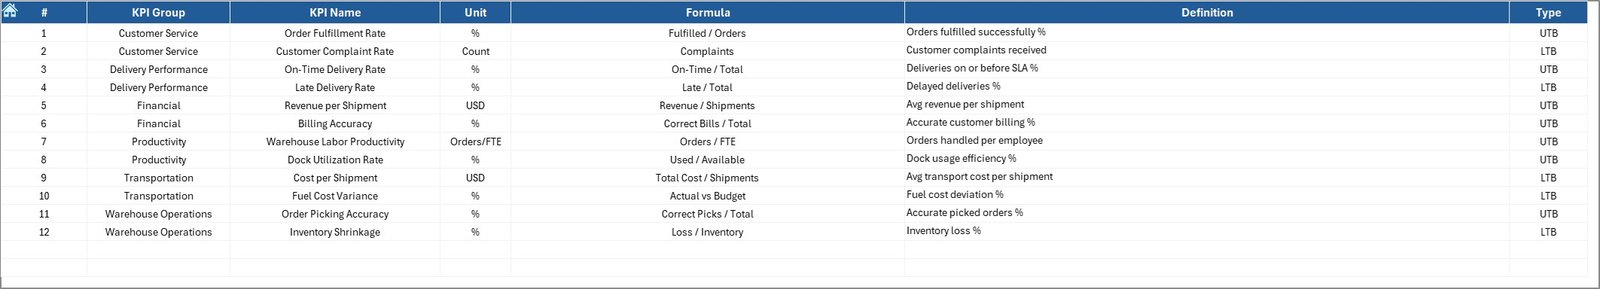
How Does the KPI Definition Sheet Improve Clarity?
KPI Definition Sheet Tab
The KPI Definition Sheet ensures standardization and clarity across the organization.
Users define:
- KPI Name
- KPI Group
- Unit
- Formula
- KPI Definition
Because of this sheet, everyone interprets KPIs consistently. Moreover, new employees can understand metrics quickly.
Click to buy Third-Party Logistics (3PL) KPI Dashboard in Excel
Advantages of Third-Party Logistics (3PL) KPI Dashboard in Excel
Using a 3PL KPI Dashboard in Excel offers several powerful advantages.
Key Advantages:
- Centralized performance tracking
- Improved decision-making
- Reduced reporting time
- Clear visibility into operations
- Cost-effective solution
- No advanced tools required
Additionally, Excel dashboards allow customization, which makes them suitable for small and large logistics providers alike.
What Are the Opportunities for Improvement in a 3PL KPI Dashboard?
Although the dashboard offers strong capabilities, continuous improvement always adds value.
Improvement Opportunities:
- Integration with ERP or WMS systems
- Automation using Power Query or VBA
- Adding client-wise or warehouse-wise filters
- Expanding predictive analytics
- Enhancing visual design
By improving gradually, organizations can evolve the dashboard with business growth.
Best Practices for the Third-Party Logistics (3PL) KPI Dashboard in Excel
To maximize the value of the dashboard, follow these best practices.
Best Practices:
- Define KPIs clearly before implementation
- Update data regularly and consistently
- Avoid manual formula changes
- Train users on KPI interpretation
- Review KPIs monthly and quarterly
- Align KPIs with business objectives
Following these practices ensures accuracy, reliability, and long-term success.
How Can a 3PL KPI Dashboard Improve Business Performance?
A 3PL KPI Dashboard in Excel improves performance by:
- Highlighting inefficiencies
- Improving accountability
- Supporting strategic planning
- Enhancing customer satisfaction
- Increasing profitability
Therefore, the dashboard becomes more than a reporting tool—it becomes a decision-support system.
Conclusion: Why Should You Use a Third-Party Logistics (3PL) KPI Dashboard in Excel?
In today’s fast-paced logistics environment, visibility and control define success. A Third-Party Logistics (3PL) KPI Dashboard in Excel provides a structured, affordable, and powerful way to monitor performance, identify gaps, and drive continuous improvement.
Because it combines operational, financial, and service-level KPIs in one place, decision-makers gain clarity and confidence. Moreover, Excel’s flexibility ensures easy adoption without heavy investments.
In short, this dashboard helps 3PL companies move from reactive management to proactive performance optimization.
Frequently Asked Questions (FAQs)
What is a 3PL KPI Dashboard in Excel?
A 3PL KPI Dashboard in Excel is a performance tracking tool that monitors logistics KPIs such as delivery, cost, and service levels using Excel.
Who should use a 3PL KPI Dashboard?
Logistics managers, warehouse managers, operations teams, finance teams, and executives can use this dashboard.
Can small logistics companies use this dashboard?
Yes, the dashboard suits both small and large 3PL providers because Excel remains scalable and flexible.
Does this dashboard require advanced Excel skills?
No, users only need basic Excel knowledge to enter data and view results.
How often should KPIs be updated?
Teams should update KPIs monthly or weekly, depending on business needs.
Can this dashboard integrate with other systems?
While the basic version relies on manual input, advanced users can integrate it with ERP or WMS systems.
Is Excel suitable for long-term KPI tracking?
Yes, Excel works well for KPI tracking when structured properly and maintained regularly.
Visit our YouTube channel to learn step-by-step video tutorials
Watch the step-by-step video tutorial:
Click to buy Third-Party Logistics (3PL) KPI Dashboard in Excel