Film production houses operate in a high-pressure environment. Budgets run into millions. Schedules change frequently. Creative goals must align with financial realities. Therefore, production teams need clear and timely insights to stay on track. That is exactly where a Film Production Houses KPI Dashboard in Excel becomes essential.
In this detailed guide, you will learn what a Film Production Houses KPI Dashboard in Excel is, why production teams rely on it, how it works, and how each worksheet supports better decisions. Moreover, you will explore its advantages, best practices, real-world use cases, and frequently asked questions. By the end, you will clearly understand how this dashboard can transform raw production data into actionable insights for film studios, independent producers, and media companies.
Click to buy Film Production Houses KPI Dashboard in Excel
What Is a Film Production Houses KPI Dashboard in Excel?
A Film Production Houses KPI Dashboard in Excel is a structured and interactive reporting tool designed to track key performance indicators related to film production, budgeting, scheduling, and operational efficiency.
Instead of reviewing scattered spreadsheets for cost tracking, shooting schedules, crew productivity, and budget variances, this dashboard consolidates everything into one organized Excel file. As a result, producers, production managers, and finance teams can monitor performance quickly and respond faster.
Moreover, Excel-based dashboards remain popular because they are flexible, affordable, and widely used across production houses of all sizes. Since most teams already work with Excel, they can adopt this dashboard without complex software training.
Why Do Film Production Houses Need a KPI Dashboard?
Film production involves multiple moving parts. Therefore, even small delays or cost overruns can impact the entire project. A KPI dashboard helps production teams stay in control.
Key reasons why this dashboard matters:
- It provides real-time visibility into production performance
- It highlights cost overruns before they become critical
- It supports better coordination between creative and financial teams
- It reduces dependency on manual reporting
- It enables faster and more confident decision-making
Moreover, when stakeholders review KPIs visually, they understand the situation immediately. Consequently, meetings become more focused and productive.
What KPIs Can Be Tracked in a Film Production Dashboard?
A Film Production Houses KPI Dashboard in Excel can track a wide range of production-related metrics. These KPIs help teams measure performance across planning, execution, and post-production phases.
Common KPIs include:
- Budget Utilization Percentage
- Cost Variance (Actual vs Target)
- Shooting Schedule Adherence
- Scene Completion Rate
- Crew Productivity Rate
- Equipment Utilization
- Post-Production Progress
- Rework or Reshoot Percentage
- Marketing Spend vs Budget
- Revenue Forecast vs Actual
Since the dashboard allows customization, production houses can easily add or remove KPIs based on project needs.
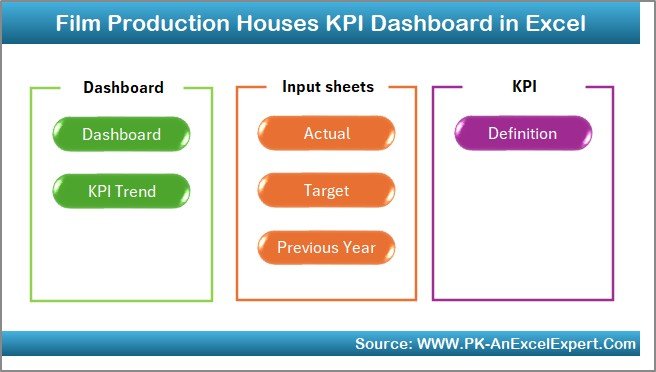
How Is the Film Production Houses KPI Dashboard Structured?
This dashboard includes 7 well-structured worksheets, each designed to serve a specific purpose. Together, they provide a complete performance tracking solution.
Let us explore each sheet in detail.
What Is the Summary Page and How Does It Help?
Summary Page (Index Sheet)
The Summary Page acts as the entry point of the dashboard. It improves navigation and user experience.
Key features of the Summary Page:
- Serves as an index for the entire dashboard
Film Production Houses KPI Dashboard in Excel - Contains 6 navigation buttons
- Allows users to jump directly to required sheets
- Reduces time spent searching across worksheets
Because of this design, even non-technical users can explore the dashboard comfortably.
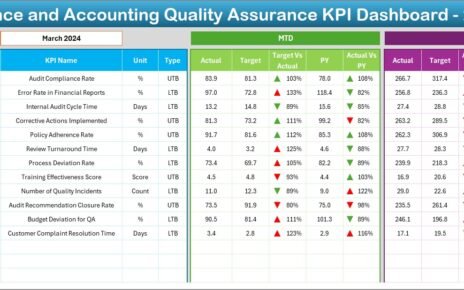
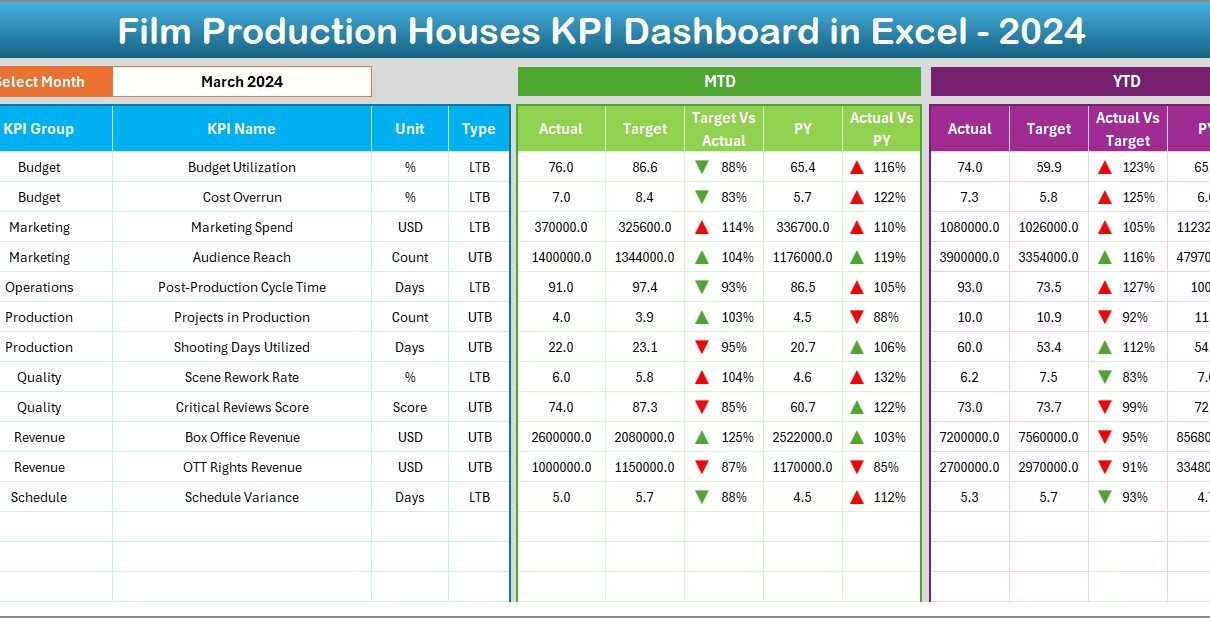
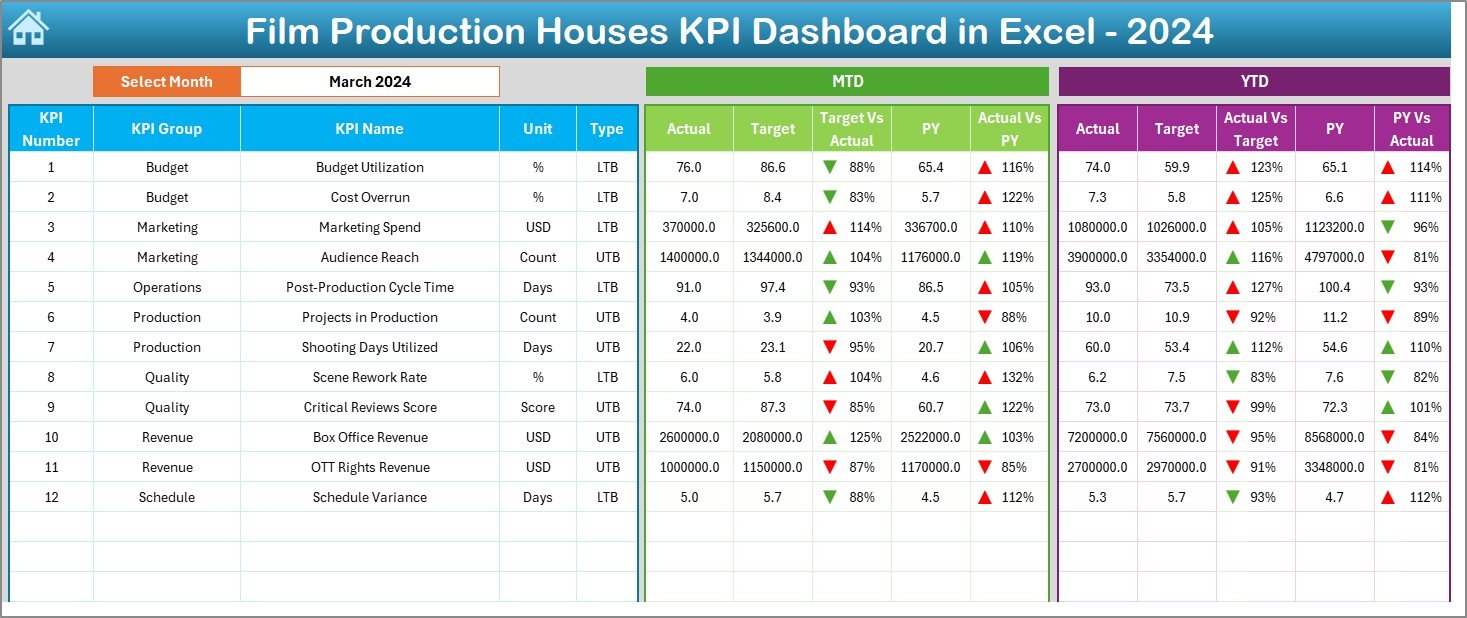
How Does the Dashboard Sheet Provide KPI Insights?
Dashboard Sheet Tab
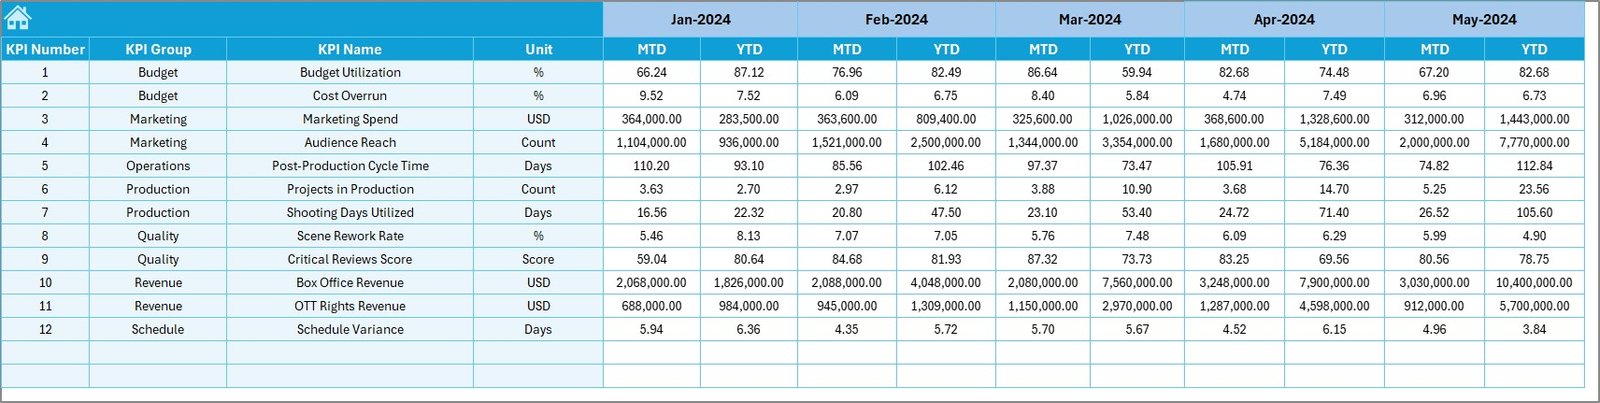
The Dashboard Sheet is the heart of the KPI Dashboard in Excel. It displays all key metrics in one consolidated view.
Key highlights of the Dashboard Sheet:
- Month selection dropdown at cell D3
- Dynamic update of all KPIs based on selected month
- Display of MTD (Month-to-Date) metrics
- Display of YTD (Year-to-Date) metrics
- Comparison with Target and Previous Year values
KPI Comparisons Shown:
- Actual vs Target
- Actual vs Previous Year
Additionally, conditional formatting with up and down arrows visually indicates performance trends. As a result, users can instantly identify areas performing well and areas requiring attention.
Click to buy Film Production Houses KPI Dashboard in Excel
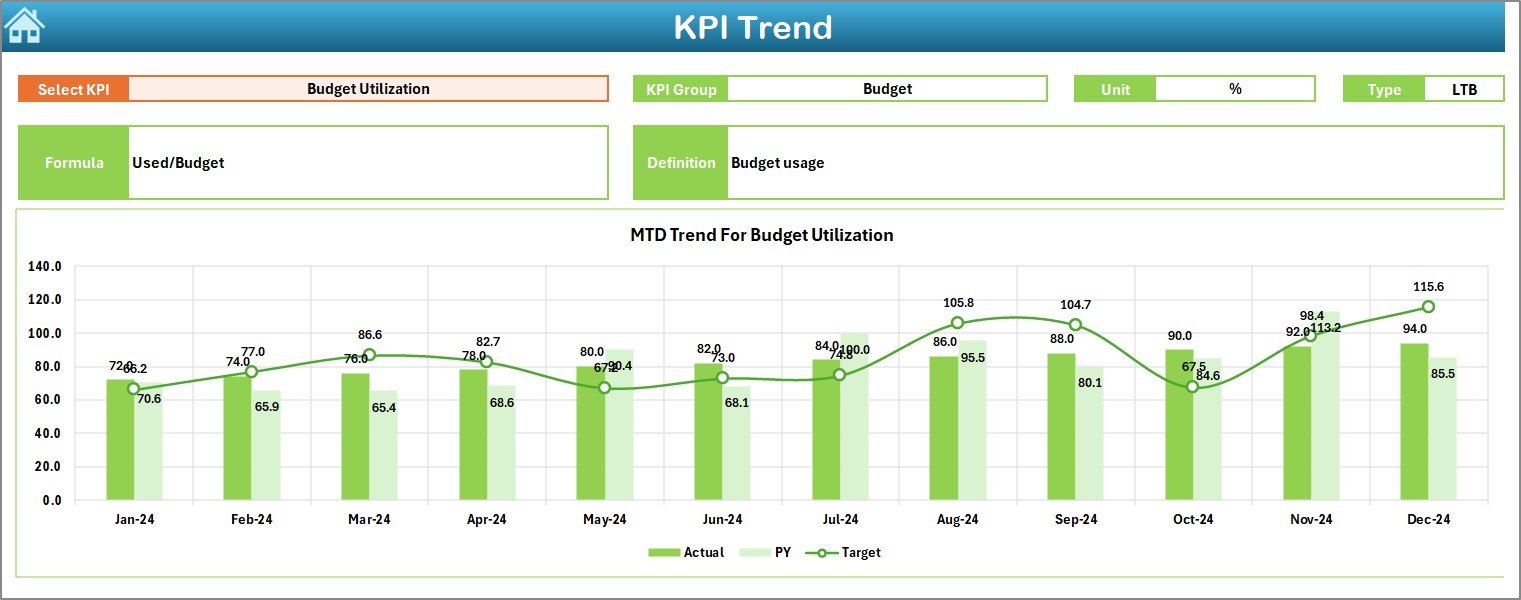
How Does the Trend Sheet Support Performance Analysis?
Trend Sheet Tab
The Trend Sheet focuses on detailed KPI-level analysis. It allows users to drill down into individual KPIs.
Key features include:
- KPI selection dropdown at cell C3
- Display of selected KPI’s:
KPI Group
Unit of Measurement
KPI Type (LTB or UTB)
KPI Formula
KPI Definition
Charts Available on the Trend Sheet:
- MTD trend for Actual, Target, and Previous Year
- YTD trend for Actual, Target, and Previous Year
Because trends show performance over time, production managers can identify recurring issues early and plan corrective actions accordingly.
Click to buy Film Production Houses KPI Dashboard in Excel
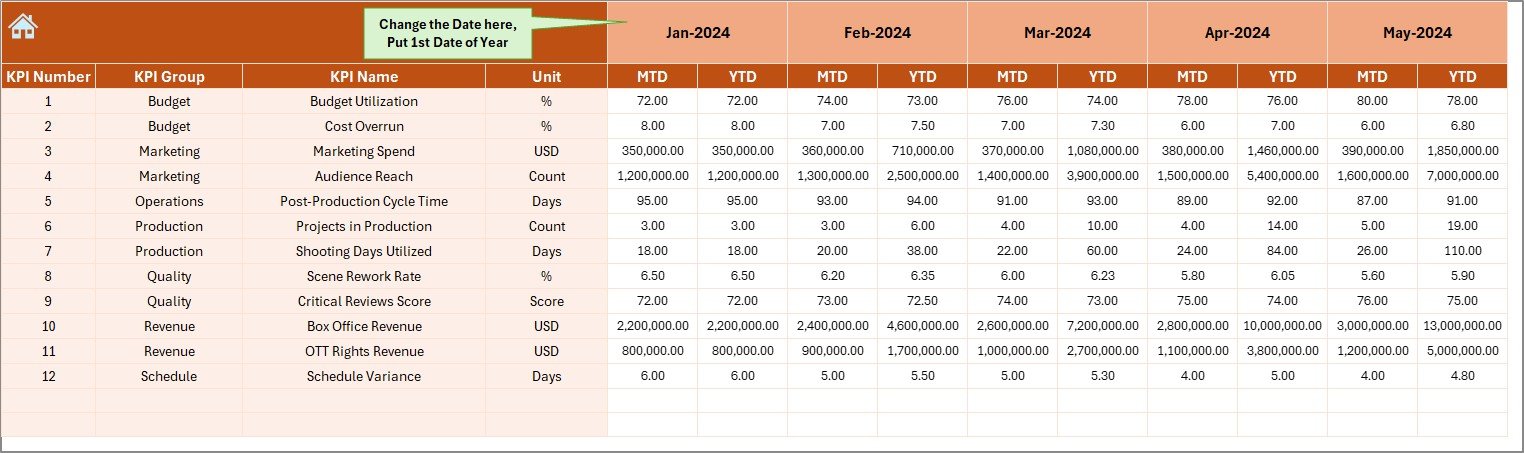
Where Should Actual Production Data Be Entered?
Actual Numbers Input Sheet
This sheet handles the core data entry for actual performance.
How this sheet works:
- Users enter MTD and YTD actual values
- Month selection is controlled from cell E1
- Users only need to input the first month of the year
- The dashboard automatically adjusts calculations
This approach reduces manual effort while ensuring data consistency across months.
Click to buy Film Production Houses KPI Dashboard in Excel
How Are Target KPIs Managed in the Dashboard?
Target Sheet Tab
The Target Sheet stores planned or benchmark values for each KPI.
Key inputs include:
- MTD Target values
- YTD Target values
- Monthly target planning for all KPIs
By comparing actual performance against targets, production teams can measure efficiency and accountability more effectively.
Click to buy Film Production Houses KPI Dashboard in Excel
Why Is the Previous Year Comparison Important?
Previous Year Number Sheet Tab
This sheet captures historical performance data from the previous year.
Benefits of this sheet:
- Enables year-over-year comparison
- Helps identify growth or decline patterns
- Supports long-term strategic planning
Since film production often follows seasonal patterns, previous year analysis becomes extremely valuable.

Click to buy Film Production Houses KPI Dashboard in Excel
What Is the Role of the KPI Definition Sheet?
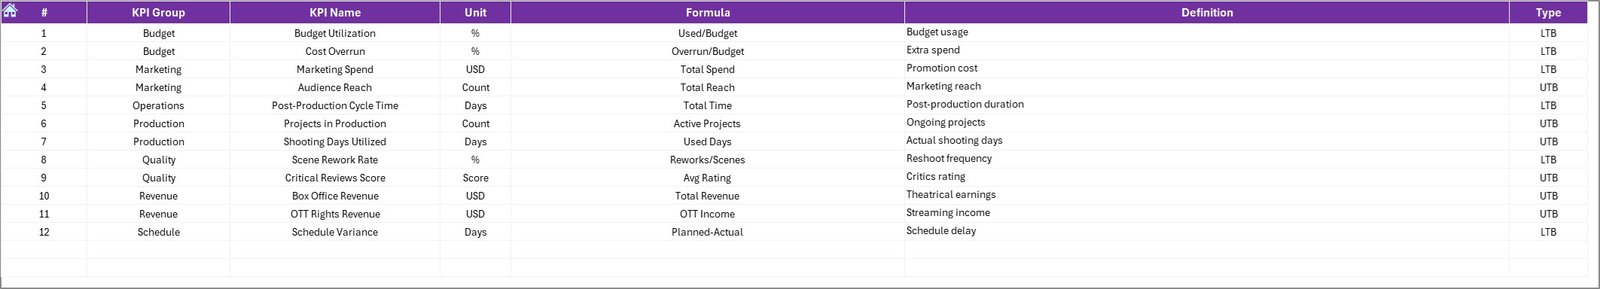
KPI Definition Sheet Tab
The KPI Definition Sheet acts as a reference guide.
Information stored in this sheet:
- KPI Name
- KPI Group
- Unit of Measurement
- KPI Formula
- KPI Definition
This sheet ensures clarity and consistency. As a result, all stakeholders interpret KPIs in the same way.
Click to buy Film Production Houses KPI Dashboard in Excel
Advantages of Film Production Houses KPI Dashboard in Excel
A Film Production Houses KPI Dashboard in Excel offers several practical advantages.
Key Advantages:
- Centralized Performance Tracking – Monitor all KPIs in one place
- Time-Saving Reporting – Reduce manual report preparation
- Budget Control – Track cost overruns early
- Production Efficiency – Improve scheduling and resource utilization
- Data-Driven Decisions – Base decisions on real-time insights
- Flexible & Customizable – Modify KPIs as projects change
Because Excel remains accessible and familiar, teams adopt the dashboard quickly without resistance.
Best Practices for the Film Production Houses KPI Dashboard in Excel
To get the maximum value from your dashboard, follow these best practices.
Best Practices You Should Follow:
- Define KPIs clearly before implementation
- Keep KPI definitions simple and measurable
- Update actual data consistently every month
- Validate data inputs to avoid errors
- Use visual indicators like arrows and charts
- Limit KPIs to what truly matters
- Review dashboard results in regular meetings
- Archive old projects separately for clarity
When teams follow these practices, the dashboard becomes a powerful management tool rather than just a reporting file.
Who Can Use This KPI Dashboard?
This dashboard suits a wide range of users in the film and media industry.
Ideal Users Include:
- Film Production Houses
- Independent Producers
- Production Managers
- Finance and Budget Teams
- Studio Executives
- Media and Entertainment Companies
Whether the project involves a short film or a large-scale production, this dashboard adapts easily.
How Does This Dashboard Improve Decision-Making?
The dashboard turns complex data into simple visuals. Therefore, decision-makers spend less time analyzing numbers and more time taking action.
Decision-Making Benefits:
- Identify delays before they escalate
- Control budgets proactively
- Align creative goals with financial constraints
- Improve accountability across teams
- Support strategic planning with trends
As a result, production houses reduce risk while improving overall project outcomes.
Conclusion: Is a Film Production KPI Dashboard in Excel Worth It?
Absolutely. A Film Production Houses KPI Dashboard in Excel provides clarity, control, and confidence in managing film projects. It simplifies performance tracking while supporting smarter decisions across creative and operational teams.
Since it combines flexibility, affordability, and ease of use, this dashboard becomes an invaluable tool for modern film production environments. When used consistently, it transforms scattered production data into meaningful insights that drive success.
Frequently Asked Questions About Film Production Houses KPI Dashboard in Excel
What is a Film Production KPI Dashboard in Excel used for?
It tracks production, budget, and operational KPIs in one interactive Excel file, helping teams monitor performance efficiently.
Can this dashboard handle multiple film projects?
Yes. You can create separate files or customize KPIs for each project based on requirements.
Do I need advanced Excel skills to use this dashboard?
No. Basic Excel knowledge is enough to input data and navigate the dashboard.
Can KPIs be customized?
Yes. You can add, remove, or modify KPIs easily using the KPI Definition sheet.
How often should data be updated?
Monthly updates work best. However, you can update more frequently if needed.
Is this dashboard suitable for small production houses?
Yes. It works well for both small and large production teams due to its flexibility.
Visit our YouTube channel to learn step-by-step video tutorials
Watch the step-by-step video tutorial:
Click to buy Film Production Houses KPI Dashboard in Excel