Creative agencies work in a fast-moving and highly competitive environment. Therefore, agencies must track performance carefully to stay profitable, productive, and client-focused. However, when data remains scattered across multiple Excel files, emails, and reports, decision-making becomes slow and unclear.
That is exactly why a Creative Agencies KPI Dashboard in Excel becomes essential.
This article explains everything you need to know about a Creative Agencies KPI Dashboard in Excel. You will learn what it is, why it matters, how it works, its sheet-wise structure, key KPIs, advantages, best practices, and common questions answered clearly. By the end, you will fully understand how this dashboard helps creative agencies improve efficiency, control costs, and scale operations confidently.
Click to buy Creative Agencies KPI Dashboard in Excel
What Is a Creative Agencies KPI Dashboard in Excel?
A Creative Agencies KPI Dashboard in Excel is a centralized performance management tool designed to track, analyze, and monitor key performance indicators for creative agencies.
Instead of managing multiple spreadsheets, agencies use one interactive Excel dashboard to monitor performance. As a result, leadership teams gain instant visibility into productivity, profitability, utilization, and delivery performance.
Moreover, this dashboard converts raw data into meaningful insights through charts, tables, and visual indicators. Because Excel remains widely used, this dashboard works without any complex software or technical setup.
Why Do Creative Agencies Need KPI Tracking?
Creative agencies handle multiple clients, projects, and resources at the same time. Therefore, tracking performance manually becomes risky and inefficient.
Without KPI tracking:
- Teams lose visibility into productivity
- Costs exceed budgets unexpectedly
- Deadlines slip frequently
- Profit margins shrink
However, when agencies track KPIs consistently, they:
- Identify problems early
- Compare actual results with targets
- Improve resource planning
- Increase client satisfaction
As a result, KPI tracking becomes a foundation for sustainable agency growth.
How Does a Creative Agencies KPI Dashboard in Excel Work?
A Creative Agencies KPI Dashboard in Excel works by connecting structured input sheets with automated calculations and visual outputs.
First, users enter actual, target, and previous-year values. Then, Excel formulas calculate MTD and YTD metrics automatically. Finally, the dashboard displays performance using tables, trend charts, and indicators.
Because everything updates dynamically, users always see accurate and current insights.
What Are the Key Features of a Creative Agencies KPI Dashboard in Excel?
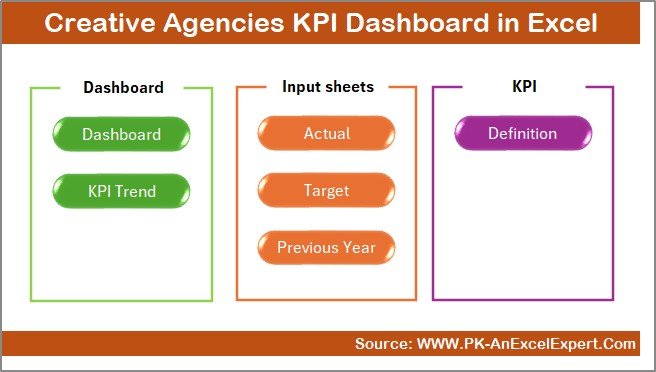
This Creative Agencies KPI Dashboard in Excel comes with a well-structured and professional design. It includes 7 powerful worksheets, each serving a specific purpose.
Let us explore each sheet in detail.
Summary Page
The Summary Page acts as an index and navigation hub.
Key Highlights of the Summary Page:
- Serves as the first landing page
- Includes 6 navigation buttons
- Allows users to jump to any worksheet instantly
- Improves usability and navigation
As a result, users save time and access information faster.
Click to buy Creative Agencies KPI Dashboard in Excel
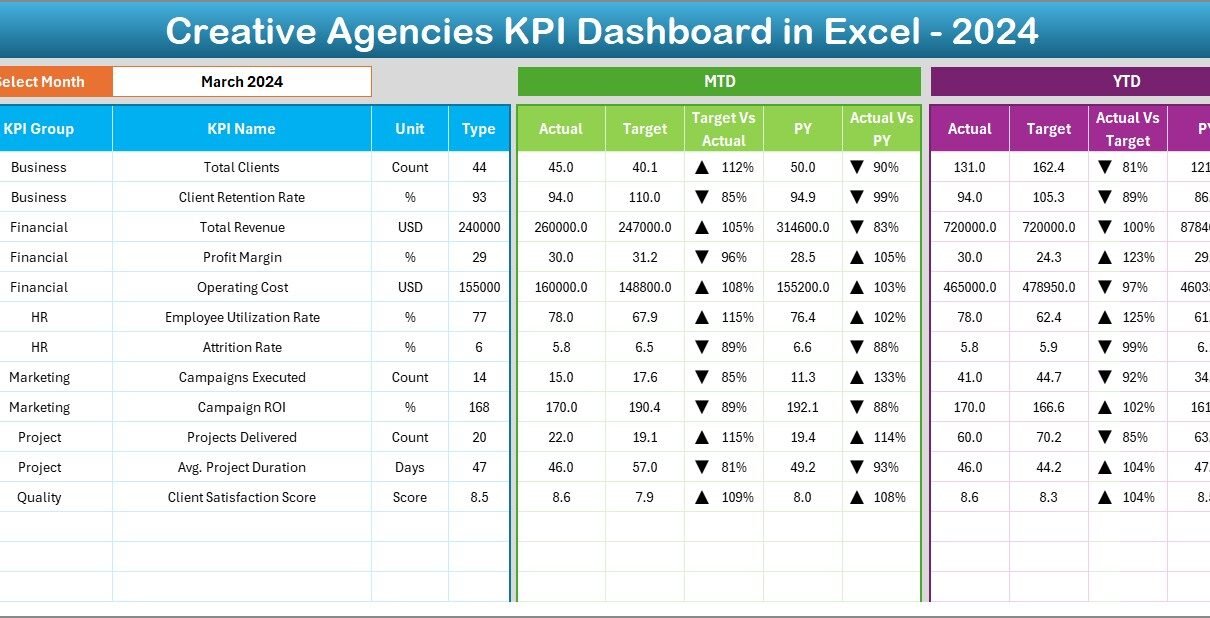
Dashboard Sheet Tab
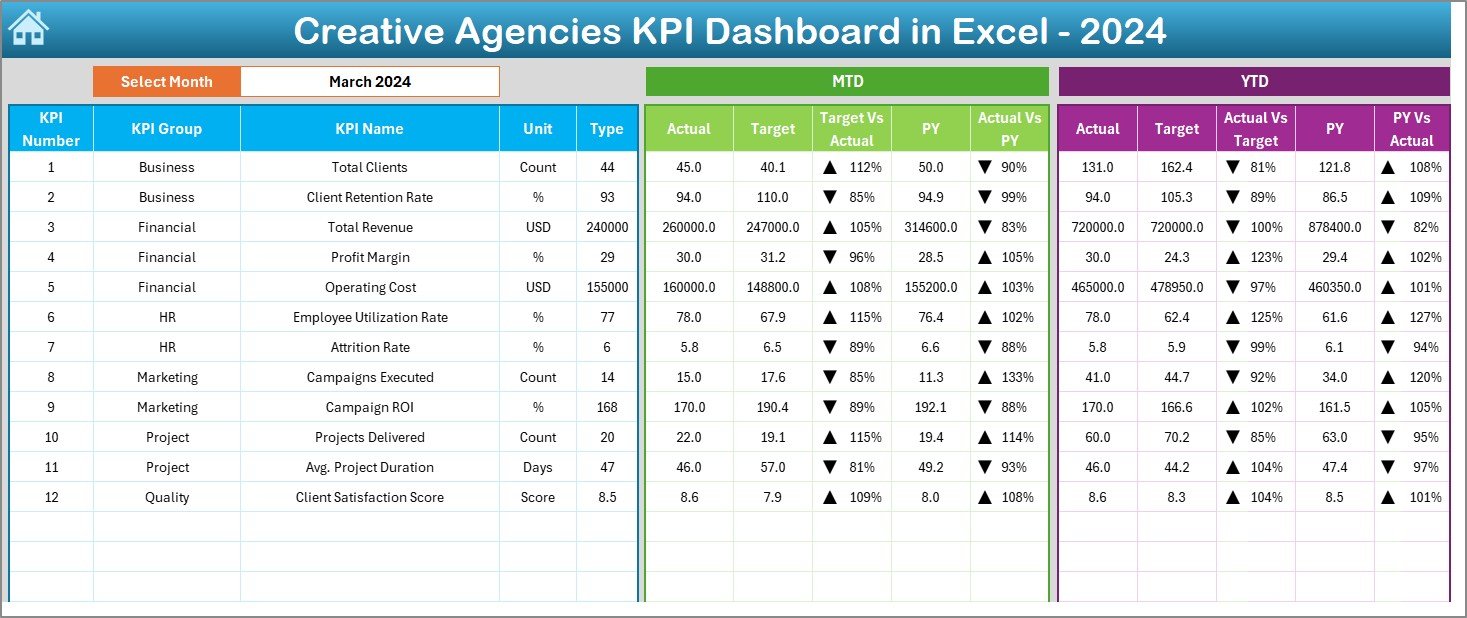
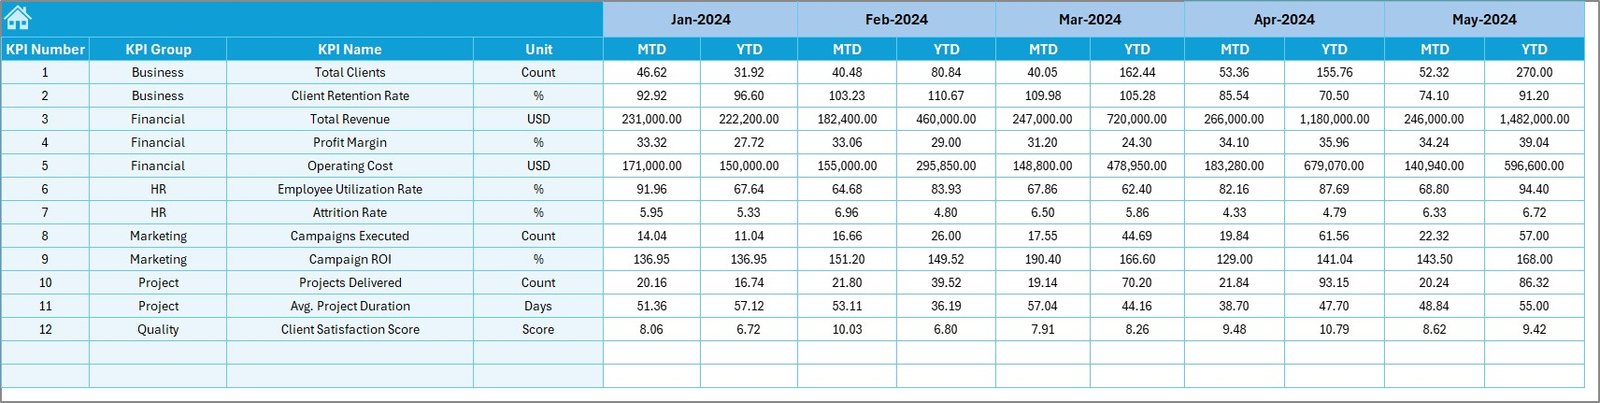
The Dashboard Sheet Tab is the heart of the Creative Agencies KPI Dashboard in Excel.
Key Features of the Dashboard Sheet:
- Displays all KPIs in one view
- Includes a Month selector on range D3
- Automatically updates data when the month changes
KPIs Displayed on the Dashboard:
- MTD Actual
- MTD Target
- MTD Previous Year
- Target vs Actual (with up/down arrows)
- Previous Year vs Actual (with arrows)
Additionally, the dashboard shows:
- YTD Actual
- YTD Target
- YTD Previous Year
- YTD Target vs Actual
- YTD Previous Year vs Actual
Because of conditional formatting arrows, users instantly identify overperformance and underperformance.
Click to buy Creative Agencies KPI Dashboard in Excel
KPI Trend Sheet
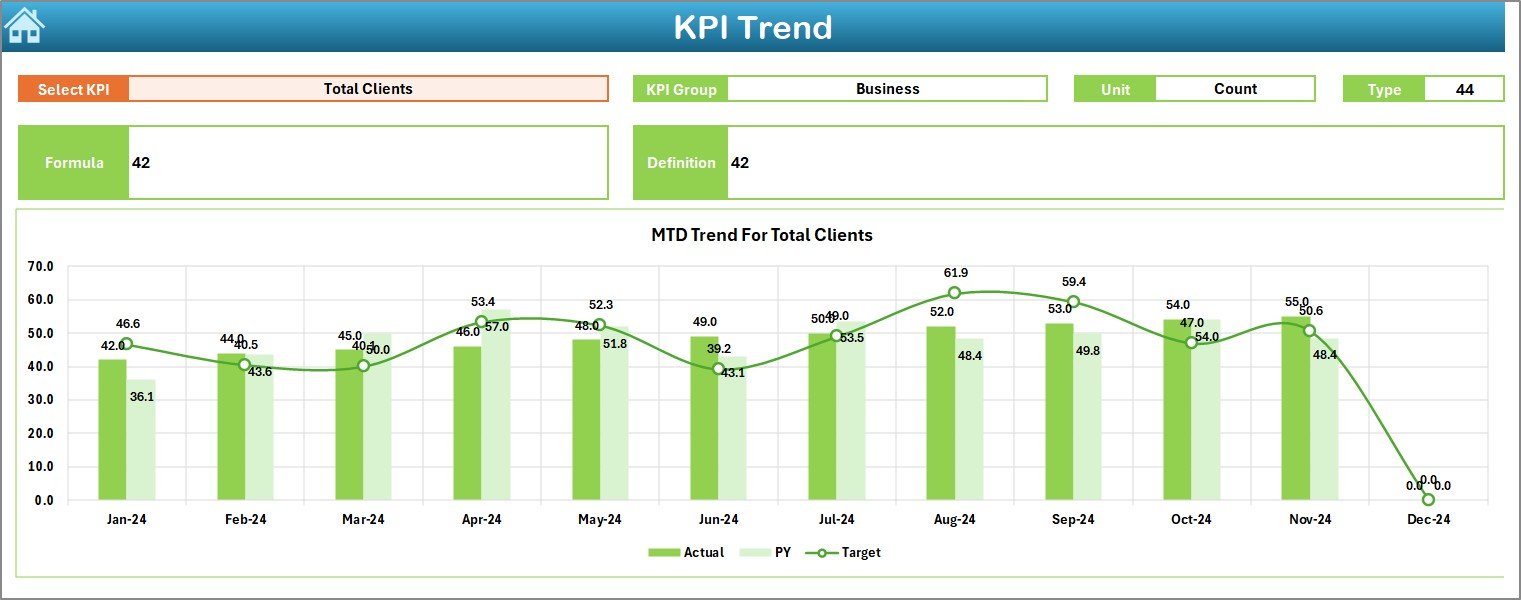
The Trend Sheet Tab focuses on deep KPI analysis.
Features of the Trend Sheet:
- KPI selection dropdown on range C3
- Displays KPI Group
- Shows Unit of KPI
- Indicates KPI Type (Upper the Better or Lower the Better)
- Explains KPI Formula
- Provides clear KPI Definition
Trend Analysis:
- MTD trend chart for Actual, Target, and Previous Year
- YTD trend chart for Actual, Target, and Previous Year
As a result, users analyze performance patterns over time instead of relying on single-month results.
Click to buy Creative Agencies KPI Dashboard in Excel
Actual Numbers Input Sheet
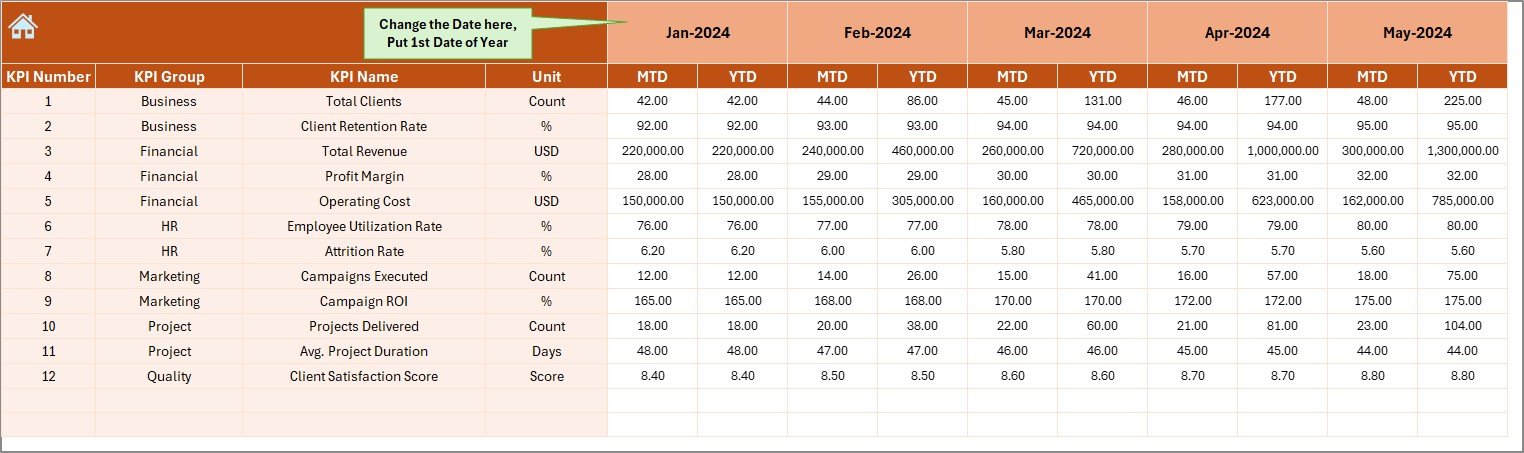
The Actual Numbers Input Sheet captures real performance data.
How This Sheet Works:
- Users enter MTD and YTD actual values
- Month selection available on range E1
- Users input the first month of the year on E1
- Excel adjusts calculations automatically
Because of this structure, data entry stays simple and error-free.
Click to buy Creative Agencies KPI Dashboard in Excel
Target Sheet Tab
The Target Sheet Tab stores planned performance values.
Purpose of the Target Sheet:
- Enter monthly MTD targets
- Enter cumulative YTD targets
- Set performance benchmarks
As a result, agencies compare actual performance against goals clearly.
Click to buy Creative Agencies KPI Dashboard in Excel
Previous Year Number Sheet
The Previous Year Number Sheet enables historical comparison.
Key Benefits:
- Enter last year’s MTD values
- Enter last year’s YTD values
- Enable year-over-year analysis
Because trends matter in creative agencies, this comparison supports better forecasting and planning.

Click to buy Creative Agencies KPI Dashboard in Excel
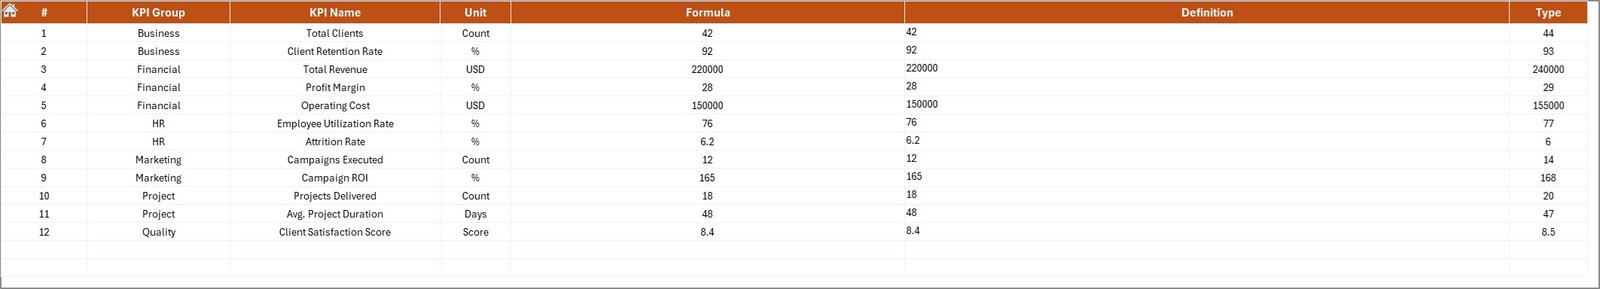
KPI Definition Sheet
The KPI Definition Sheet ensures clarity and consistency.
Information Captured:
- KPI Name
- KPI Group
- Unit of Measurement
- KPI Formula
- KPI Definition
As a result, everyone in the organization understands KPIs the same way.
Click to buy Creative Agencies KPI Dashboard in Excel
What KPIs Can Creative Agencies Track Using This Dashboard?
Creative agencies track multiple KPIs across productivity, finance, and delivery.
Common Creative Agency KPIs:
- Billable Utilization Rate
- Revenue per Employee
- Project Profit Margin
- Client Retention Rate
- On-Time Project Delivery %
- Average Turnaround Time
- Cost Variance
- Budget Utilization
- Creative Output per Resource
Because this dashboard stays flexible, agencies customize KPIs easily.
Advantages of Creative Agencies KPI Dashboard in Excel
Using a Creative Agencies KPI Dashboard in Excel offers multiple advantages.
- Centralized Performance Monitoring
The dashboard brings all KPIs into one file. Therefore, teams stop managing scattered spreadsheets.
- Improved Decision-Making
Because data updates automatically, leaders make faster and better decisions.
- Better Resource Utilization
By tracking utilization and productivity, agencies allocate resources efficiently.
- Clear Target Tracking
The dashboard highlights gaps between actual and target values instantly.
- Historical Performance Comparison
Previous-year data reveals growth patterns and recurring issues.
- No Complex Software Required
Excel works on most systems, so agencies avoid expensive tools.
How Does This Dashboard Improve Agency Productivity?
This dashboard improves productivity in several ways.
First, it reduces manual reporting effort.
Second, it eliminates calculation errors.
Third, it highlights performance gaps early.
As a result, teams focus more on creative work and less on reporting.
Best Practices for the Creative Agencies KPI Dashboard in Excel
Following best practices ensures maximum value from the dashboard.
- Define KPIs Clearly
Always document KPIs in the KPI Definition Sheet before tracking them.
- Update Data Regularly
Enter actual and target values monthly without delays.
- Review Trends, Not Just Numbers
Use the Trend Sheet to analyze patterns over time.
- Align KPIs With Business Goals
Choose KPIs that support revenue growth, efficiency, and client satisfaction.
- Train Team Members
Ensure everyone understands how to read and interpret the dashboard.
Who Should Use a Creative Agencies KPI Dashboard in Excel?
This dashboard benefits:
- Creative agency owners
- Operations managers
- Finance teams
- Project managers
- Strategy consultants
Because the dashboard stays flexible, both small and large agencies benefit.
Conclusion: Why Creative Agencies KPI Dashboard in Excel Is a Must-Have
A Creative Agencies KPI Dashboard in Excel transforms how agencies track and manage performance. Instead of guessing outcomes, agencies rely on real data.
Moreover, this dashboard improves visibility, accountability, and profitability. Because it uses Excel, teams adopt it quickly without technical barriers.
Ultimately, agencies that track KPIs consistently outperform those that rely on intuition alone.
Frequently Asked Questions (FAQs)
What is a Creative Agencies KPI Dashboard in Excel?
It is a centralized Excel-based tool that tracks key performance indicators for creative agencies.
Can I customize KPIs in this dashboard?
Yes, you can easily add, modify, or remove KPIs.
Do I need advanced Excel skills to use it?
No, basic Excel knowledge is sufficient.
How often should I update the dashboard?
You should update it monthly for accurate insights.
Can small agencies use this dashboard?
Yes, it works perfectly for agencies of all sizes.
Does this dashboard support year-over-year comparison?
Yes, it includes a dedicated Previous Year Numbers sheet.
Visit our YouTube channel to learn step-by-step video tutorials
Watch the step-by-step video tutorial: