Greenhouse farming has transformed modern agriculture by enabling year-round production, controlled growing conditions, and higher crop yields. However, as greenhouse operations grow in size and complexity, managing performance without proper analytics becomes difficult. Therefore, farmers and agribusiness managers need a structured, data-driven approach to monitor productivity, cost efficiency, and sustainability.
That is exactly where a Greenhouse Farming KPI Dashboard in Excel becomes a powerful and practical solution.
This detailed article explains what a Greenhouse Farming KPI Dashboard in Excel is, why it matters, how it works, its worksheet-wise structure, advantages, best practices, and frequently asked questions. Moreover, the language remains simple, clear, and actionable so you can implement the dashboard confidently without technical complexity.
Click to buy Greenhouse Farming KPI Dashboard in Excel
What Is a Greenhouse Farming KPI Dashboard in Excel?
A Greenhouse Farming KPI Dashboard in Excel is a ready-to-use performance monitoring tool that helps greenhouse operators track key performance indicators (KPIs) from a single, centralized dashboard. Instead of managing scattered Excel sheets, handwritten logs, or static reports, this dashboard brings all operational, production, and efficiency metrics together.
As a result, decision-makers gain instant visibility into greenhouse performance across months and years.
This dashboard focuses on:
- Crop productivity
- Resource utilization
- Target vs actual performance
- Month-to-Date (MTD) and Year-to-Date (YTD) results
- Historical comparisons with previous year data
Most importantly, the dashboard updates dynamically based on selected months, which allows quick analysis and faster decisions.
Why Do Greenhouse Farms Need a KPI Dashboard?
Greenhouse farming depends heavily on data such as temperature control, water usage, yield per square meter, and cost per unit. However, when teams track this data manually, errors increase and insights remain hidden.
Therefore, a KPI dashboard becomes essential.
Key Challenges Without a KPI Dashboard
- Data remains scattered across multiple sheets
- Managers struggle to compare actual results with targets
- Performance trends stay unclear
- Historical comparisons take too much time
- Decision-making slows down
On the other hand, a well-designed Greenhouse Farming KPI Dashboard in Excel solves all these issues by converting raw data into meaningful insights.
How Does a Greenhouse Farming KPI Dashboard in Excel Work?
The dashboard works on a simple yet powerful concept. First, users enter actual, target, and previous year data into dedicated input sheets. Then, Excel formulas and visuals automatically calculate KPIs and display results on interactive dashboards.
Moreover, users can change the reporting month using a dropdown, and the entire dashboard updates instantly.
As a result, greenhouse managers can:
- Track performance monthly and yearly
- Identify gaps between targets and actuals
- Monitor improvement or decline compared to the previous year
- Focus on corrective actions quickly
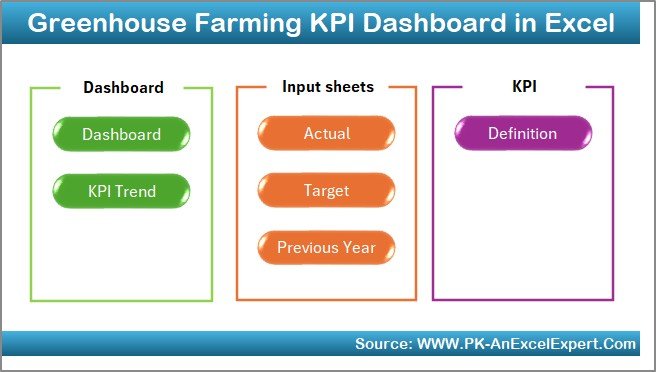
Worksheet Structure of the Greenhouse Farming KPI Dashboard in Excel
This Greenhouse Farming KPI Dashboard in Excel contains 7 well-structured worksheets, each designed for a specific purpose. Together, these sheets create a complete performance management system.
Summary Page – Why Is It Important?
The Summary Page works as an index and navigation hub.
Key Highlights of the Summary Page
- Acts as the home screen of the dashboard
- Contains 6 navigation buttons
- Allows users to jump instantly to any worksheet
- Improves usability and user experience
Because of this structure, even non-technical users can navigate the dashboard easily without confusion.
Click to buy Greenhouse Farming KPI Dashboard in Excel
Dashboard Sheet – What Does It Show?
The Dashboard Sheet serves as the core of the entire system.
Key Features of the Dashboard Sheet
- Month selection dropdown available at cell D3
- Automatically updates all KPIs based on the selected month
- Displays both MTD and YTD performance
KPIs Displayed on the Dashboard
- MTD Actual
- MTD Target
- MTD Previous Year
- Target vs Actual (%)
- Previous Year vs Actual (%)
Similarly, it also shows:
- YTD Actual
- YTD Target
- YTD Previous Year
- YTD Target vs Actual
- YTD Previous Year vs Actual
Visual Enhancements
- Conditional formatting with up and down arrows
- Quick identification of positive and negative performance
- Clean and professional layout
Therefore, managers can instantly understand whether performance improves or declines.

Click to buy Greenhouse Farming KPI Dashboard in Excel
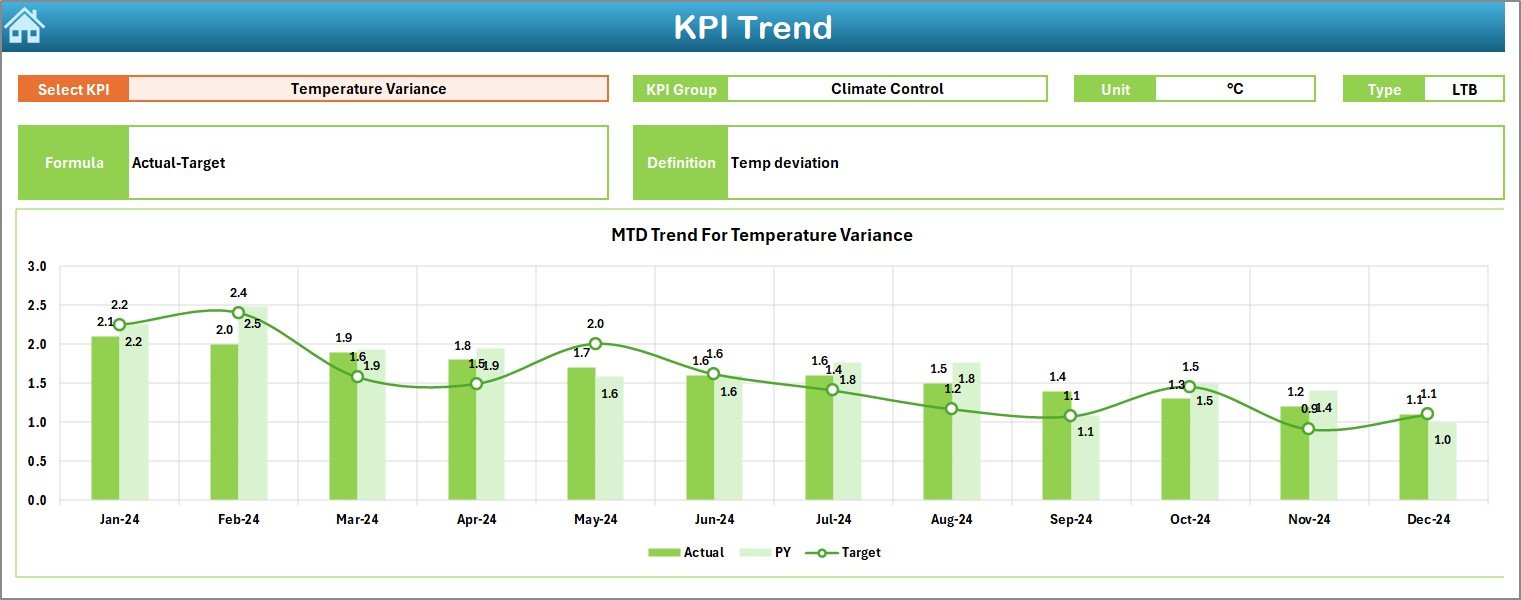
Trend Sheet – How Can You Analyze KPI Trends?
The Trend Sheet focuses on detailed KPI-level analysis.
What Can You Do on the Trend Sheet?
- Select the KPI Name from a dropdown at cell C3
- View complete KPI details instantly
KPI Details Displayed
- KPI Group
- KPI Unit
- KPI Type (Upper the Better or Lower the Better)
- KPI Formula
- KPI Definition
Trend Charts Available
- MTD Trend Chart for Actual, Target, and Previous Year
- YTD Trend Chart for Actual, Target, and Previous Year
Because of these charts, users can:
- Identify seasonal patterns
- Detect long-term improvement or decline
- Compare targets with historical performance
Click to buy Greenhouse Farming KPI Dashboard in Excel
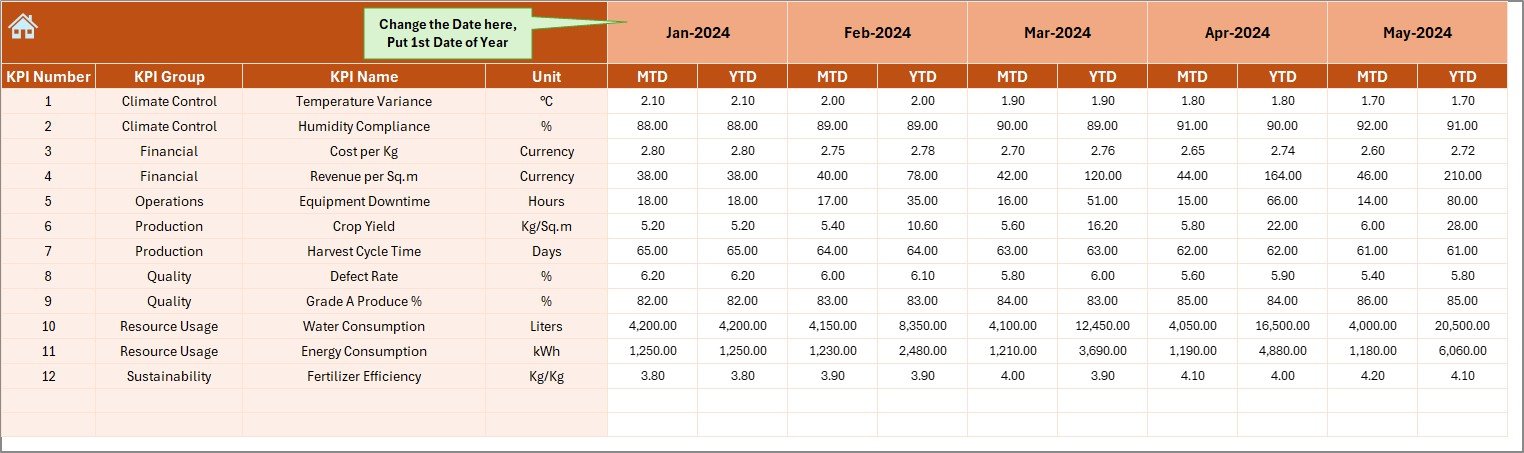
Actual Numbers Input Sheet – How Do You Enter Data?
The Actual Numbers Input Sheet stores real performance data.
Key Features
- Users enter MTD and YTD actual values
- Month selection available at cell E1
- Users only need to input the first month of the year
- Remaining months follow automatically
This structure reduces manual effort and improves accuracy.
Click to buy Greenhouse Farming KPI Dashboard in Excel
Target Sheet – How Are Goals Defined?
The Target Sheet helps define expected performance.
What You Enter in the Target Sheet
- Monthly MTD targets for each KPI
- Corresponding YTD targets
Because targets remain clearly defined, teams can:
- Align operations with goals
- Monitor progress consistently
- Identify underperforming areas early

Click to buy Greenhouse Farming KPI Dashboard in Excel
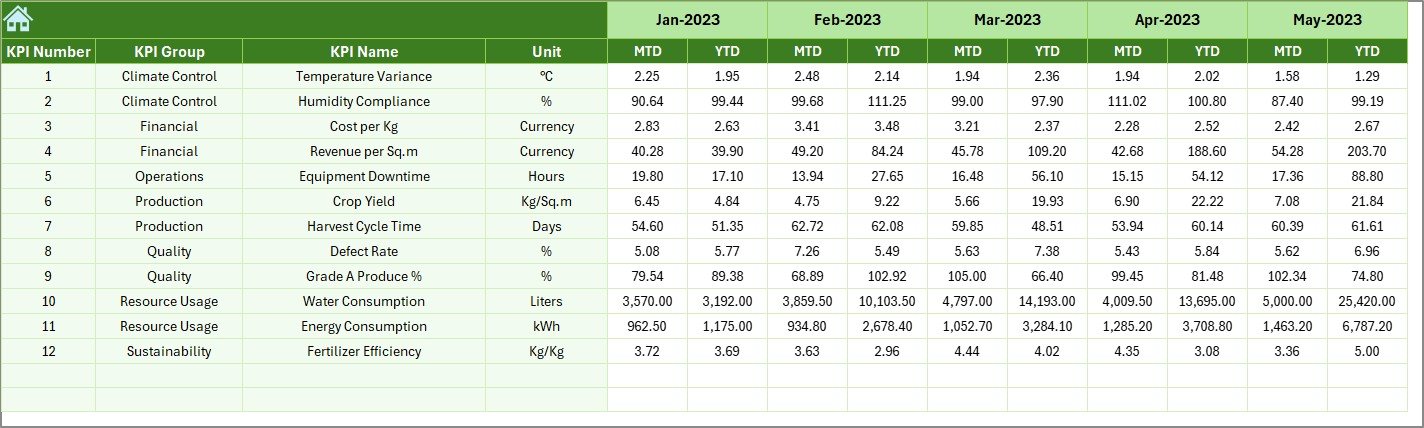
Previous Year Numbers Sheet – Why Compare Historical Data?
The Previous Year Numbers Sheet stores last year’s data.
Benefits of This Sheet
- Enables year-over-year comparison
- Helps identify growth or decline trends
- Supports realistic target setting
By analyzing past performance, greenhouse managers can plan future improvements more effectively.
Click to buy Greenhouse Farming KPI Dashboard in Excel
KPI Definition Sheet – Why Is It Critical?
The KPI Definition Sheet acts as a master reference.
Information Maintained Here
- KPI Name
- KPI Group
- Unit of Measurement
- Formula
- KPI Definition
This sheet ensures:
- Consistency across reports
- Clear understanding for all users
- Reduced confusion during data entry

Click to buy Greenhouse Farming KPI Dashboard in Excel
Advantages of Greenhouse Farming KPI Dashboard in Excel
A Greenhouse Farming KPI Dashboard in Excel delivers multiple operational and strategic benefits.
- Centralized Performance Monitoring
All KPIs appear in one place, which eliminates the need to check multiple files.
- Improved Decision-Making
Clear visuals and comparisons help managers take faster and smarter decisions.
- Easy Month and Year Analysis
MTD and YTD views simplify short-term and long-term performance tracking.
- Better Target Management
Target vs actual analysis highlights gaps instantly.
- Historical Performance Comparison
Previous year data provides context and supports continuous improvement.
- User-Friendly and Flexible
Excel-based design allows easy customization without advanced technical skills.
Who Can Use a Greenhouse Farming KPI Dashboard in Excel?
This dashboard suits a wide range of users, including:
- Greenhouse farm owners
- Agricultural managers
- Agribusiness consultants
- Sustainability analysts
- Operations and planning teams
Because of its flexibility, both small and large greenhouse operations can use it effectively.
Best Practices for the Greenhouse Farming KPI Dashboard in Excel
To get maximum value from the dashboard, follow these best practices.
- Define KPIs Clearly
Always use clear formulas and definitions in the KPI Definition Sheet.
- Update Data Regularly
Enter actual numbers consistently every month to maintain accuracy.
- Review Dashboard Monthly
Analyze results at least once a month to catch issues early.
- Use Trends for Planning
Rely on trend charts to predict future performance and plan resources.
- Align Targets with Reality
Set achievable targets based on historical data rather than assumptions.
- Keep the Dashboard Clean
Avoid unnecessary KPIs that dilute focus and clarity.
How Does This Dashboard Improve Sustainability?
Sustainability plays a critical role in greenhouse farming. Therefore, tracking KPIs related to efficiency helps reduce waste and improve resource usage.
This dashboard supports sustainability by:
- Monitoring productivity per unit area
- Tracking efficiency-related KPIs
- Encouraging data-driven optimization
As a result, farms achieve better yields with fewer resources.
Conclusion: Is a Greenhouse Farming KPI Dashboard in Excel Worth It?
A Greenhouse Farming KPI Dashboard in Excel transforms raw agricultural data into actionable insights. Instead of relying on intuition or fragmented reports, greenhouse managers gain clarity, control, and confidence.
Moreover, the structured worksheet design, dynamic visuals, and KPI-driven approach make this dashboard a powerful management tool. When used correctly, it improves productivity, efficiency, and profitability across greenhouse operations.
In short, this dashboard acts as a smart companion for modern greenhouse farming.
Frequently Asked Questions (FAQs)
What is a Greenhouse Farming KPI Dashboard in Excel?
It is an Excel-based tool that tracks greenhouse performance using KPIs with MTD, YTD, and year-over-year analysis.
Can beginners use this dashboard?
Yes, the dashboard uses simple navigation, dropdowns, and structured sheets, which makes it beginner-friendly.
Can I customize KPIs in the dashboard?
Yes, users can easily add, modify, or remove KPIs using the KPI Definition Sheet.
Does the dashboard support monthly analysis?
Yes, users can select any month, and the dashboard updates automatically.
Is Excel sufficient for greenhouse KPI tracking?
Yes, Excel provides flexibility, automation, and visualization, which makes it ideal for greenhouse KPI dashboards.
Can this dashboard support long-term planning?
Yes, trend charts and historical comparisons support strategic planning and forecasting.
Visit our YouTube channel to learn step-by-step video tutorials
Watch the step-by-step video tutorial:
Click to buy Greenhouse Farming KPI Dashboard in Excel