Managing a childcare or daycare service involves much more than daily operations and parent communication. You must track enrollments, attendance, staff efficiency, safety, finances, and service quality regularly. However, many childcare centers still rely on scattered Excel sheets and manual reports. As a result, insights remain hidden and decisions get delayed.
That is exactly why a Childcare Services KPI Dashboard in Excel becomes an essential management tool.
In this detailed guide, you will learn everything about the Childcare Services KPI Dashboard in Excel, including how it works, its sheet-wise structure, features, advantages, best practices, and frequently asked questions. Moreover, the explanation stays simple, practical, and business-focused so that anyone can use it confidently.
Click to Purchases Childcare Services KPI Dashboard in Excel
What Is a Childcare Services KPI Dashboard in Excel?
A Childcare Services KPI Dashboard in Excel is a ready-to-use performance tracking system designed specifically for childcare centers, daycare services, and early education facilities. It helps monitor key metrics such as enrollment, attendance, staff performance, safety, and financial health from one centralized dashboard.
Instead of checking multiple reports, you can analyze MTD (Month-to-Date) and YTD (Year-to-Date) performance instantly. As a result, childcare managers save time and gain better control over operations.
Why Do Childcare Services Need a KPI Dashboard?
Running a childcare center requires constant monitoring. However, without structured KPIs, important signals often go unnoticed.
A KPI dashboard helps because it:
-
Centralizes all performance metrics
-
Reduces manual reporting work
-
Highlights trends and issues early
-
Supports data-driven decisions
-
Improves transparency with stakeholders
Therefore, a KPI dashboard transforms raw data into actionable insights.
How Does the Childcare Services KPI Dashboard in Excel Work?
This dashboard follows a simple yet powerful approach:
-
You enter Actual, Target, and Previous Year data in input sheets
-
Excel formulas calculate MTD and YTD values automatically
-
Conditional formatting highlights performance status
-
Trend charts visualize progress over time
As a result, even non-technical users can understand performance easily.
What Worksheets Are Included in the Childcare Services KPI Dashboard?
Click to Purchases Childcare Services KPI Dashboard in Excel
This Childcare Services KPI Dashboard in Excel includes seven well-structured worksheets, each designed for a specific purpose.
What Is the Home Sheet and Why Is It Important?
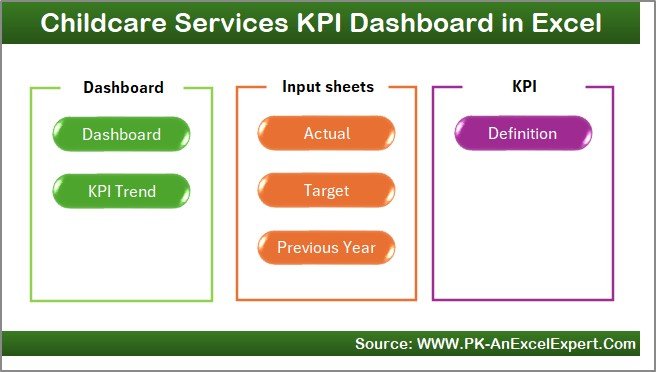
The Home Sheet acts as the index page of the dashboard.
Key Features of the Home Sheet
-
Serves as the navigation hub
-
Includes six buttons to jump to respective sheets
-
Improves usability and user experience
Because of this design, users can navigate the dashboard smoothly without confusion.
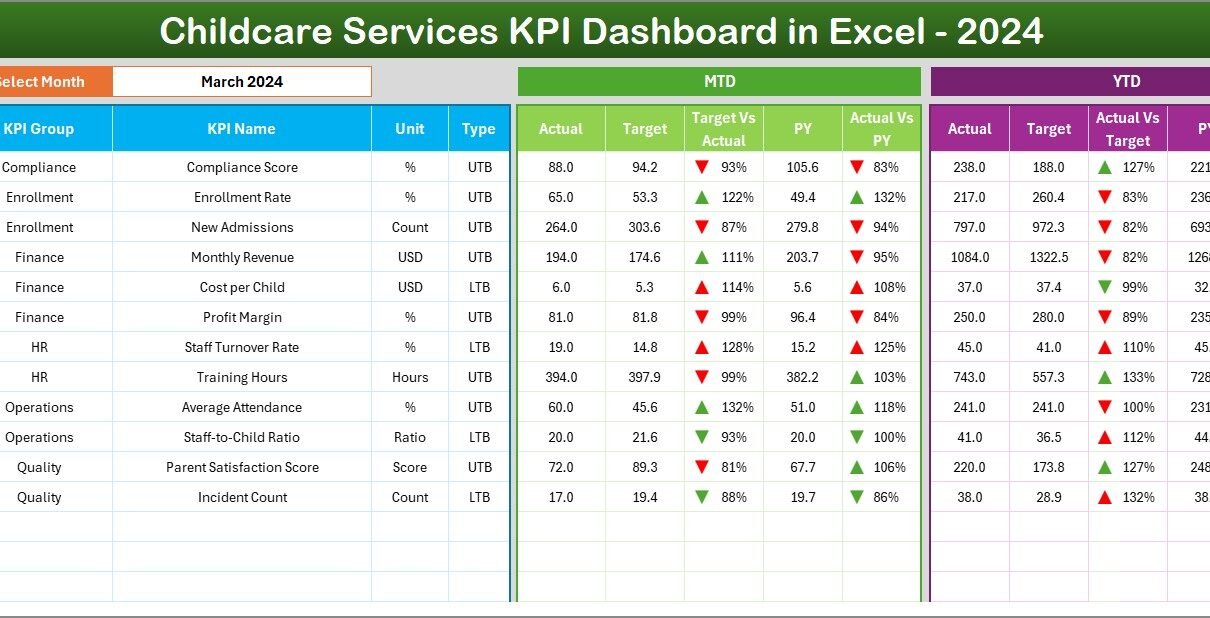
What Is the Dashboard Sheet and What Does It Show?
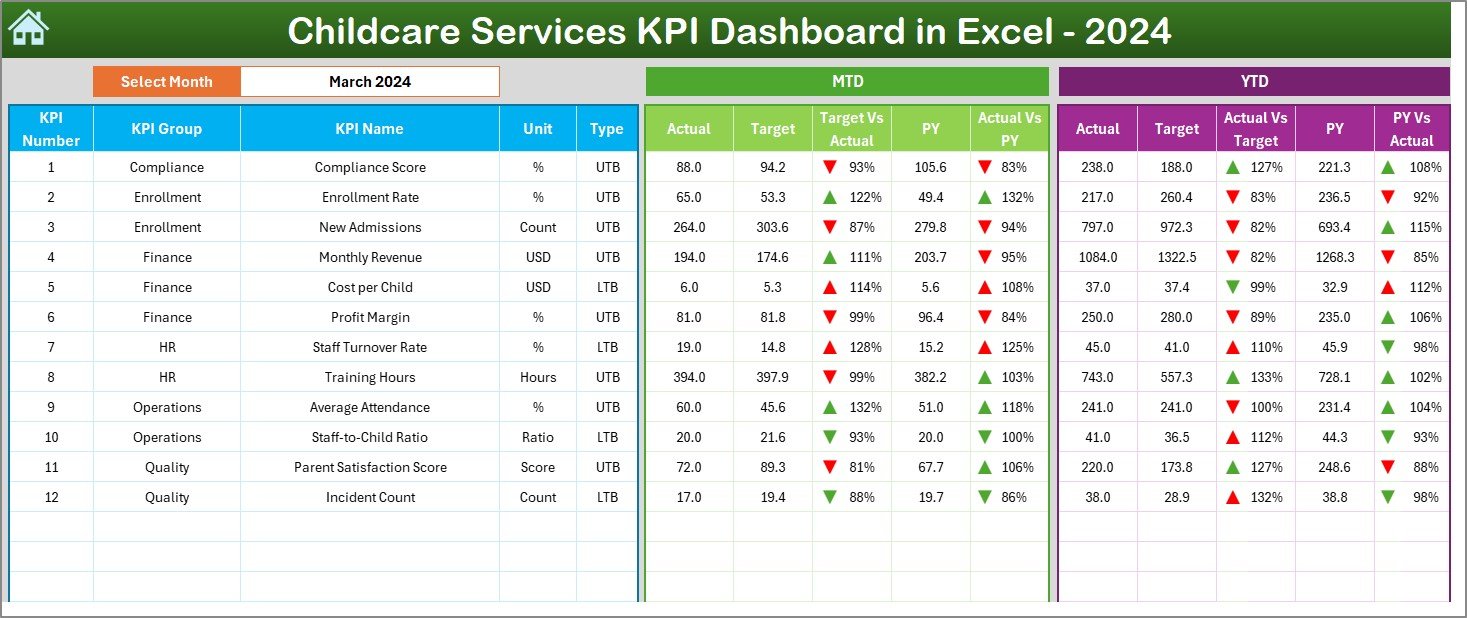
The Dashboard Sheet is the main analysis page of the workbook.
Key Highlights of the Dashboard Sheet
-
Month selection drop-down on cell D3
-
Automatic update of all KPIs based on selected month
-
Clear separation of MTD and YTD performance
As a result, this sheet gives a complete snapshot of childcare operations.
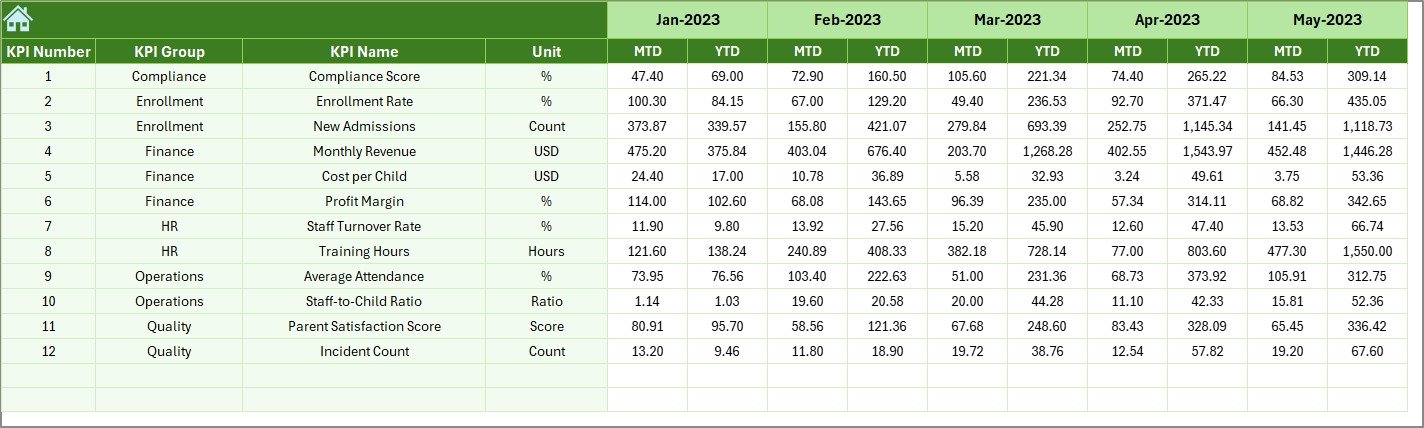
What MTD Metrics Are Displayed on the Dashboard?
For Month-to-Date analysis, the dashboard shows:
-
MTD Actual
-
MTD Target
-
MTD Previous Year
-
Target vs Actual (MTD)
-
Previous Year vs Actual (MTD)
Conditional formatting with up and down arrows highlights performance trends clearly.
How Does the Dashboard Handle YTD Performance?
For Year-to-Date analysis, the dashboard displays:
-
YTD Actual
-
YTD Target
-
YTD Previous Year
-
Target vs Actual (YTD)
-
Previous Year vs Actual (YTD)
Therefore, managers can track long-term performance alongside short-term results.
Click to Purchases Childcare Services KPI Dashboard in Excel
What Is the KPI Trend Sheet and Why Is It Useful?
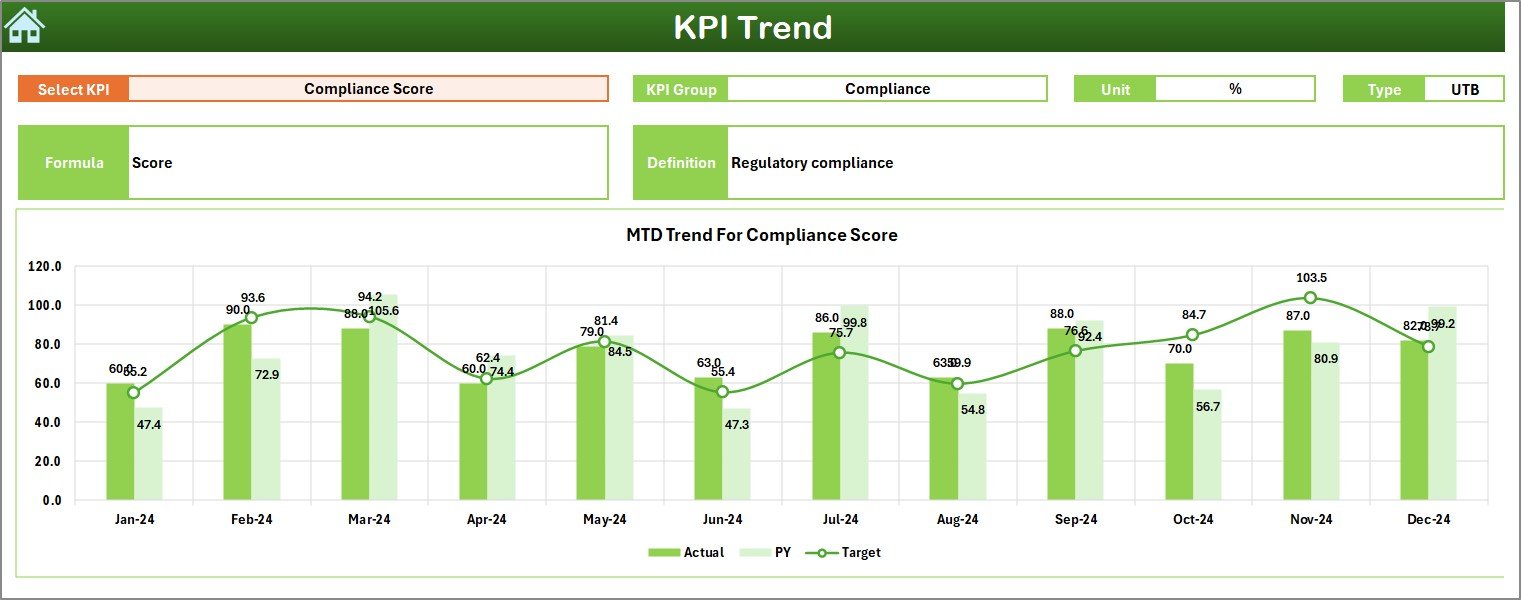
The KPI Trend Sheet focuses on detailed analysis of individual KPIs.
Key Features of the KPI Trend Sheet
-
KPI selection drop-down on cell C3
-
Displays:
-
KPI Group
-
KPI Unit
-
KPI Type (LTB or UTB)
-
KPI Formula
-
KPI Definition
-
Additionally, it includes:
-
MTD Trend Chart
-
YTD Trend Chart
-
Actual, Target, and Previous Year comparisons
As a result, users can analyze performance patterns deeply.
Why Are Trend Charts Important for Childcare Services?
Trend charts help childcare managers:
-
Identify enrollment growth or decline
-
Track staff productivity patterns
-
Monitor compliance and safety trends
-
Plan staffing and capacity effectively
Therefore, trend analysis supports proactive decision-making.
What Is the Actual Numbers Input Sheet?
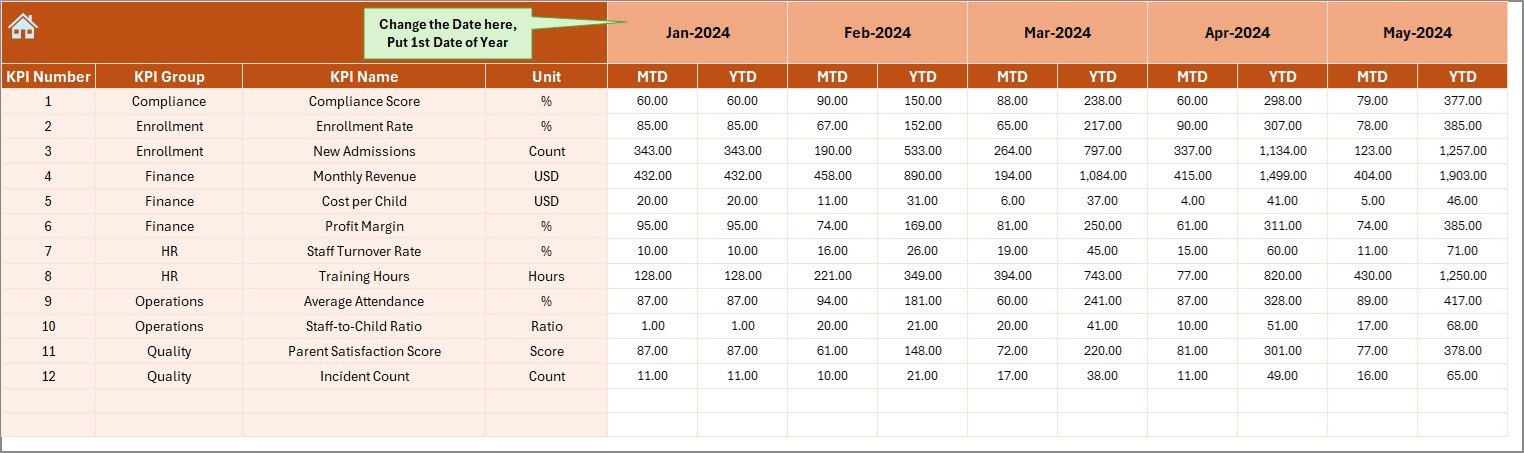
The Actual Numbers Input Sheet is where real performance data is entered.
How to Use This Sheet
-
Enter actual MTD and YTD values
-
Select the reporting month from cell E1
-
Always use the first month of the year in cell E1
This sheet forms the foundation of all calculations.
What Is the Target Sheet and How Is It Used?
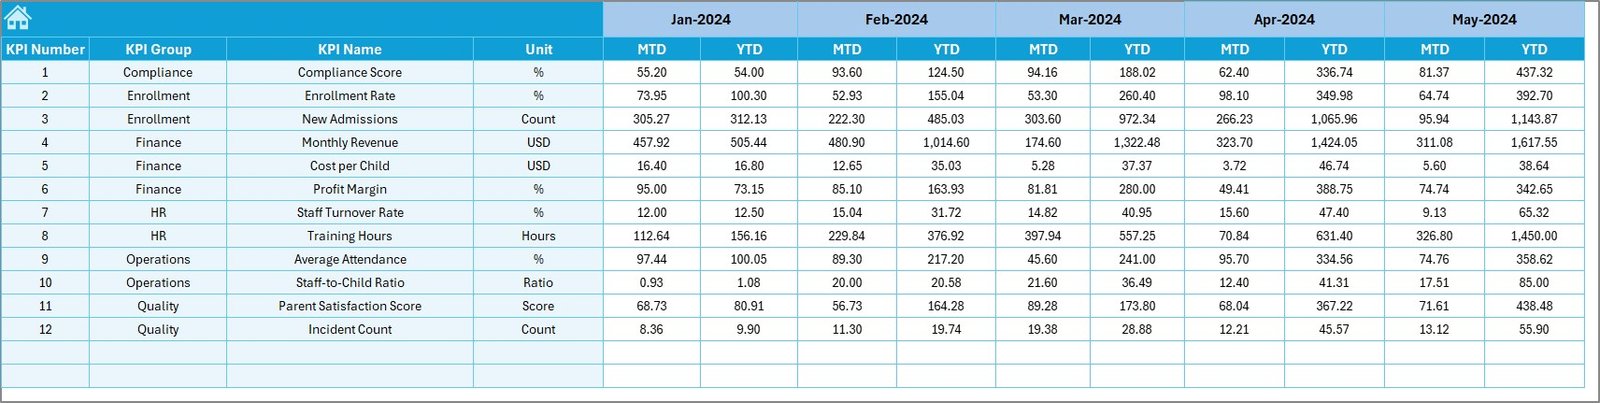
The Target Sheet stores planned performance values.
Key Details of the Target Sheet
-
Enter monthly MTD targets
-
Enter cumulative YTD targets
-
Targets align with business goals
Because of this structure, performance gaps become visible instantly.
What Is the Previous Year Number Sheet?
The Previous Year Number Sheet stores historical data.
Purpose of This Sheet
-
Enter last year’s MTD and YTD values
-
Enable year-over-year comparison
-
Identify growth and improvement trends
Therefore, this sheet adds valuable historical context.
What Is the KPI Definition Sheet?
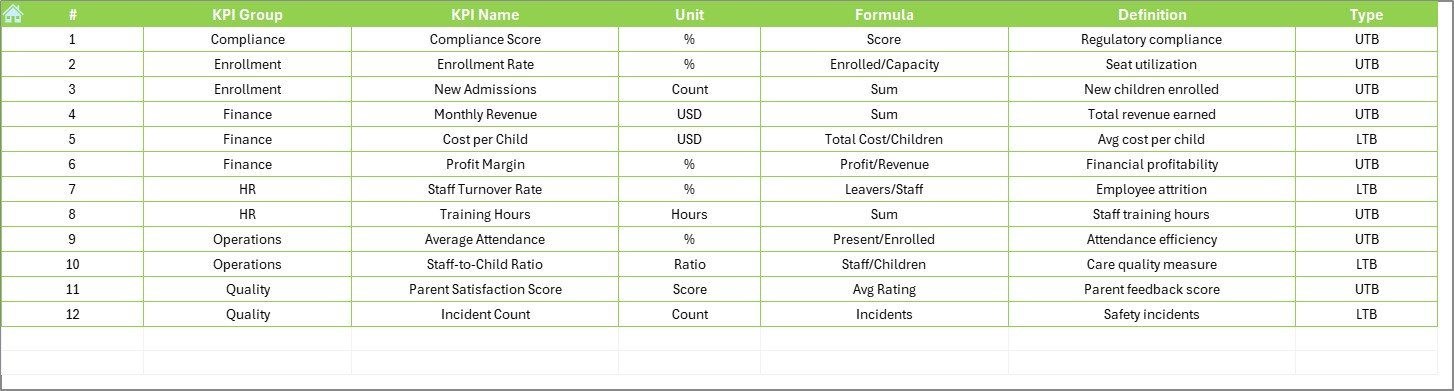
The KPI Definition Sheet ensures clarity and standardization.
Information Stored in This Sheet
-
KPI Name
-
KPI Group
-
Unit of Measurement
-
Formula
-
KPI Definition
As a result, everyone understands what each KPI means and how it is calculated.
Click to Purchases Childcare Services KPI Dashboard in Excel
Advantages of Childcare Services KPI Dashboard in Excel
Using a Childcare Services KPI Dashboard in Excel offers multiple benefits.
✅ Centralized Performance Monitoring
All childcare KPIs are available in one structured dashboard.
✅ Easy to Use
Since it runs in Excel, no advanced technical skills are required.
✅ Time-Saving Reporting
Automation eliminates manual calculations and repetitive work.
✅ Clear Performance Visibility
MTD, YTD, and YoY comparisons simplify decision-making.
✅ Better Planning
Trend analysis supports staffing, budgeting, and capacity planning.
✅ Improved Accountability
Clear targets encourage performance ownership across teams.
Who Can Benefit from This Dashboard?
This dashboard suits:
-
Childcare center owners
-
Daycare managers
-
Preschool administrators
-
Operations managers
-
Finance and admin teams
-
Education consultants
Therefore, it works for both small daycare centers and large childcare networks.
Click to Purchases Childcare Services KPI Dashboard in Excel
Best Practices for the Childcare Services KPI Dashboard in Excel
To maximize value, follow these best practices.
📌 Define KPIs Clearly
Ensure every KPI has a clear formula and definition.
📌 Update Data Regularly
Update actual and target data monthly without delay.
📌 Maintain Data Accuracy
Double-check inputs to avoid misleading insights.
📌 Use Targets Wisely
Set realistic and achievable targets aligned with goals.
📌 Review Trends Monthly
Use trend charts to detect issues early.
📌 Train Users
Ensure staff understand how to read and use the dashboard.
How Does This Dashboard Improve Childcare Management?
This dashboard shifts childcare management from reactive to proactive. Instead of responding to issues late, managers detect problems early and take corrective action.
As a result:
-
Service quality improves
-
Parent satisfaction increases
-
Operational efficiency grows
-
Financial performance stabilizes
Common Problems Solved by This Dashboard
Many childcare services struggle with:
-
Disconnected reports
-
Manual Excel work
-
Lack of trend visibility
-
Poor KPI tracking
This dashboard solves these challenges through structure, automation, and clarity.
Why Choose Excel for a Childcare KPI Dashboard?
Excel remains a popular choice because it:
-
Is widely available
-
Requires no additional software
-
Supports automation and charts
-
Allows easy customization
Therefore, Excel-based dashboards remain cost-effective and flexible.
Click to Purchases Childcare Services KPI Dashboard in Excel
Conclusion: Why Every Childcare Service Needs a KPI Dashboard
A Childcare Services KPI Dashboard in Excel is more than a reporting tool. It is a management system that brings clarity, control, and confidence to childcare operations.
With structured worksheets, automated calculations, trend analysis, and clear visuals, this dashboard helps childcare centers make smarter decisions every month. Therefore, it becomes an essential asset for sustainable growth and service excellence.
Frequently Asked Questions (FAQs)
❓ What is a Childcare Services KPI Dashboard in Excel?
It is an Excel-based dashboard that tracks childcare KPIs using MTD, YTD, and year-over-year metrics.
❓ Do I need advanced Excel skills to use it?
No. Basic Excel knowledge is enough to update and use the dashboard.
❓ Can I customize KPIs in this dashboard?
Yes. You can add or modify KPIs using the KPI Definition sheet.
❓ How often should I update the dashboard?
You should update it monthly for accurate reporting.
❓ Is this dashboard suitable for small daycare centers?
Yes. It works well for both small and large childcare services.
❓ Can this dashboard help with decision-making?
Yes. It provides clear insights that support planning and performance improvement.
Click to Purchases Childcare Services KPI Dashboard in Excel
Visit our YouTube channel to learn step-by-step video tutorials