In today’s fast-moving global financial environment, forex service providers must track performance accurately and act quickly. However, many forex companies still rely on scattered Excel sheets, manual reports, and delayed summaries. As a result, decision-making slows down and risks increase.
That is exactly why a Forex Services KPI Dashboard in Power BI becomes a powerful and reliable solution. It helps forex brokers, currency exchange firms, trading desks, and financial service providers track KPIs clearly and consistently.
In this detailed guide, you will learn what a Forex Services KPI Dashboard in Power BI is, why it matters, how it works, its structure, advantages, best practices, and frequently asked questions. Moreover, the language remains simple, practical, and business-friendly so you can apply it easily.
What Is a Forex Services KPI Dashboard in Power BI?
A Forex Services KPI Dashboard in Power BI is a ready-to-use analytics and reporting solution that tracks key performance indicators related to forex operations. Instead of checking multiple spreadsheets, managers can view MTD, YTD, target, and previous-year comparisons from one centralized dashboard.
Moreover, the dashboard connects directly to an Excel data source. Therefore, you only update Excel and refresh Power BI. As a result, reporting stays fast, accurate, and consistent.
Additionally, because the dashboard runs on Power BI, it supports interactive filters, slicers, drill-through pages, and visual indicators. Consequently, teams can analyze performance without technical complexity.
Why Do Forex Services Need a KPI Dashboard?
Forex services operate in a high-volume, high-risk, and data-intensive environment. Therefore, performance visibility plays a crucial role in success. However, traditional reporting methods often fail to deliver timely insights.
A Forex Services KPI Dashboard in Power BI solves these challenges by offering:
- Centralized KPI monitoring
- Real-time performance comparison
- Clear target vs actual tracking
- Easy historical analysis
As a result, decision-makers gain confidence and clarity.
What Problems Does a Forex Services KPI Dashboard Solve?
Before using a structured dashboard, many forex firms face common issues. However, Power BI-based KPI dashboards address them effectively.
Common Challenges Without a Dashboard
- Disconnected Excel files
- Manual KPI calculations
- No clear MTD and YTD comparison
- Delayed reporting cycles
- High error risk
How the Dashboard Fixes These Issues
- Centralized Excel-based data model
- Automated calculations
- Visual status indicators
- Consistent KPI definitions
- Faster decision-making
Therefore, the dashboard improves control and transparency.
How Does a Forex Services KPI Dashboard in Power BI Work?
The working logic remains simple and efficient. First, you enter data in Excel. Then, Power BI processes and visualizes it.
Step-by-Step Working Flow
- Enter actual KPI values in Excel
- Enter target KPI values in Excel
- Maintain KPI definitions in one place
- Refresh the Power BI dashboard
- Analyze MTD, YTD, and trends
Because of this structure, even non-technical users can maintain the dashboard easily.
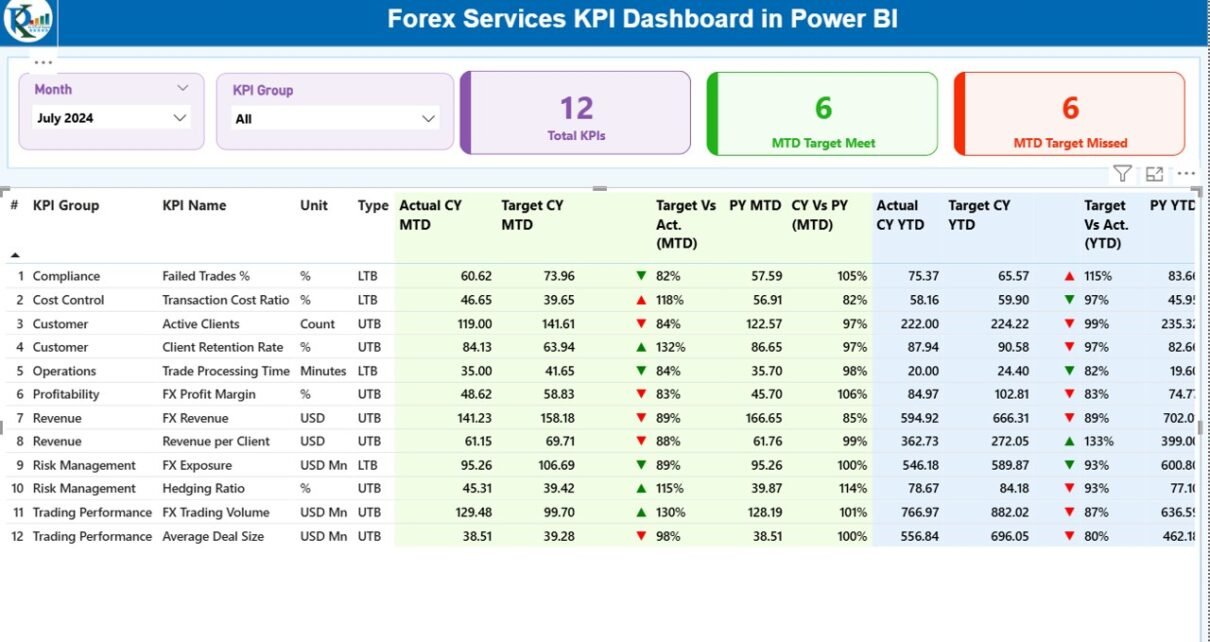
What Are the Key Pages in the Forex Services KPI Dashboard?
The Forex Services KPI Dashboard in Power BI includes three powerful pages, each designed for a specific analytical purpose.
Summary Page
The Summary Page acts as the main control center of the dashboard.
Key Elements of the Summary Page
- Month slicer
- KPI Group slicer
- KPI performance cards
- Detailed KPI performance table
KPI Cards on the Summary Page
- Total KPIs Count
- MTD Target Meet Count
- MTD Target Missed Count
These cards provide a quick health check of forex operations.
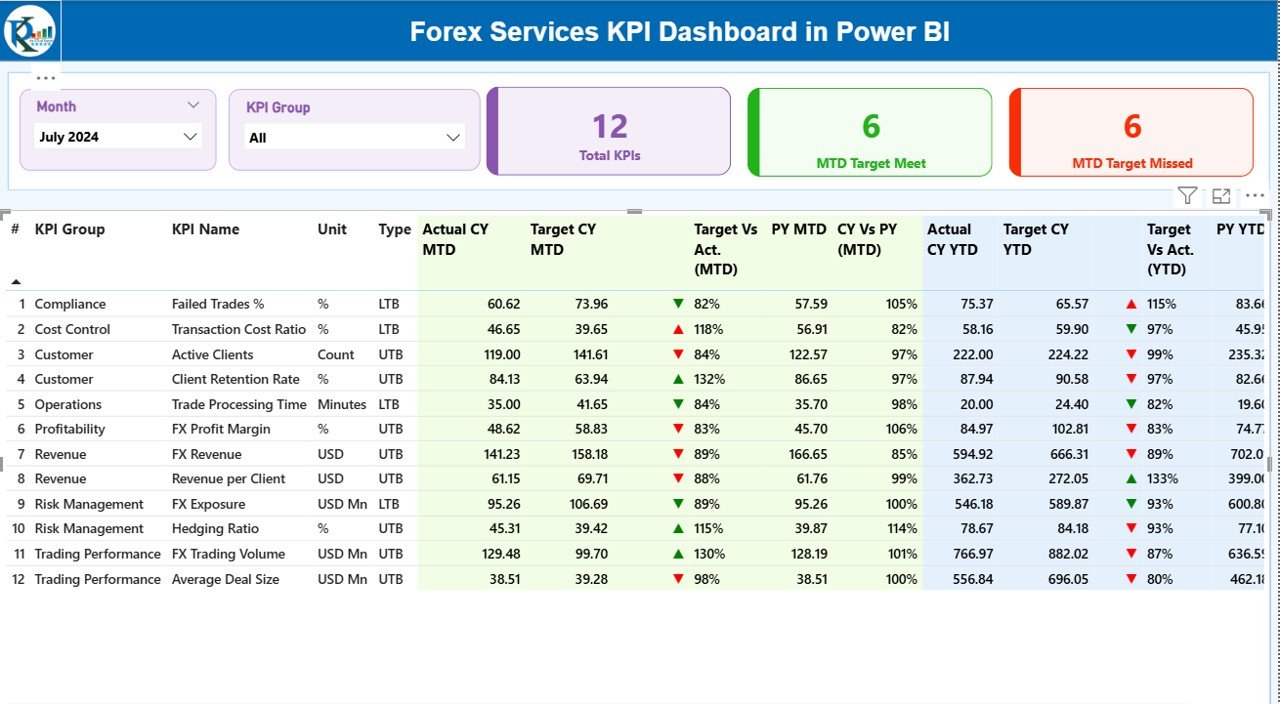
KPI Table Show
The detailed table delivers complete KPI transparency.
KPI Table Columns Explained
- KPI Number – Sequential identifier
- KPI Group – Category of KPI
- KPI Name – Specific performance metric
- Unit – Measurement unit
- Type – UTB or LTB
- Actual CY MTD – Current year actual MTD
- Target CY MTD – Current year target MTD
- MTD Icon – ▲ or ▼ with color indicators
- Target vs Actual (MTD) – Performance ratio
- PY MTD – Previous year MTD
- CY vs PY (MTD) – Growth comparison
- Actual CY YTD – Current year YTD
- Target CY YTD – Target YTD
- YTD Icon – Status indicator
- Target vs Actual (YTD) – YTD performance ratio
- PY YTD – Previous year YTD
- CY vs PY (YTD) – Year-over-year growth
As a result, users get both summary and detail in one place.
What Are UTB and LTB KPIs?
Understanding KPI types improves interpretation.
- UTB (Upper the Better): Higher values indicate better performance
- LTB (Lower the Better): Lower values indicate better performance
Because of this classification, the dashboard automatically displays the correct status icons.
KPI Trend Page
The KPI Trend Page focuses on performance movement over time.
Features of the KPI Trend Page
- KPI Name slicer
- Two combo charts
- MTD trend comparison
- YTD trend comparison
What Do the Combo Charts Show?
- Current Year Actual
- Previous Year Actual
- Target Values
Therefore, users can analyze growth patterns and seasonality easily.

KPI Definition Page
The KPI Definition Page acts as a reference and governance layer.
Key Characteristics
- Hidden drill-through page
- Accessible from Summary Page
- Displays KPI formula and definition
This page ensures KPI clarity and consistency across teams.

How Does Drill-Through Improve Analysis?
Drill-through functionality enhances usability.
- Click on a KPI from Summary
- Navigate to KPI Definition Page
- Review formula and explanation
- Click back button to return
As a result, users understand KPIs without external documents.
What Excel Data Is Required for the Forex Services KPI Dashboard?
The dashboard uses an Excel file with three structured worksheets.
Input_Actual Sheet
This sheet stores actual performance data.
Required Fields
- KPI Name
- Month (first date of month)
- MTD Actual Value
- YTD Actual Value
You only update this sheet regularly.
Input_Target Sheet
This sheet stores target values.
Required Fields
- KPI Name
- Month (first date of month)
- MTD Target Value
- YTD Target Value
Because of this separation, target management stays clean.

KPI Definition Sheet
This sheet defines each KPI clearly.
Required Fields
- KPI Number
- KPI Group
- KPI Name
- Unit
- Formula
- Definition
- Type (UTB or LTB)
Therefore, governance remains strong.
Advantages of Forex Services KPI Dashboard in Power BI
A Forex Services KPI Dashboard in Power BI delivers measurable benefits.
Key Advantages
- Centralized performance view
- Faster reporting cycles
- Clear target tracking
- MTD and YTD comparisons
- Drill-through analysis
- Reduced manual errors
- Improved decision-making
Because of these advantages, forex firms gain operational control.
Who Can Use a Forex Services KPI Dashboard?
This dashboard suits multiple roles.
Ideal Users
- Forex brokers
- Currency exchange firms
- Trading desk managers
- Finance leaders
- Operations teams
- Risk management teams
Therefore, the dashboard supports both strategic and operational needs.
How Does This Dashboard Improve Decision-Making?
Data-driven decisions depend on clarity and speed.
Decision-Making Benefits
- Identify underperforming KPIs quickly
- Track growth trends clearly
- Compare performance across time
- Align teams with targets
As a result, leadership acts with confidence.
Best Practices for the Forex Services KPI Dashboard in Power BI
Following best practices ensures long-term success.
Best Practices
- Maintain consistent KPI definitions
- Update Excel data monthly
- Use first date of month consistently
- Review UTB and LTB logic regularly
- Validate targets quarterly
- Limit KPI count to actionable metrics
- Train users on drill-through features
Because of these practices, the dashboard stays reliable.
How Often Should You Update the Dashboard?
Update frequency depends on business needs.
- Monthly updates for strategic review
- Weekly updates for operational tracking
- Quarterly reviews for KPI relevance
However, consistency matters more than frequency.
How Secure Is the Forex Services KPI Dashboard?
Security depends on deployment.
- Secure Excel file access
- Role-based Power BI sharing
- Controlled refresh permissions
Therefore, data confidentiality stays protected.
How Can You Customize the Dashboard?
Power BI allows easy customization.
Customization Options
- Add new KPIs
- Modify KPI groups
- Change visuals
- Add more slicers
- Extend trend analysis
As a result, the dashboard grows with the business.
Conclusion: Why a Forex Services KPI Dashboard in Power BI Matters
A Forex Services KPI Dashboard in Power BI transforms raw forex data into meaningful insights. Instead of struggling with manual reports, teams gain clarity, speed, and accuracy.
Moreover, the dashboard supports MTD, YTD, target, and previous-year analysis from one centralized platform. Therefore, forex firms improve control, reduce risk, and enhance performance.
In a competitive forex environment, such visibility becomes not just helpful but essential.
Frequently Asked Questions (FAQs)
What is a Forex Services KPI Dashboard in Power BI?
It is a centralized analytics tool that tracks forex KPIs using Excel data and Power BI visuals.
Do I need coding skills to use this dashboard?
No, you only update Excel and refresh Power BI.
Can I add more KPIs later?
Yes, the dashboard supports easy KPI expansion.
Does the dashboard support MTD and YTD analysis?
Yes, it includes both MTD and YTD comparisons.
Can I compare performance with the previous year?
Yes, the dashboard shows CY vs PY comparisons.
Is this dashboard suitable for small forex firms?
Yes, it works for both small and large organizations.
How often should I refresh the dashboard?
You should refresh it whenever Excel data changes.
Does the dashboard support drill-through analysis?
Yes, it includes a KPI Definition drill-through page.
Visit our YouTube channel to learn step-by-step video tutorials
Watch the step-by-step video tutorial: