Managing a retail supply chain without real-time visibility always creates delays, excess costs, and customer dissatisfaction. Retail businesses deal with procurement, inventory, logistics, warehousing, and store replenishment every single day. Therefore, relying on static reports or scattered Excel files limits decision-making and increases operational risk.
That is exactly why a Retail Supply Chain KPI Dashboard in Power BI becomes an essential analytics solution.
In this detailed article, you will learn what a Retail Supply Chain KPI Dashboard in Power BI is, why retail businesses need it, how it works, its page-wise structure, key features, advantages, best practices, and frequently asked questions. Moreover, this guide uses clear language, practical explanations, and real business logic so you can apply it immediately.
Click to Purchases Retail Supply Chain KPI Dashboard in Power BI
What Is a Retail Supply Chain KPI Dashboard in Power BI?
A Retail Supply Chain KPI Dashboard in Power BI is an interactive analytics solution that tracks and visualizes key supply chain performance metrics using Power BI. Instead of reviewing multiple spreadsheets or manual reports, supply chain teams monitor all KPIs from one centralized dashboard.
Because the dashboard runs on Power BI, it provides dynamic slicers, automated calculations, visual indicators, and drill-through analysis. As a result, decision-makers gain faster insights, improved accuracy, and better control over retail operations.
Additionally, this dashboard uses an Excel file as the data source, which makes data entry simple while allowing Power BI to handle visualization and analytics.
Why Do Retail Businesses Need a Supply Chain KPI Dashboard?
Retail supply chains involve many interconnected processes. However, without structured KPI monitoring, small issues quickly turn into major problems.
Retail businesses need this dashboard because:
-
Inventory levels change frequently
-
Supplier delays affect store availability
-
Logistics costs fluctuate every month
-
Stockouts reduce customer satisfaction
-
Excess inventory blocks working capital
Therefore, a Retail Supply Chain KPI Dashboard in Power BI helps retail teams track performance continuously and act before problems escalate.
Key Objectives of a Retail Supply Chain KPI Dashboard in Power BI
This dashboard supports multiple strategic and operational goals:
-
Centralize supply chain KPIs in one platform
-
Track MTD and YTD performance accurately
-
Compare Actual vs Target values instantly
-
Measure performance against previous year data
-
Identify underperforming KPIs quickly
-
Support data-driven decisions at every level
Key Features of the Retail Supply Chain KPI Dashboard in Power BI
This ready-to-use Retail Supply Chain KPI Dashboard includes a well-structured design, powerful visuals, and flexible analysis options.
Click to Purchases Retail Supply Chain KPI Dashboard in Power BI
Page Structure of the Retail Supply Chain KPI Dashboard in Power BI
The Power BI dashboard contains 3 main pages, each designed for a specific purpose.
1) Summary Page – Complete KPI Overview
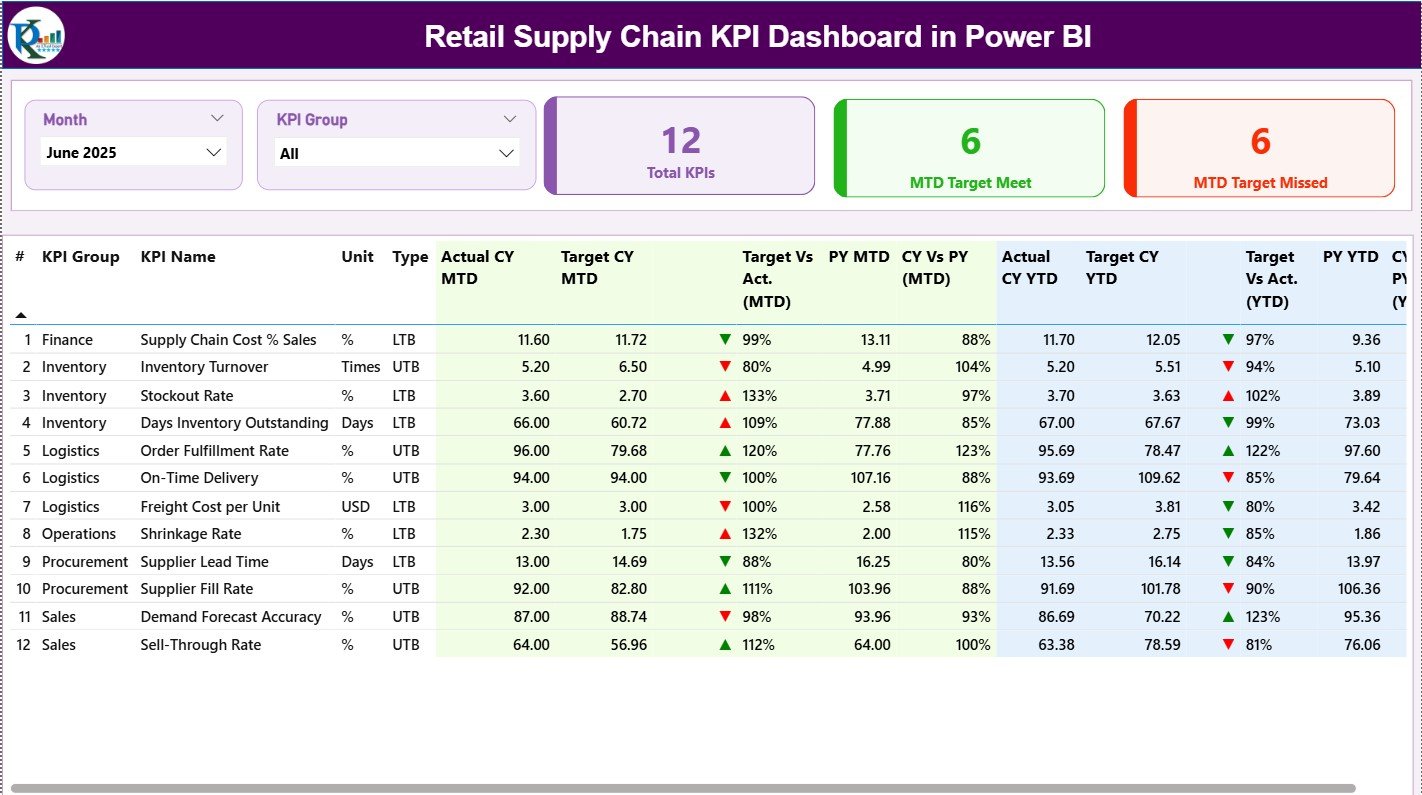
The Summary Page acts as the main landing page of the dashboard.
Key Slicers on the Summary Page:
-
Month slicer for time-based analysis
-
KPI Group slicer to filter KPI categories
These slicers allow users to analyze performance by month and KPI group effortlessly.
KPI Cards on the Summary Page
At the top of the page, the dashboard displays three KPI cards:
-
Total KPIs Count
-
MTD Target Meet Count
-
MTD Target Missed Count
As a result, management immediately understands overall supply chain performance.
Detailed KPI Table on the Summary Page
Below the cards, the dashboard displays a detailed KPI performance table.
Columns Included in the Table:
-
KPI Number
Sequence number of each KPI. -
KPI Group
Category or functional area of the KPI. -
KPI Name
Name of the supply chain KPI. -
Unit
Unit of measurement (%, Days, Units, Cost, etc.). -
Type
KPI type:-
LTB (Lower the Better)
-
UTB (Upper the Better)
-
-
Actual CY MTD
Current Year actual MTD value. -
Target CY MTD
Current Year target MTD value. -
MTD Icon
Red ▼ or Green ▲ icon showing MTD performance vs target. -
Target vs Actual (MTD)
Percentage calculated using:
Actual MTD / Target MTD -
PY MTD
Previous Year MTD value. -
CY vs PY (MTD)
Percentage comparison using:
CY MTD / PY MTD -
Actual CY YTD
Current Year actual YTD value. -
Target CY YTD
Current Year target YTD value. -
YTD Icon
Red ▼ or Green ▲ icon indicating YTD performance vs target. -
Target vs Actual (YTD)
Percentage calculated using:
Actual YTD / Target YTD -
PY YTD
Previous Year YTD value. -
CY vs PY (YTD)
Percentage comparison using:
CY YTD / PY YTD
This structured table provides complete KPI visibility in a single view.
2) KPI Trend Page – Performance Trend Analysis
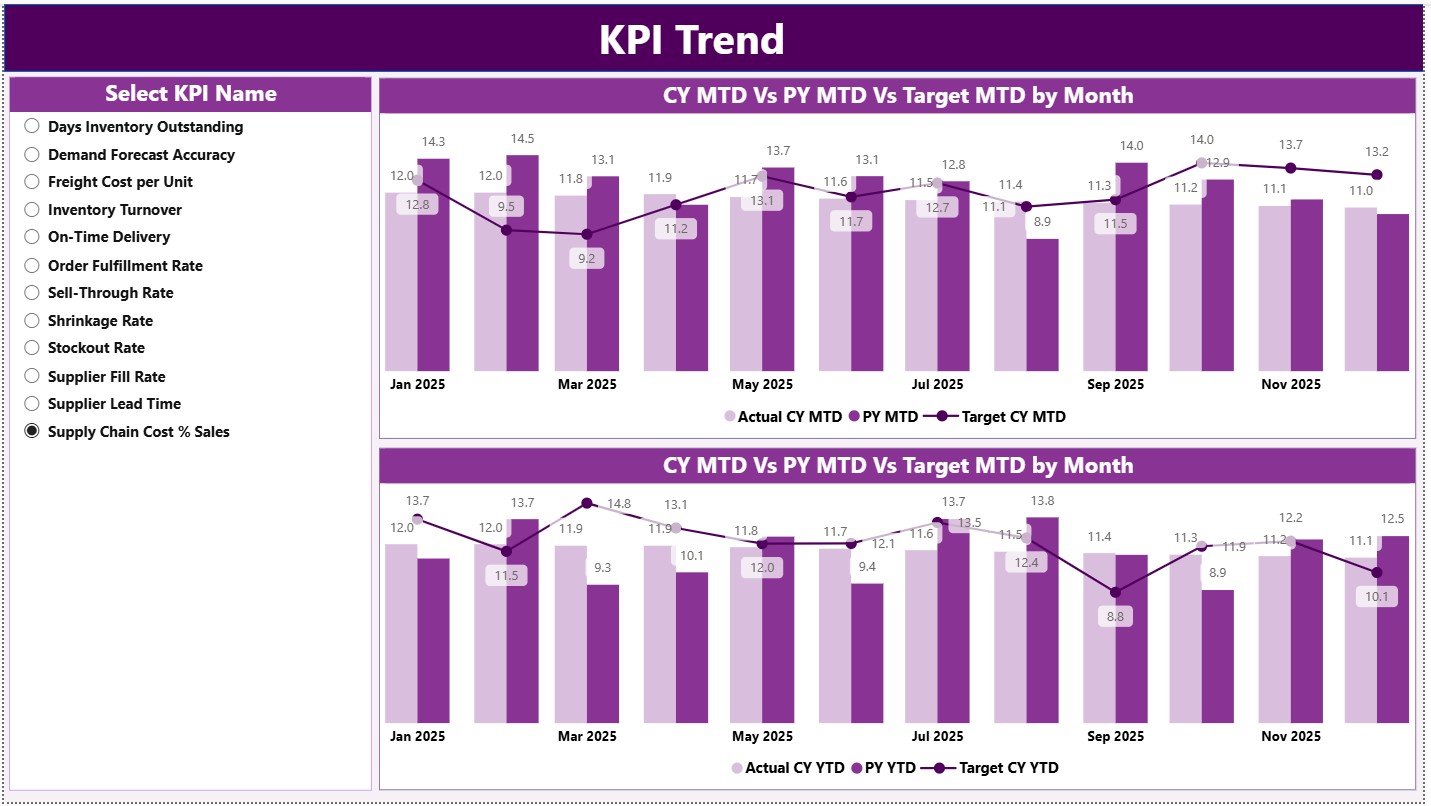
The KPI Trend Page focuses on trend-based analysis.
Key Features of the KPI Trend Page:
-
KPI Name slicer on the left
-
Two combo charts for deep analysis
Charts on the KPI Trend Page
MTD Trend Combo Chart
This chart shows:
-
Actual CY MTD
-
Target CY MTD
-
Previous Year MTD
It helps users analyze month-to-month performance changes.
YTD Trend Combo Chart
This chart shows:
-
Actual CY YTD
-
Target CY YTD
-
Previous Year YTD
As a result, users understand long-term performance trends clearly.
Click to Purchases Retail Supply Chain KPI Dashboard in Power BI
3) KPI Definition Page – Drill-Through Reference Page
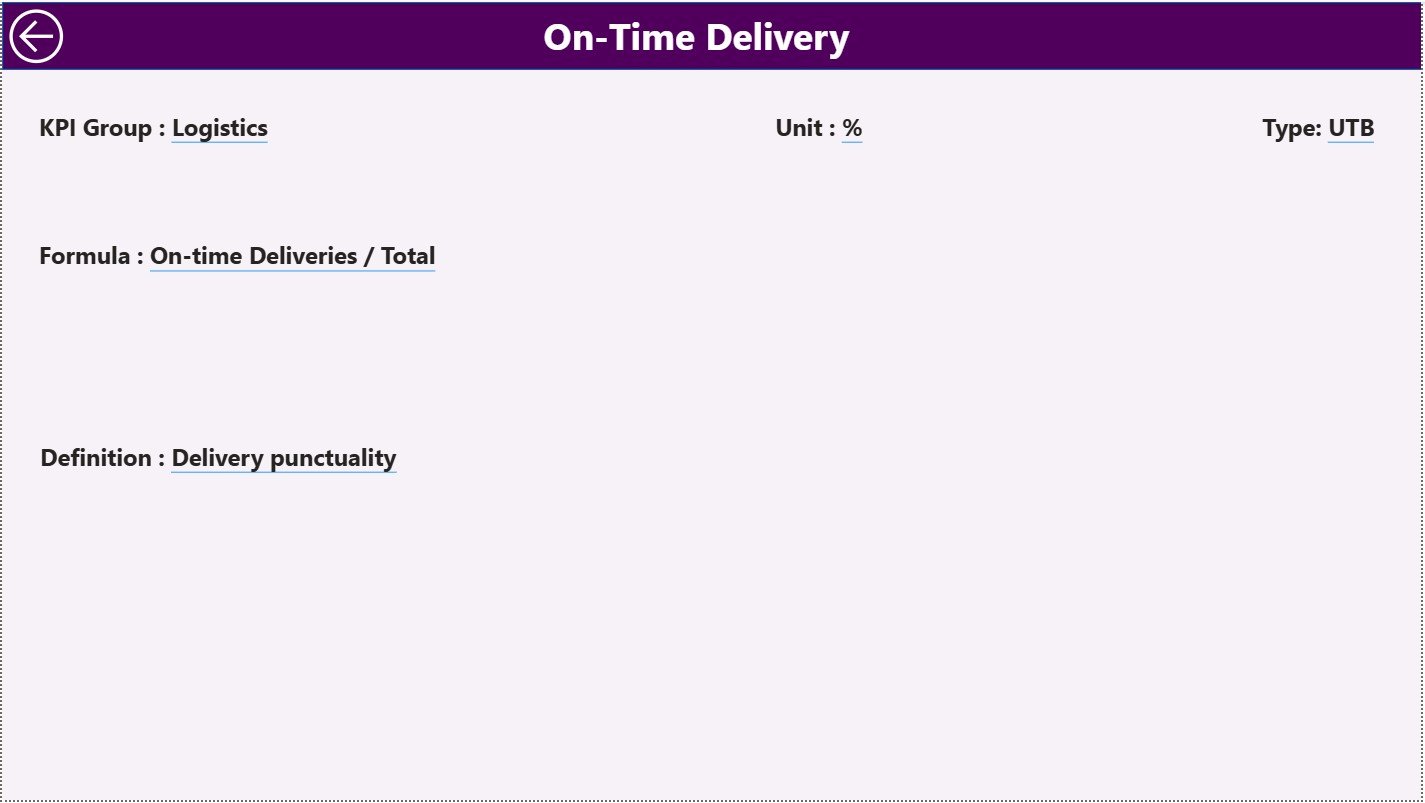
The KPI Definition Page acts as a drill-through page and remains hidden by default.
What This Page Displays:
-
KPI Formula
-
KPI Definition
-
KPI Logic Explanation
Users can drill through from the Summary Page to this page to understand KPI calculations and meaning.
To return to the main page, users simply click the Back button on the top left corner.
Excel Data Source Structure for the Dashboard
This dashboard uses Excel as the data source, which keeps data entry simple and flexible.
1) Input_Actual Sheet
This sheet stores actual performance data.
Fields to Fill:
-
KPI Name
-
Month (use the first date of the month)
-
MTD Actual value
-
YTD Actual value
2) Input_Target Sheet
This sheet stores target values.
Fields to Fill:
-
KPI Name
-
Month (use the first date of the month)
-
MTD Target value
-
YTD Target value
3) KPI Definition Sheet
This sheet documents all KPIs.
Fields Included:
-
KPI Number
-
KPI Group
-
KPI Name
-
Unit
-
Formula
-
Definition
-
Type (LTB or UTB)
What KPIs Can Be Tracked in a Retail Supply Chain Dashboard?
Click to Purchases Retail Supply Chain KPI Dashboard in Power BI
A Retail Supply Chain KPI Dashboard typically includes KPIs from multiple areas.
Inventory KPIs
-
Inventory Turnover
-
Stockout Rate
-
Days of Inventory on Hand
Procurement KPIs
-
Supplier On-Time Delivery %
-
Purchase Order Cycle Time
-
Supplier Defect Rate
Logistics KPIs
-
Transportation Cost per Unit
-
On-Time Delivery Rate
-
Order Fulfillment Cycle Time
Warehouse KPIs
-
Order Picking Accuracy
-
Warehouse Utilization
-
Average Handling Time
Advantages of Retail Supply Chain KPI Dashboard in Power BI
1. Centralized KPI Visibility
All supply chain KPIs appear in one interactive dashboard.
2. Faster Decision-Making
Real-time visuals help managers act quickly.
3. Clear Performance Comparison
MTD, YTD, Target, and PY comparisons improve accountability.
4. Improved Inventory Control
Trend analysis helps reduce stockouts and excess inventory.
5. Interactive Analysis
Slicers and drill-through improve user experience.
6. Scalable and Flexible
You can easily add KPIs, pages, or filters as business grows.
Click to Purchases Retail Supply Chain KPI Dashboard in Power BI
Best Practices for Retail Supply Chain KPI Dashboard in Power BI
Use Well-Defined KPIs
Ensure every KPI has a clear formula and purpose.
Keep Data Updated
Refresh Excel data regularly for accurate insights.
Review Trends Monthly
Focus on both MTD and YTD trends.
Align Targets with Business Goals
Set realistic and measurable targets.
Train Dashboard Users
Ensure stakeholders understand how to interpret KPIs.
Maintain Clean Data
Consistent data structure improves Power BI performance.
Who Can Use This Dashboard?
This dashboard works perfectly for:
-
Retail supply chain managers
-
Inventory planners
-
Procurement teams
-
Logistics managers
-
Operations heads
-
Business analysts
-
Retail leadership teams
How Does This Dashboard Improve Retail Supply Chain Performance?
The dashboard improves performance by:
-
Reducing manual reporting effort
-
Improving forecast accuracy
-
Highlighting underperforming KPIs early
-
Supporting strategic planning
-
Increasing operational transparency
Conclusion
A Retail Supply Chain KPI Dashboard in Power BI provides complete visibility into supply chain performance using interactive visuals and structured KPIs. Instead of relying on static reports, retail teams gain real-time insights that support faster and smarter decisions.
With features like MTD and YTD tracking, target comparison, KPI icons, trend analysis, and drill-through definitions, this dashboard becomes an essential tool for modern retail operations.
Click to Purchases Retail Supply Chain KPI Dashboard in Power BI
Frequently Asked Questions (FAQs)
What is a Retail Supply Chain KPI Dashboard in Power BI?
It is an interactive Power BI dashboard that tracks retail supply chain KPIs using MTD, YTD, target, and previous year data.
Can I use Excel as the data source?
Yes, this dashboard uses Excel files for data input.
Is this dashboard suitable for small retailers?
Yes, it works for small, medium, and large retail businesses.
Do I need Power BI expertise to use it?
No, basic Power BI navigation knowledge is sufficient.
Can I add more KPIs?
Yes, the dashboard design supports easy scalability.
Click to Purchases Retail Supply Chain KPI Dashboard in Power BI
Visit our YouTube channel to learn step-by-step video tutorials