In today’s fast-moving digital education ecosystem, data drives every strategic decision. EdTech companies, online course creators, training institutes, and learning platforms generate massive amounts of data every day. However, raw data alone does not create value. You must convert it into meaningful insights.
That is exactly where an EdTech Dashboard in Excel becomes a game-changer.
In this detailed and practical article, you will learn what an EdTech Dashboard in Excel is, why it matters, how it works, its complete sheet-wise structure, advantages, best practices, and frequently asked questions. Moreover, this guide uses simple language, real-world logic, and actionable explanations so you can apply everything immediately.
Click to buy EdTech Dashboard in Excel
What Is an EdTech Dashboard in Excel?
An EdTech Dashboard in Excel is a ready-to-use, interactive reporting and analytics tool designed to monitor educational business performance in one centralized file.
Instead of tracking revenue, enrollments, completion rates, and student engagement across multiple systems, this Excel-based dashboard consolidates all critical metrics into visual charts, KPI cards, and trend analysis views.
As a result, decision-makers gain instant visibility into learning performance, operational efficiency, and business growth.
Why Do EdTech Businesses Need a Dashboard in Excel?
EdTech organizations face unique challenges. They must balance learner success with revenue growth while maintaining operational efficiency. However, scattered data often creates confusion instead of clarity.
An EdTech Dashboard in Excel solves this problem effectively.
Here is why it matters:
- First, it centralizes all learning and business KPIs in one place
- Second, it improves decision-making with real-time insights
- Third, it helps identify drop-offs, engagement gaps, and revenue trends
- Moreover, it eliminates manual reporting efforts
- Finally, it enables quick performance comparisons across courses, segments, and time periods
Because Excel remains flexible, affordable, and widely adopted, it becomes an ideal analytics platform for EdTech teams.
Key Objectives of an EdTech Dashboard in Excel
Before exploring the structure, it is important to understand the core objectives of this dashboard.
An EdTech Dashboard in Excel helps you:
- Track total revenue and revenue growth
- Monitor enrollments, completions, and dropouts
- Measure learning progress and difficulty-wise performance
- Analyze course-wise and instructor-wise results
- Evaluate student engagement and satisfaction
- Identify trends and improvement opportunities
As a result, leaders move from guesswork to data-driven strategies.
Sheet-Wise Structure of the EdTech Dashboard in Excel
This ready-to-use EdTech Dashboard in Excel consists of multiple structured worksheet tabs. Each sheet focuses on a specific business or learning dimension.
Let us explore each sheet in detail.
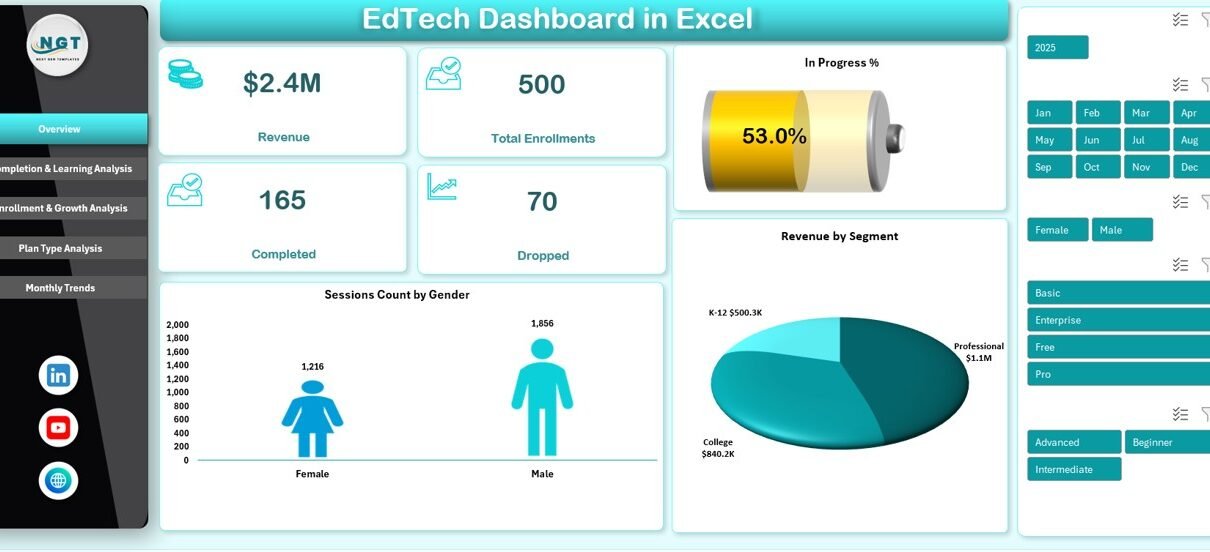
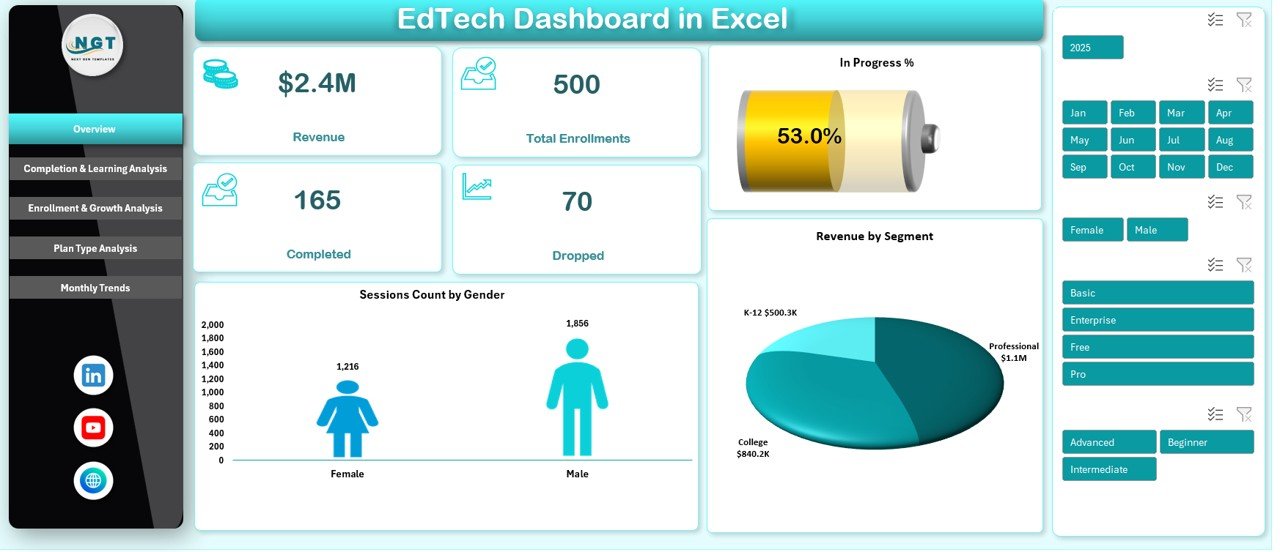
Overview Sheet Tab: How Do You Get a Quick Business Snapshot?
The Overview Sheet acts as the control center of the EdTech Dashboard in Excel. It provides a high-level summary of key metrics so stakeholders can understand performance at a glance.
Key KPIs on the Overview Sheet
- Revenue
Displays total revenue generated from all courses and plans. - Total Enrollments
Shows the number of learners enrolled across platforms. - Completed
Highlights the count of students who completed their courses. - Dropped
Tracks learners who discontinued before completion. - In Progress %
Indicates the percentage of learners currently active.
Key Visual Analysis on the Overview Sheet
- Sessions Count by Gender
Helps analyze participation diversity and engagement patterns. - Revenue by Segment
Shows which learner segments contribute the most revenue. - In Progress % by Difficulty
Identifies where learners struggle or progress smoothly.
Because this sheet offers instant insights, leaders can quickly identify strengths and weaknesses.
Click to buy EdTech Dashboard in Excel
Completion & Learning Analysis: How Do Students Perform Academically?
The Completion & Learning Analysis sheet focuses on learning effectiveness and student outcomes.
Key Insights Covered in This Sheet
- In Progress % by Difficulty
Reveals whether beginner, intermediate, or advanced courses face engagement issues. - Student Count by Course Name
Shows enrollment popularity for each course. - Revenue by Course Name
Highlights top-earning and underperforming courses. - Avg. Final Score % by Course Category
Measures learning quality across subject areas.
Because learning success defines EdTech credibility, this sheet plays a crucial role in improving content quality.

Click to buy EdTech Dashboard in Excel
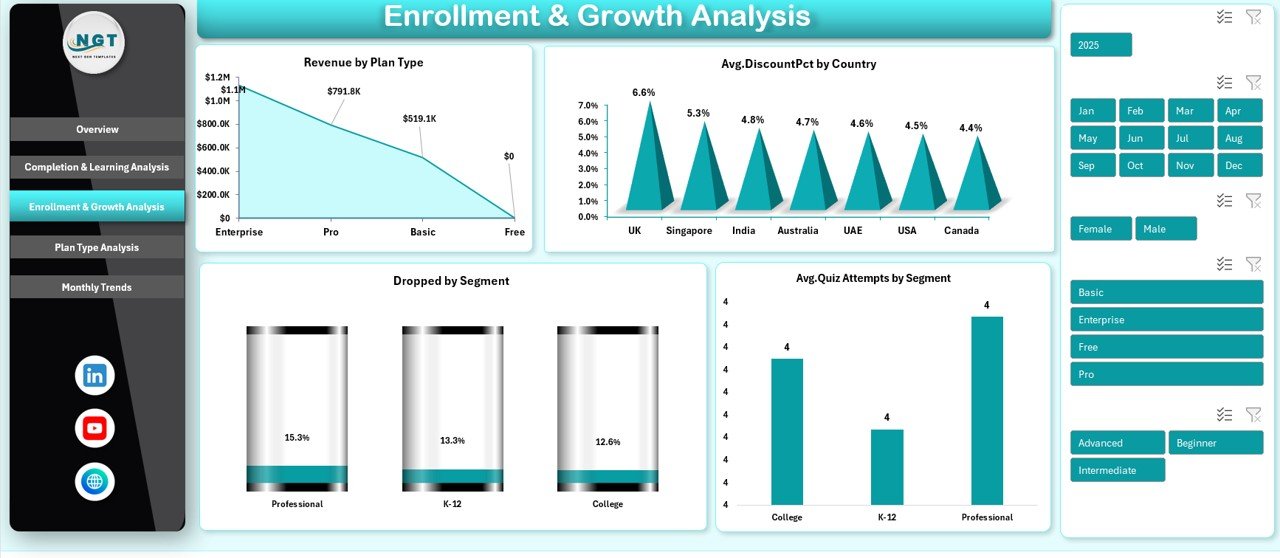
Enrollment & Growth Analysis: How Is the Platform Growing?
Growth metrics define long-term success. Therefore, the Enrollment & Growth Analysis sheet focuses on expansion trends and learner behavior.
Metrics Included in This Sheet
- Revenue by Plan Type
Compares subscription plans, certifications, and one-time purchases. - Dropped by Segment
Identifies learner groups with higher churn. - Avg. Discount % by Country
Evaluates pricing and promotional strategies across regions. - Avg. Quiz Attempts by Segment
Indicates learner engagement and assessment difficulty.
Through this analysis, teams can optimize pricing, segmentation, and retention strategies.
Click to buy EdTech Dashboard in Excel
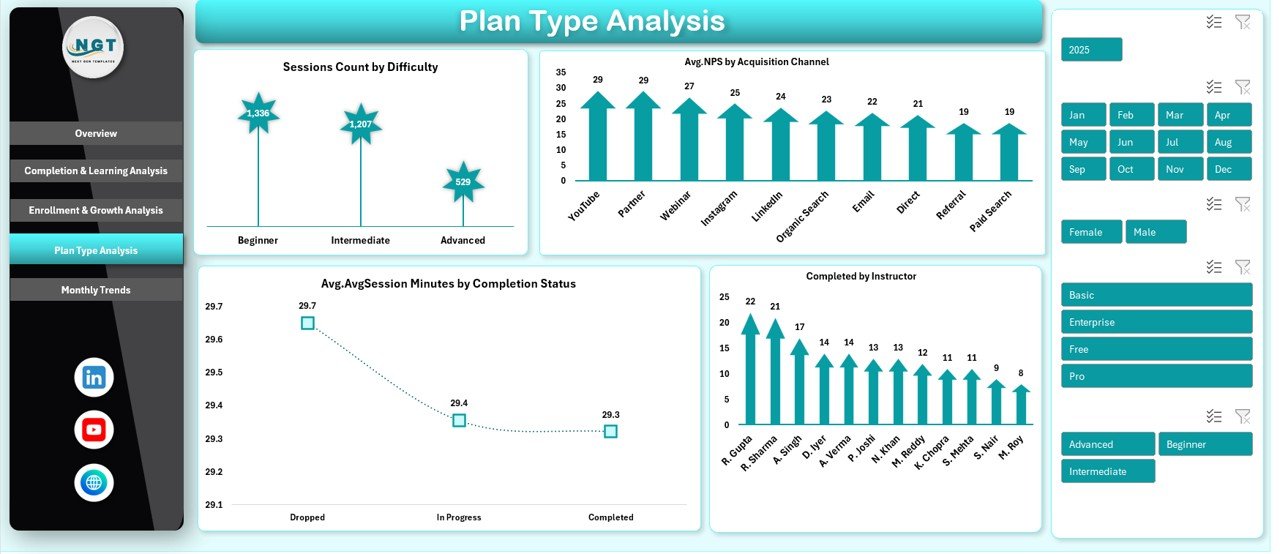
Plan Type Analysis: Which Plans and Instructors Perform Best?
The Plan Type Analysis sheet connects operational data with teaching outcomes.
Key Metrics in This Sheet
- Sessions Count by Difficulty
Shows how session volume varies across course levels. - Avg. NPS by Acquisition Channel
Measures learner satisfaction based on marketing sources. - Avg. Session Minutes by Completion Status
Identifies engagement differences between completed and dropped learners. - Completed by Instructor
Highlights instructor effectiveness and impact.
Because instructor quality and plan structure influence learner success, this sheet enables targeted improvements.
Click to buy EdTech Dashboard in Excel
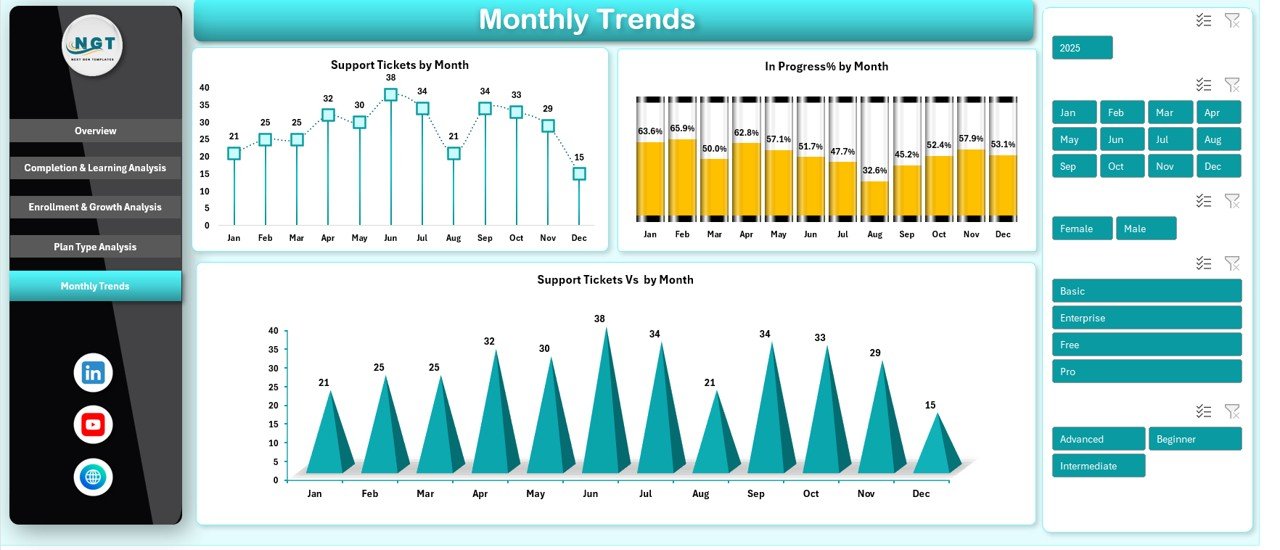
Monthly Trends: How Does Performance Change Over Time?
Trends reveal patterns that static numbers cannot show. The Monthly Trends sheet tracks time-based changes.
Monthly Trend Metrics
- Support Tickets by Month
Monitors learner support workload and service quality. - Support Tickets vs Month
Compares issue volume across periods. - In Progress % by Month
Tracks learner engagement consistency over time.
As a result, management can anticipate problems and proactively improve the learning experience.
Click to buy EdTech Dashboard in Excel
Advantages of EdTech Dashboard in Excel
An EdTech Dashboard in Excel offers several strategic and operational advantages.
Key Advantages
- Centralized performance monitoring
- Real-time insights with dynamic charts
- Easy customization without coding
- Cost-effective analytics solution
- Faster reporting and reduced manual work
- Better learner retention strategies
- Improved revenue visibility
- Scalable for growing EdTech platforms
Because of these benefits, Excel dashboards remain a preferred choice for many education businesses.
How Does an EdTech Dashboard in Excel Improve Decision-Making?
Decision-making improves significantly when leaders rely on data instead of intuition.
This dashboard helps decision-makers:
- Identify low-performing courses quickly
- Improve completion rates through difficulty analysis
- Optimize pricing using plan-wise revenue data
- Strengthen instructor performance with completion insights
- Enhance learner experience by tracking support tickets
Therefore, every strategic move becomes measurable and accountable.
Best Practices for the EdTech Dashboard in Excel
To get maximum value from your dashboard, you must follow proven best practices.
- Keep Data Clean and Structured
Always maintain consistent data formats for dates, percentages, and categories.
- Use Clear KPIs
Select KPIs that align directly with business and learning goals.
- Update Data Regularly
Frequent updates ensure accurate insights and timely actions.
- Use Simple Visuals
Avoid clutter. Use clean charts and readable labels.
- Segment Data Smartly
Analyze performance by course, difficulty, region, and learner segment.
- Track Trends, Not Just Totals
Monthly and quarterly trends reveal growth patterns and risks.
- Review Insights Periodically
Schedule weekly or monthly reviews to act on insights.
Following these practices ensures long-term dashboard effectiveness.
Common Challenges While Using an EdTech Dashboard in Excel
Although Excel dashboards offer flexibility, some challenges may arise.
Typical Challenges
- Managing large datasets efficiently
- Ensuring data accuracy across sources
- Avoiding overly complex formulas
- Keeping dashboards user-friendly
However, structured data models and disciplined updates can solve these challenges effectively.
Who Can Use an EdTech Dashboard in Excel?
This dashboard suits a wide range of users.
- EdTech founders and executives
- Online course platforms
- Training and certification institutes
- Learning and development teams
- Academic administrators
- Education consultants
Because of its versatility, almost every education-focused organization can benefit from it.
Conclusion: Why Should You Use an EdTech Dashboard in Excel?
An EdTech Dashboard in Excel transforms scattered educational data into meaningful insights. It helps you track revenue, enrollments, learning outcomes, engagement, and trends in one powerful file.
Moreover, it supports smarter decisions, improves learner success, and drives sustainable growth. When you combine structured data with clear visuals, Excel becomes a strategic analytics engine for your EdTech business.
If you want clarity, control, and confidence in your education analytics, this dashboard offers the perfect solution.
Frequently Asked Questions About EdTech Dashboard in Excel
- What data do I need to create an EdTech Dashboard in Excel?
You need enrollment data, revenue data, course details, learner progress, session metrics, and support ticket data.
- Can beginners use an EdTech Dashboard in Excel?
Yes. A well-designed dashboard uses simple navigation, clear visuals, and minimal formulas.
- How often should I update the dashboard?
You should update it weekly or monthly, depending on your reporting needs.
- Can I customize the dashboard for my EdTech platform?
Absolutely. Excel allows complete customization of KPIs, charts, and layouts.
- Is Excel suitable for large EdTech datasets?
Yes, especially when you use structured tables, pivot tables, and efficient formulas.
- How does this dashboard help reduce learner dropouts?
It highlights difficulty-wise progress, drop-off segments, and engagement gaps, allowing timely interventions.
- Can this dashboard replace BI tools?
For small to mid-size EdTech businesses, Excel dashboards often provide sufficient analytics without extra cost.
Visit our YouTube channel to learn step-by-step video tutorials
Watch the step-by-step video tutorial:
Click to buy EdTech Dashboard in Excel