Struggling with endless data in Excel? Fear not! Our snazzy video, “Show Data Dynamically using Vertical Scroll Bar in Excel,” is your ticket to simplicity and excitement in data handling. Let’s dive into making your Excel sheets not just informative but also super interactive, using only 10 rows!
Step 1: Begin with the Basics
Setting Up Your Data Stage
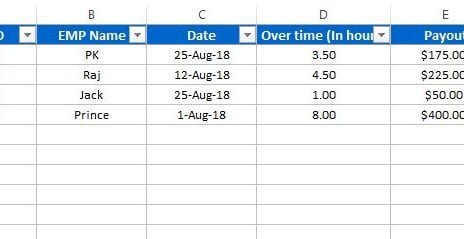
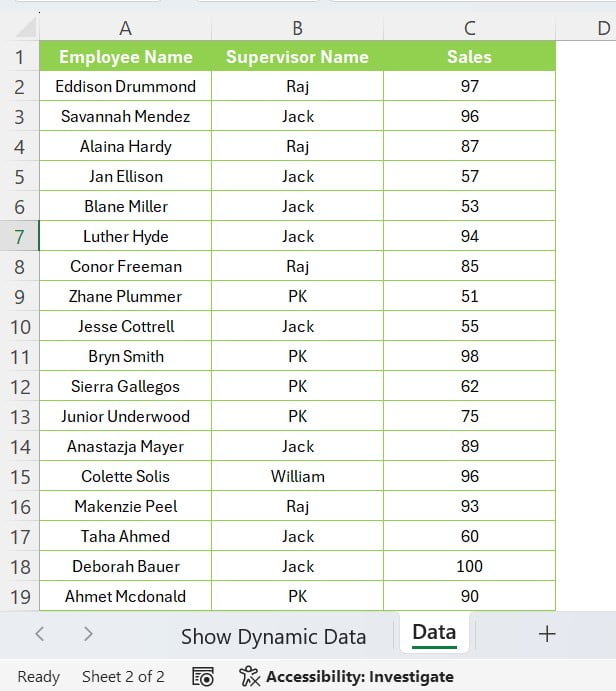
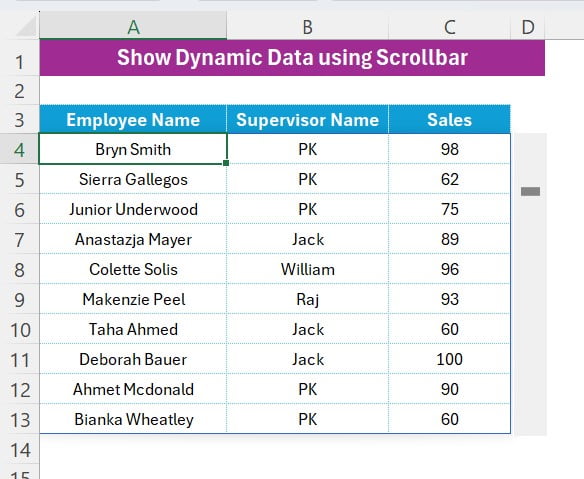
Firstly, picture your Excel sheet brimming with sales data. You’ve got columns for Employee Name, Supervisor Name, and Sales (Columns A, B, and C). Now, imagine showcasing all this info in just a small window from A3 to C13. Exciting, right?
Header Time!
Here’s the kickoff:
- Pop “Employee Name” into A3.
- Slide “Supervisor Name” into B3.
- Drop “Sales” into C3.
Simple, isn’t it? You’re setting the stage for something great!
Step 2: Scroll Bar in Excel
Adding the Scroll Bar
Next up, the vertical scroll bar – your new best friend in Excel! This little wonder will transform how you view data. Let’s add it:
- Go to the Developer tab, click Insert, and choose a Form Controls Scroll Bar.
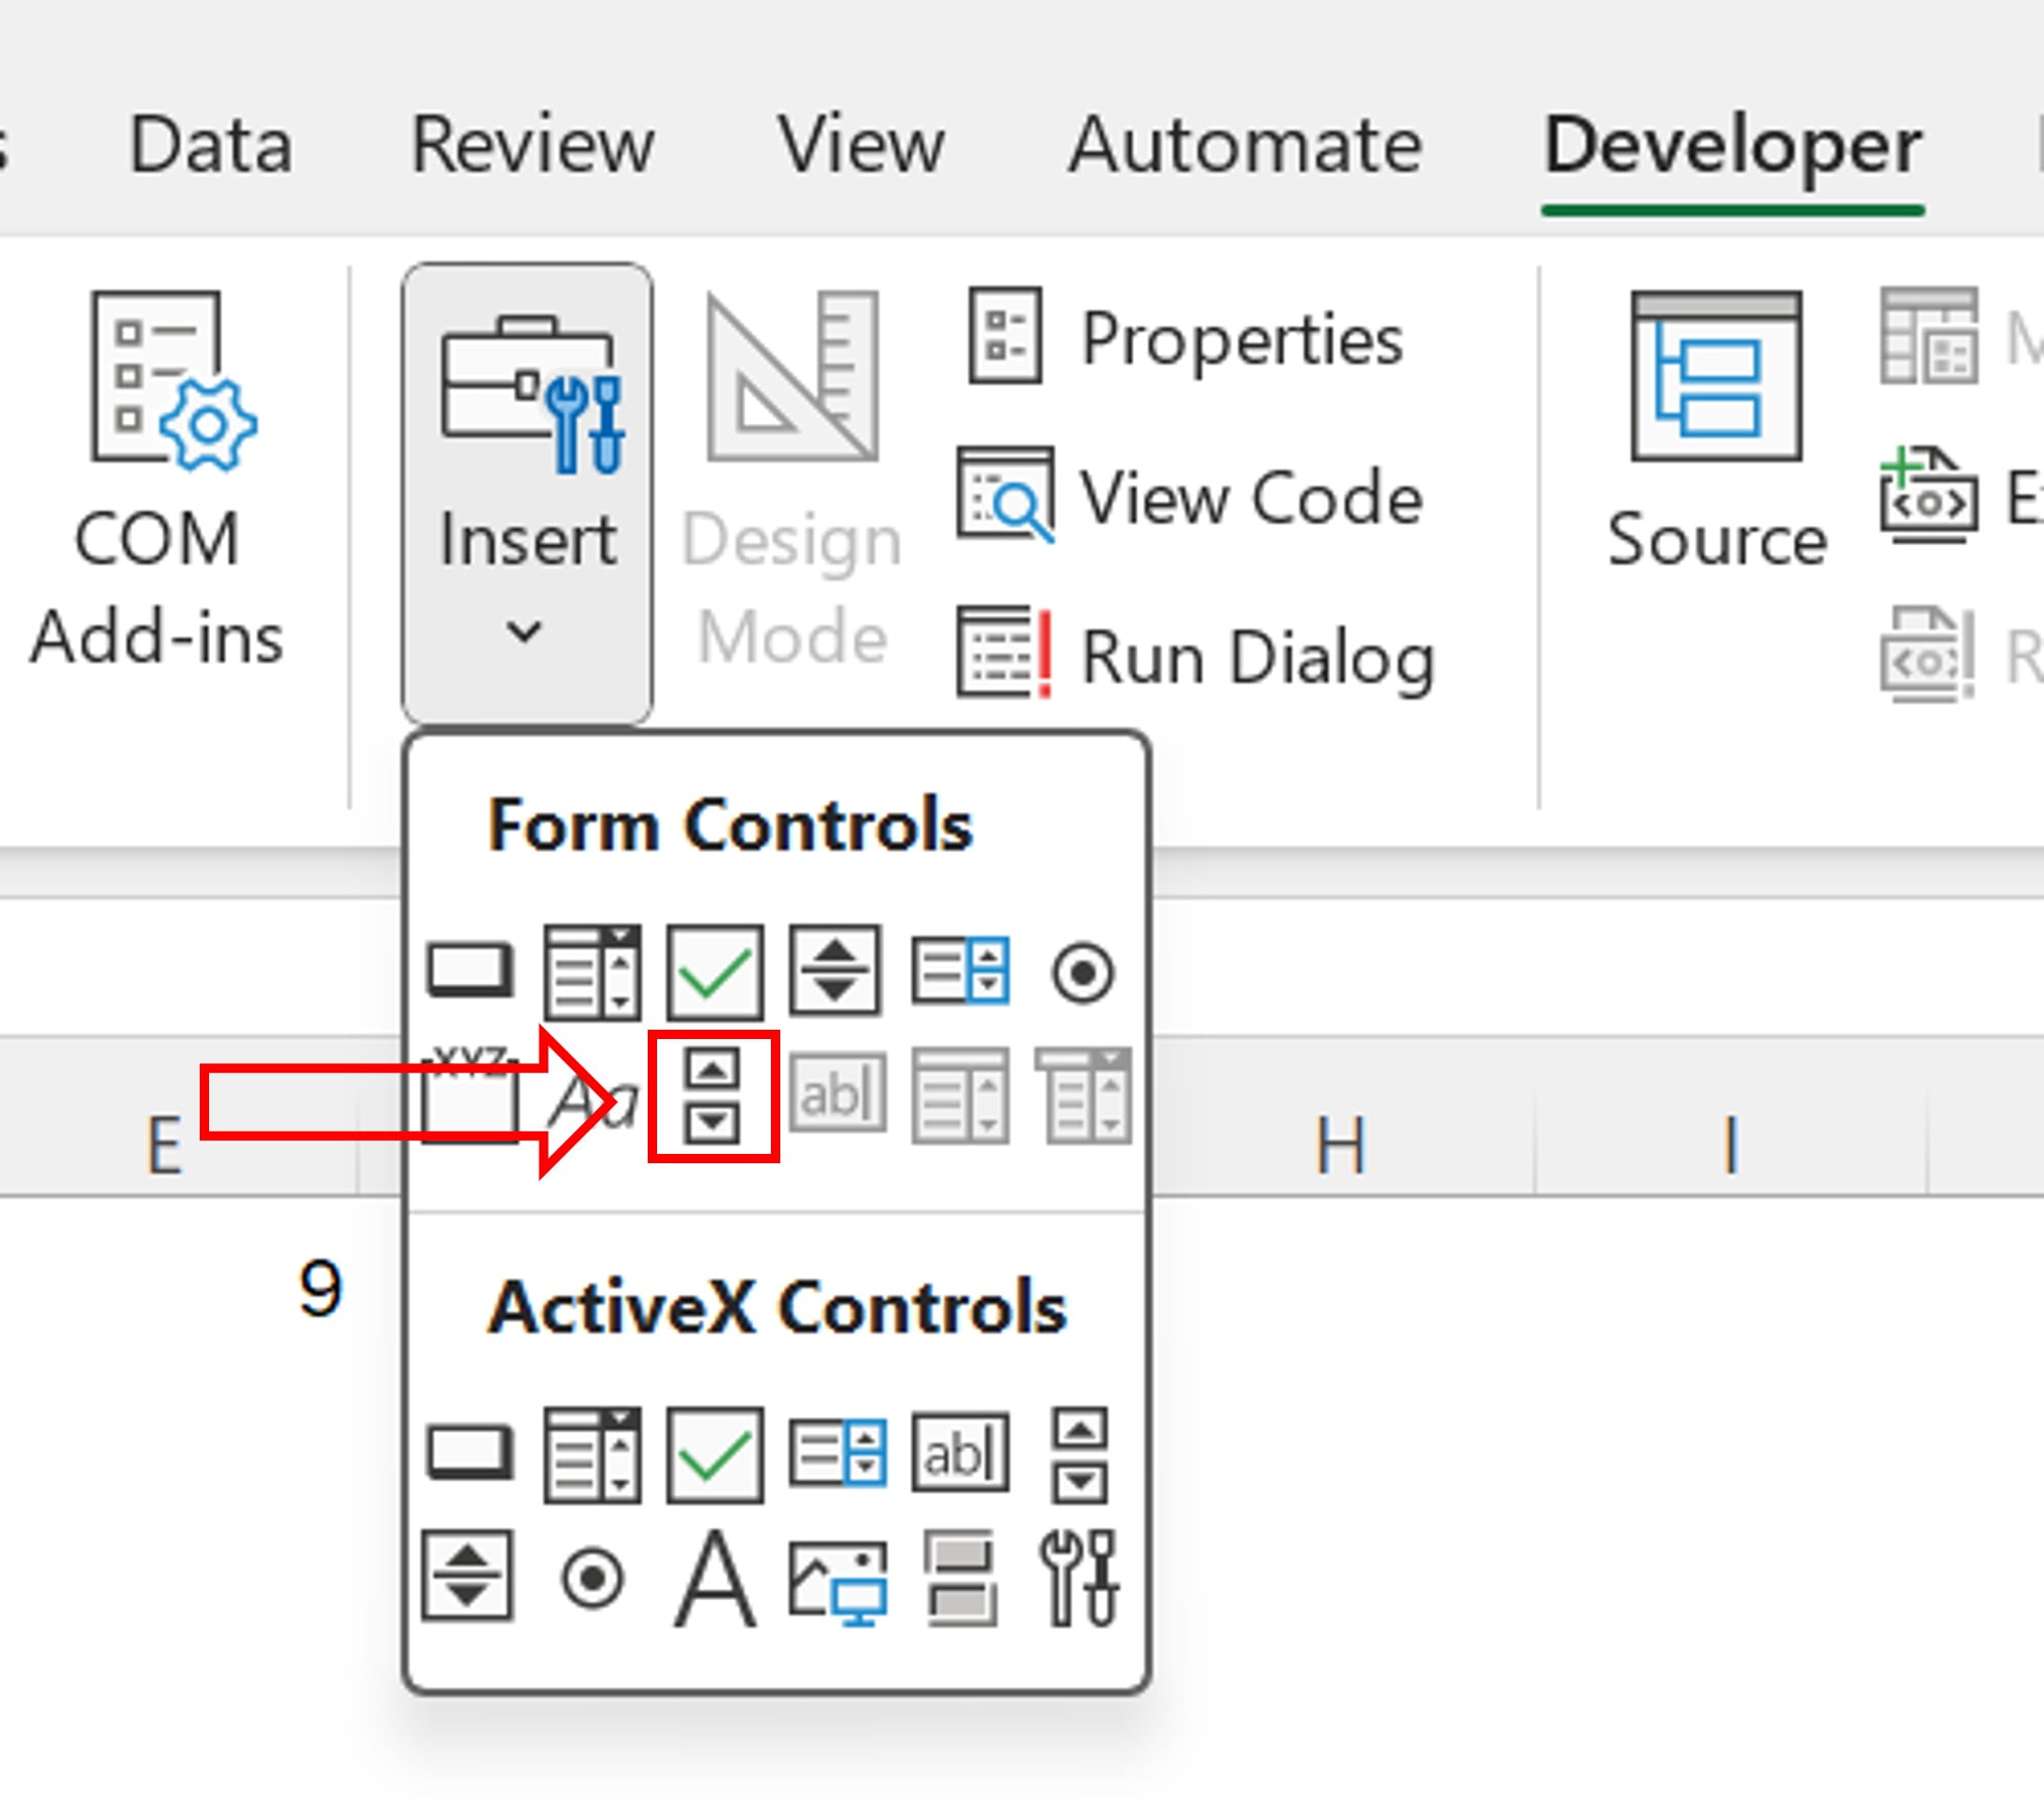
- Drag it over D4 to D13.
- Right-click the Scroll Bar, select “Format Control,” and set the cell link to “$E$1”.
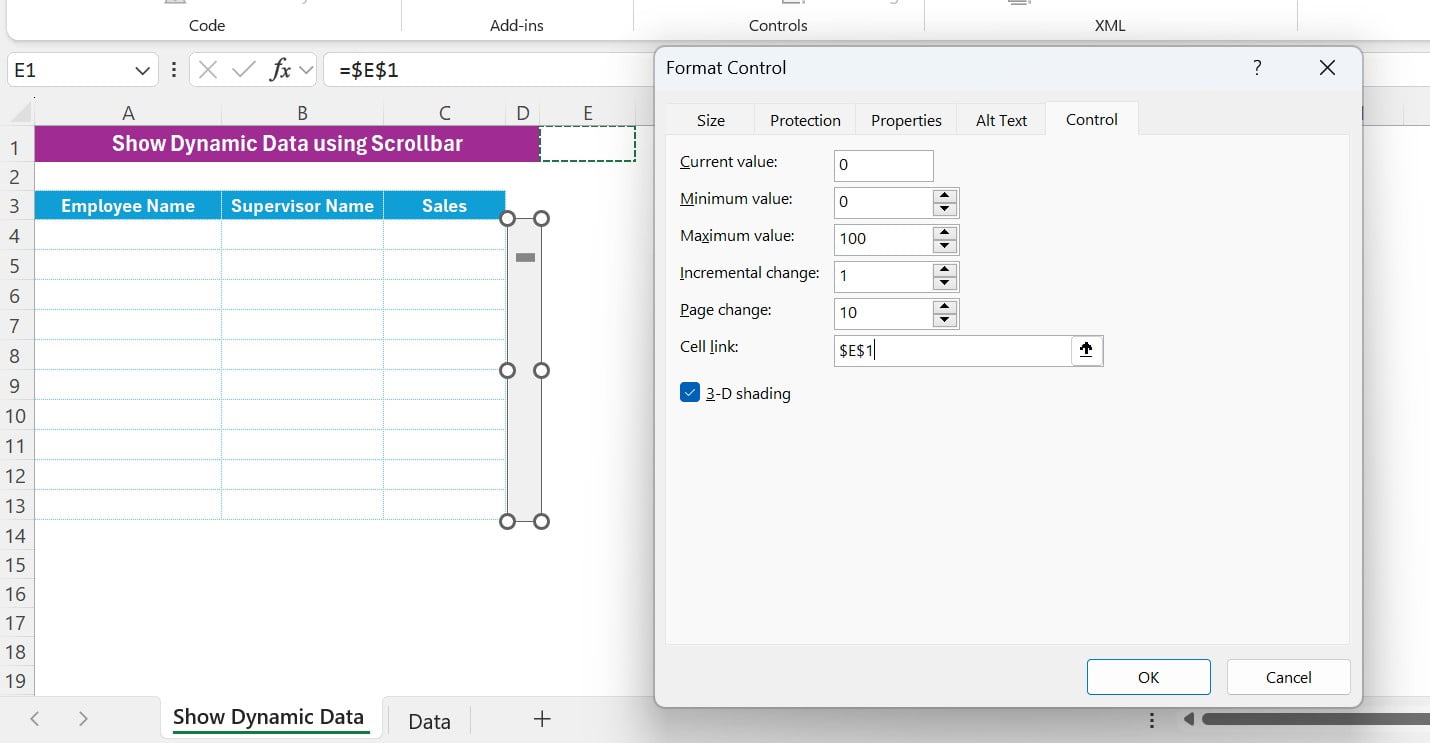
Boom! You’ve just levelled up your Excel game.
Step 3: Dynamic Data Dance
Make Your Data Move
It’s showtime! Link your data to the scroll bar with this cool formula in A4:
=INDEX(Data!A2:C59,E1+ROW(F1:F10),{1,2,3})
As you scroll, watch your data change dynamically. It’s like your data is dancing to your tunes!
Conclusion: Excel Like a Pro!
And voilà! You’re now a wizard at making Excel data dynamic and fun. This isn’t just about data display; it’s about making your spreadsheets come alive, saving space, and adding a pinch of fun to data management.
Remember, Excel is all about turning complex data into easy, interactive experiences. You’re now ready to excel in Excel!
Visit our YouTube channel to learn step-by-step video tutorials