In today’s competitive investment environment, clear, accurate, and timely communication with investors matters more than ever. Investors no longer rely only on static reports or long presentations. Instead, they expect real-time insights, transparent performance metrics, and visual clarity. That is exactly where an Investor Relations Dashboard in Excel delivers exceptional value.
An Investor Relations Dashboard in Excel helps organizations present complex investment data in a simple, visual, and interactive format. Moreover, it empowers investor relations teams, CFOs, finance leaders, and founders to communicate performance, funding progress, and returns confidently.
In this detailed article, you will learn what an Investor Relations Dashboard in Excel is, why it matters, how it works, its page-wise structure, advantages, opportunities for improvement, best practices, and FAQs. In addition, this guide uses simple language, strong transitions, and practical examples so you can apply everything immediately.
Click to Purchases Investor Relations Dashboard in Excel
What Is an Investor Relations Dashboard in Excel?
An Investor Relations Dashboard in Excel is a centralized and interactive reporting tool that tracks, analyzes, and visualizes key investor-related metrics such as investment amounts, expected IRR, dividend yield, investor count, funding rounds, and investment status.
Instead of managing multiple spreadsheets, emails, and slide decks, this dashboard brings all investor-focused insights into one structured Excel file. As a result, stakeholders gain instant visibility into performance and trends.
Because the dashboard runs in Microsoft Excel, it offers flexibility, accessibility, and cost efficiency. Moreover, Excel allows easy customization, strong calculations, and powerful charts without advanced BI tools.
Why Do Companies Need an Investor Relations Dashboard in Excel?
Investor relations teams face increasing pressure to deliver accurate, consistent, and transparent information. However, manual reporting creates delays and errors.
An Investor Relations Dashboard in Excel solves these challenges by:
-
Centralizing investor data
-
Improving reporting speed
-
Enhancing transparency
-
Supporting strategic discussions
-
Strengthening investor confidence
As a result, leadership teams can focus on decision-making instead of data preparation.
How Does an Investor Relations Dashboard in Excel Work?
The dashboard works by connecting structured data from a Data Sheet to multiple analytical pages using formulas, pivot tables, slicers, and charts.
Here is how the process flows:
-
You enter or import investor data into the Data Sheet
-
Excel formulas and pivot tables process the data
-
Slicers filter information by region, company, investor type, funding round, or month
-
Charts and KPIs update automatically
-
Stakeholders explore insights interactively
Therefore, one update in the data sheet refreshes the entire dashboard instantly.
What Are the Key Features of an Investor Relations Dashboard in Excel?
This ready-to-use Investor Relations Dashboard in Excel includes several powerful features that enhance usability and insight.
Page Navigator for Easy Navigation
A Page Navigator on the left side allows users to move quickly between analytical pages. Consequently, users avoid scrolling and confusion.
Interactive Slicers
Right-side slicers let users filter data by:
-
Company
-
Investor Type
-
Funding Round
-
Region
-
Month
As a result, users explore specific perspectives instantly.
Visual KPI Cards and Charts
The dashboard presents complex metrics using clear cards and charts, which improves understanding and communication.
What Is Included in the Investor Relations Dashboard in Excel?
The dashboard contains five structured analytical pages, along with a data support structure.
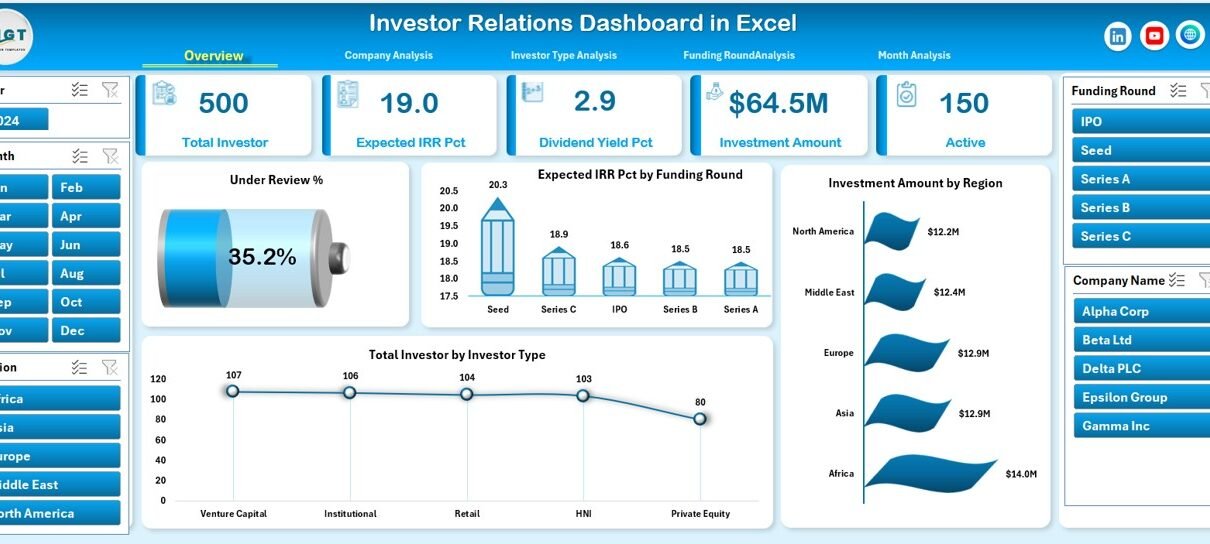
1. Overview Page: What Does the Overview Page Show?
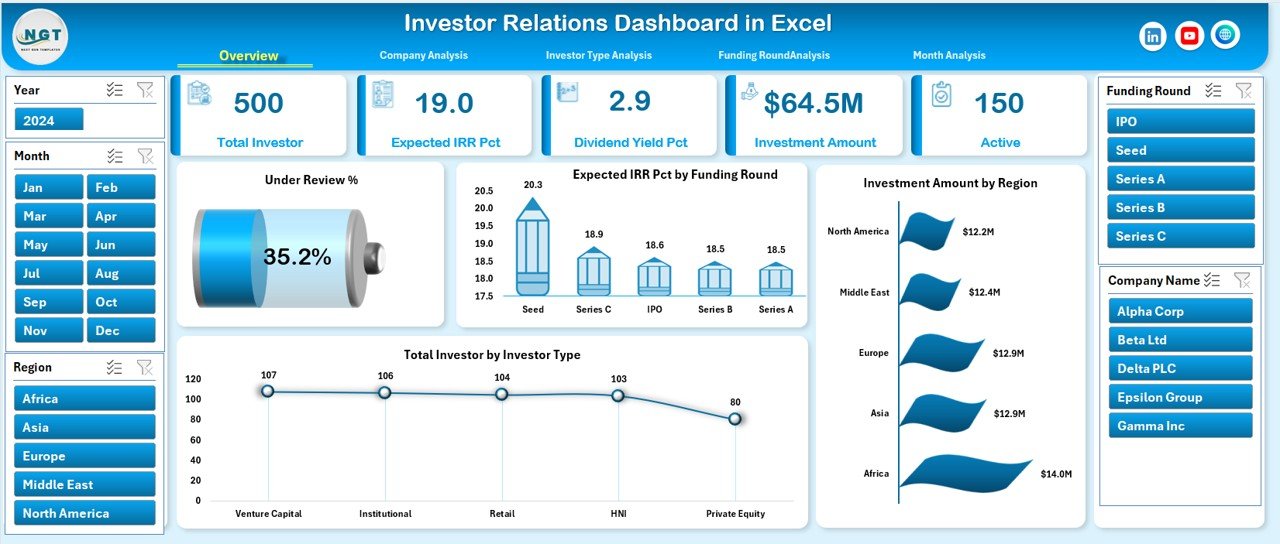
The Overview Page acts as the executive summary of the entire dashboard.
Key Highlights of the Overview Page
This page displays:
-
Four KPI Cards
-
Four High-level Charts
-
Global slicers on the right side
KPI Cards on the Overview Page
The cards provide instant insight into:
-
Under Review %
-
Expected IRR %
-
Total Investment Amount
-
Total Investors
These KPIs help leadership understand overall portfolio health at a glance.
Charts on the Overview Page
The page includes the following charts:
-
Under Review %
-
Expected IRR % by Funding Round
-
Investment Amount by Region
-
Total Investors by Investor Type
Because of these visuals, stakeholders can quickly identify performance patterns and regional exposure.
2. Company Analysis Page: How Does It Help Analyze Company Performance?
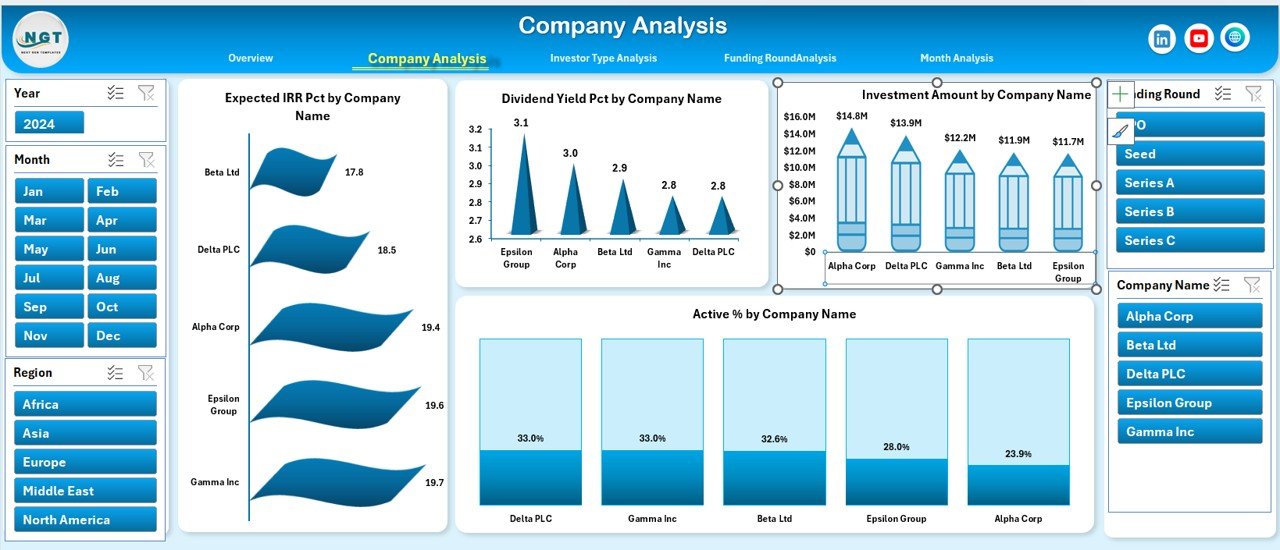
The Company Analysis Page focuses on company-wise investment performance.
What Metrics Does the Company Analysis Page Cover?
This page includes four charts:
-
Expected IRR % by Company Name
-
Dividend Yield % by Company Name
-
Investment Amount by Company Name
-
Active % by Company Name
Why Is Company Analysis Important?
Company-level insights help investor relations teams:
-
Highlight top-performing investments
-
Identify underperforming companies
-
Support portfolio rebalancing discussions
Therefore, this page plays a critical role during investor meetings.
3. Investor Type Analysis Page: How Can You Analyze Different Investor Groups?
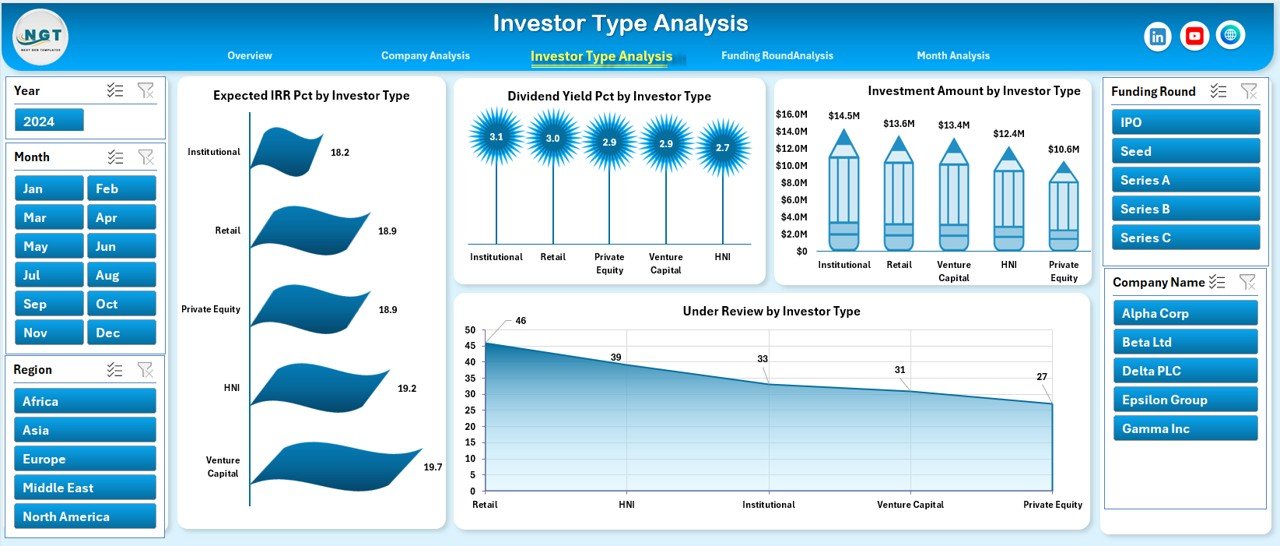
Different investor types behave differently. Hence, understanding investor composition matters.
Charts Included in Investor Type Analysis
This page includes:
-
Expected IRR % by Investor Type
-
Dividend Yield % by Investor Type
-
Investment Amount by Investor Type
-
Under Review % by Investor Type
Business Value of Investor Type Analysis
This analysis helps organizations:
-
Understand institutional vs individual behavior
-
Customize communication strategies
-
Optimize future fundraising approaches
As a result, investor engagement becomes more targeted and effective.
Click to Purchases Investor Relations Dashboard in Excel
4. Funding Round Analysis Page: Why Is Funding Round Analysis Critical?
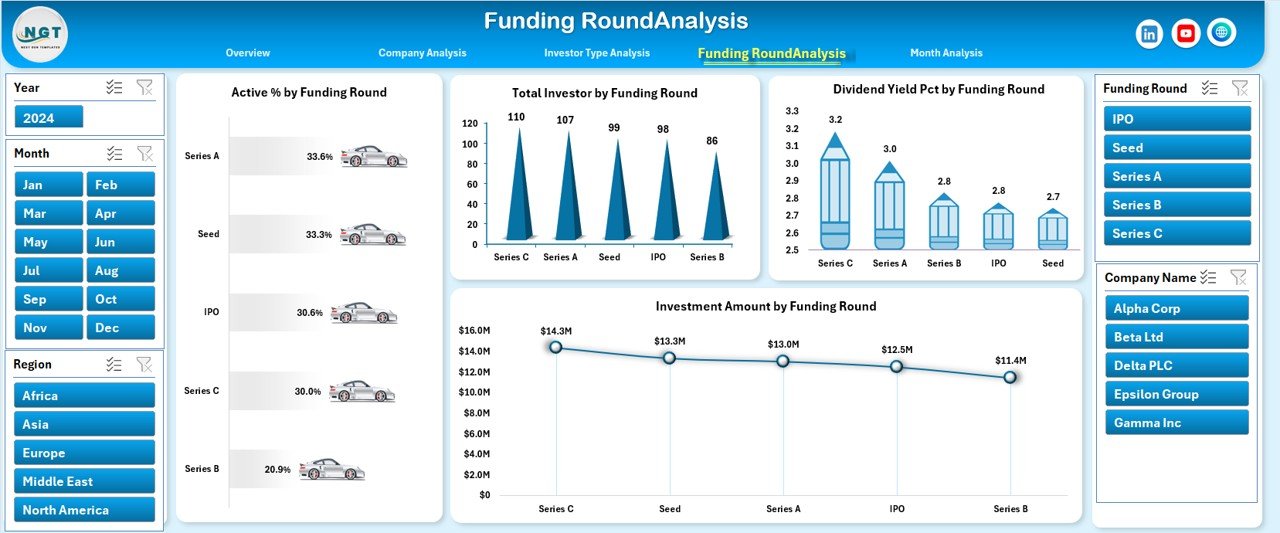
Funding rounds define investment maturity and risk profiles. Therefore, analyzing them adds strong strategic value.
Charts on the Funding Round Analysis Page
This page includes:
-
Active % by Funding Round
-
Total Investors by Funding Round
-
Dividend Yield % by Funding Round
-
Investment Amount by Funding Round
Strategic Benefits of Funding Round Analysis
This page helps teams:
-
Compare early-stage vs late-stage performance
-
Identify investor participation trends
-
Support future funding strategies
Hence, it becomes essential for founders and finance leaders.
5. Month Analysis Page: How Does Monthly Trend Analysis Support Decisions?
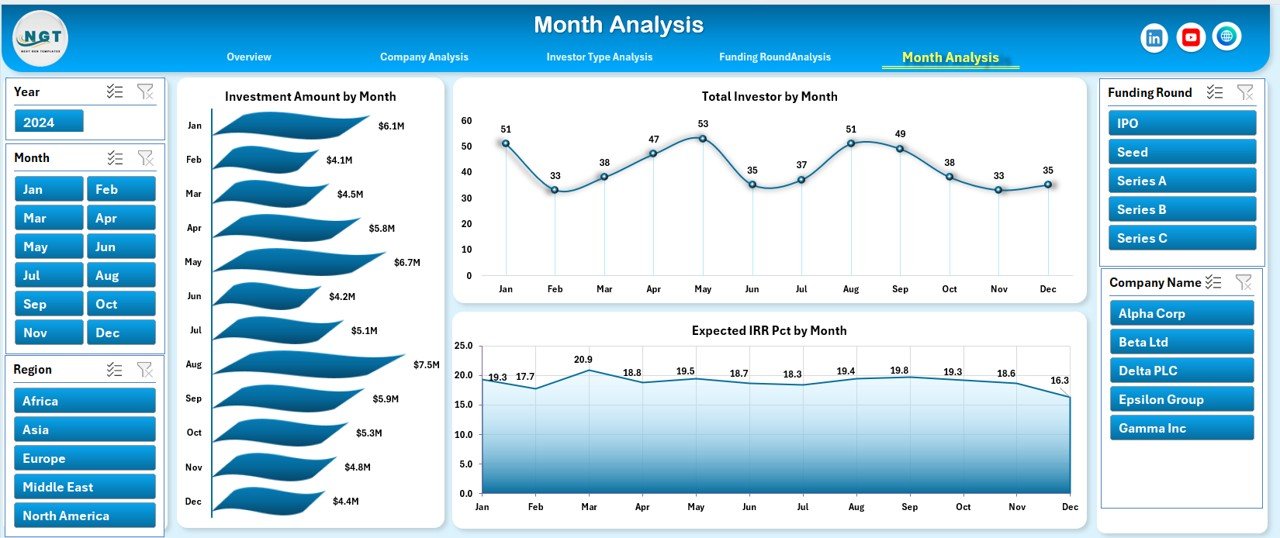
The Month Analysis Page tracks time-based performance.
Charts Included in Month Analysis
This page shows:
-
Investment Amount by Month
-
Total Investors by Month
-
Expected IRR % by Month
Why Monthly Analysis Matters
Monthly trends help organizations:
-
Monitor fundraising momentum
-
Identify seasonal patterns
-
Forecast future performance
Therefore, leadership teams gain forward-looking insights.
What Is the Role of the Data Sheet and Support Sheet?
Data Sheet
The Data Sheet stores all raw investor data, including:
-
Investor Name
-
Investor Type
-
Company Name
-
Region
-
Funding Round
-
Investment Amount
-
Expected IRR %
-
Dividend Yield %
-
Status
-
Date / Month
Because of proper structure, Excel processes data efficiently.
Support Sheet
The Support Sheet manages dropdowns, slicer values, and reference lists. As a result, the dashboard stays clean and consistent.
Advantages of an Investor Relations Dashboard in Excel
Key Advantages Explained
An Investor Relations Dashboard in Excel delivers multiple advantages:
-
📊 Centralized reporting – All investor metrics in one file
-
⚡ Real-time insights – Automatic updates with data refresh
-
🔍 Transparency – Clear and consistent communication
-
💰 Cost-effective – No expensive BI tools required
-
🧩 Customizable – Easy to modify KPIs and visuals
-
🤝 Investor confidence – Professional and data-driven presentations
Therefore, organizations strengthen trust and credibility.
Click to Purchases Investor Relations Dashboard in Excel
Opportunities for Improvement in an Investor Relations Dashboard
While Excel dashboards perform exceptionally well, teams can further enhance them.
Improvement Opportunities
-
Add scenario analysis for future funding
-
Include benchmark comparisons
-
Integrate automated data imports
-
Add risk scoring metrics
-
Expand ESG-related investor KPIs
By doing so, dashboards evolve with business needs.
Best Practices for the Investor Relations Dashboard in Excel
Follow These Best Practices for Maximum Impact
To get the best results, follow these proven best practices:
-
✅ Keep KPIs simple and relevant
-
✅ Use consistent definitions across pages
-
✅ Limit charts to key insights only
-
✅ Use slicers instead of filters
-
✅ Validate data regularly
-
✅ Maintain clean and structured data sheets
-
✅ Design with investors in mind
As a result, dashboards remain reliable and impactful.
How Can an Investor Relations Dashboard Improve Investor Communication?
An Investor Relations Dashboard in Excel transforms how teams communicate.
It:
-
Reduces manual reporting effort
-
Supports data-driven conversations
-
Improves meeting quality
-
Aligns internal and external messaging
Consequently, organizations build stronger investor relationships.
Who Should Use an Investor Relations Dashboard in Excel?
This dashboard suits:
-
Investor Relations Managers
-
CFOs and Finance Teams
-
Startup Founders
-
Private Equity Firms
-
Venture Capital Firms
-
Corporate Strategy Teams
Thus, it works across industries and company sizes.
Conclusion: Why Is an Investor Relations Dashboard in Excel a Smart Choice?
An Investor Relations Dashboard in Excel delivers clarity, transparency, and strategic insight in one powerful tool. It simplifies complex investment data, enhances communication, and supports better decisions.
Because it runs in Excel, it remains accessible, flexible, and cost-effective. Moreover, its structured pages, interactive slicers, and meaningful KPIs make it ideal for investor meetings and internal reviews.
If your organization wants to strengthen investor trust and improve reporting efficiency, this dashboard becomes an essential solution.
Frequently Asked Questions (FAQs)
What is the main purpose of an Investor Relations Dashboard in Excel?
The main purpose is to centralize investor data and present it visually for better communication and decision-making.
Can startups use an Investor Relations Dashboard in Excel?
Yes. Startups benefit greatly because the dashboard supports fundraising analysis, investor tracking, and performance communication.
Do I need advanced Excel skills to use this dashboard?
No. The dashboard uses intuitive slicers and visuals, so basic Excel knowledge works well.
Can I customize KPIs in the Investor Relations Dashboard?
Yes. You can easily add, remove, or modify KPIs based on business needs.
How often should investor data be updated?
You should update data monthly or after major investment events to maintain accuracy.
Is Excel suitable for investor reporting compared to BI tools?
Yes. Excel offers flexibility, control, and cost efficiency, especially for small and mid-sized organizations.
Visit our YouTube channel to learn step-by-step video tutorials