The esports and gaming industry grows faster than ever before. Every tournament, match, stream, and campaign generates massive data. However, raw data alone never creates success. Teams, managers, analysts, and investors need clear insights to make fast and accurate decisions. That is exactly why a Gaming Esports KPI Dashboard in Power BI plays a critical role.
A Gaming Esports KPI Dashboard in Power BI transforms complex esports data into simple, interactive, and actionable insights. Instead of switching between Excel sheets, reports, and manual calculations, stakeholders can monitor all key performance indicators (KPIs) in one powerful dashboard.
In this in-depth guide, you will learn what a Gaming Esports KPI Dashboard in Power BI is, how it works, why it matters, and how each dashboard page supports better esports decision-making. Moreover, you will explore its advantages, best practices, real-world use cases, challenges, and frequently asked questions.
Click to Purchases Gaming Esports KPI Dashboard in Power BI
What Is a Gaming Esports KPI Dashboard in Power BI?
A Gaming Esports KPI Dashboard in Power BI is a ready-to-use analytics solution designed to track, analyze, and visualize esports performance metrics in one centralized view.
Instead of manually reviewing performance numbers across months and years, this dashboard displays:
-
Actual vs Target KPIs
-
Month-to-Date (MTD) performance
-
Year-to-Date (YTD) performance
-
Current Year vs Previous Year comparisons
-
KPI trends and definitions
Because the dashboard uses Power BI with an Excel data source, it stays flexible, scalable, and easy to maintain. You simply update the Excel file, refresh the dashboard, and instantly see updated insights.
Why Does the Esports Industry Need KPI Dashboards?
Esports operates in a highly competitive and data-driven environment. Teams win or lose based on performance consistency, strategic decisions, and resource optimization. Therefore, tracking KPIs becomes essential.
A Gaming Esports KPI Dashboard in Power BI helps because:
-
It removes guesswork from decision-making
-
It highlights performance gaps instantly
-
It supports data-driven coaching strategies
-
It tracks growth trends over time
-
It aligns teams with measurable targets
As a result, organizations gain a strong competitive edge.
What Makes the Gaming Esports KPI Dashboard in Power BI Unique?
This dashboard focuses on clarity, usability, and performance tracking. It does not overload users with unnecessary visuals. Instead, it highlights what matters most.
Here is what makes it unique:
-
Ready-to-use structure
-
Excel-based data input
-
Clear MTD and YTD analysis
-
Visual performance indicators
-
Drill-through KPI definitions
Because of this structure, both technical and non-technical users can easily understand and use the dashboard.
How Is the Gaming Esports KPI Dashboard Structured?
The dashboard contains three powerful pages, each designed for a specific analytical purpose.
What Do You See on the Summary Page?
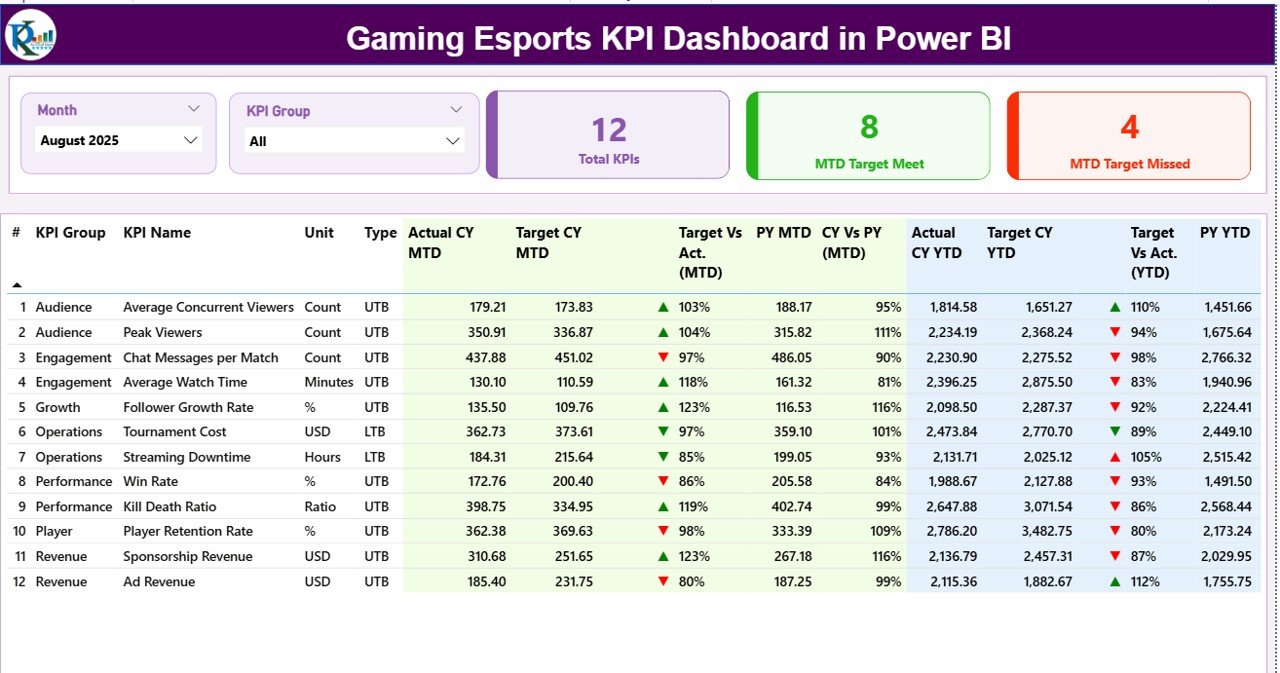
The Summary Page acts as the heart of the Gaming Esports KPI Dashboard in Power BI. It provides a complete snapshot of esports performance at a glance.
Key Filters and Slicers
At the top of the page, you see:
-
Month slicer to filter data by period
-
KPI Group slicer to analyze specific categories
These slicers allow instant filtering without changing reports.
KPI Cards for Instant Insights
Below the slicers, three KPI cards display:
-
Total KPIs Count
-
MTD Target Met Count
-
MTD Target Missed Count
These cards instantly show how well the organization performs against targets.
Why Is the Detailed KPI Table So Important?
The detailed KPI table provides deep insights into each performance metric. Instead of viewing KPIs in isolation, you see them in context.
Columns Explained in the KPI Table
-
KPI Number – Sequential identifier for KPIs
-
KPI Group – Category of KPI (Performance, Engagement, Revenue, etc.)
-
KPI Name – Name of the metric
-
Unit – Measurement unit
-
Type – UTB (Upper the Better) or LTB (Lower the Better)
MTD Performance Metrics
-
Actual CY MTD – Current Year Month-to-Date actual value
-
Target CY MTD – Current Year Month-to-Date target
-
MTD Icon – ▲ or ▼ icons with green or red colors
-
Target vs Actual (MTD) – Actual ÷ Target percentage
-
PY MTD – Previous Year MTD value
-
CY vs PY (MTD) – Current vs Previous Year comparison
YTD Performance Metrics
-
Actual CY YTD – Current Year Year-to-Date actual
-
Target CY YTD – Current Year Year-to-Date target
-
YTD Icon – Performance indicator icons
-
Target vs Actual (YTD) – Actual ÷ Target percentage
-
PY YTD – Previous Year YTD value
-
CY vs PY (YTD) – Year-over-Year comparison
Because of this structure, users instantly understand performance trends.
What Insights Does the KPI Trend Page Provide?
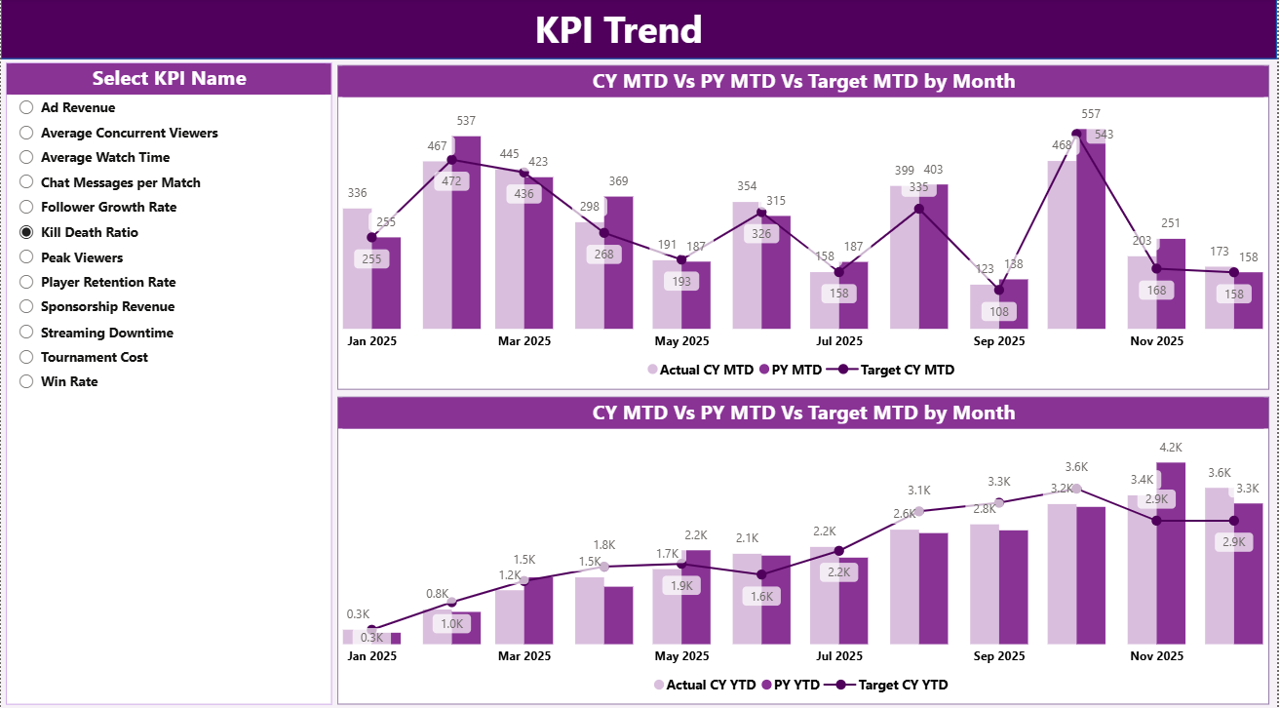
The KPI Trend Page focuses on performance patterns over time.
Key Features of the KPI Trend Page
Click to Purchases Gaming Esports KPI Dashboard in Power BI
-
KPI Name slicer on the left
-
Two combo charts for:
-
MTD trends
-
YTD trends
-
What Do the Combo Charts Show?
Each combo chart displays:
-
Current Year Actual values
-
Previous Year Actual values
-
Target values
This setup helps users:
-
Identify growth patterns
-
Spot seasonal changes
-
Detect performance volatility
-
Compare actuals against targets
As a result, teams make proactive decisions instead of reactive ones.
Why Is the KPI Definition Page Important?
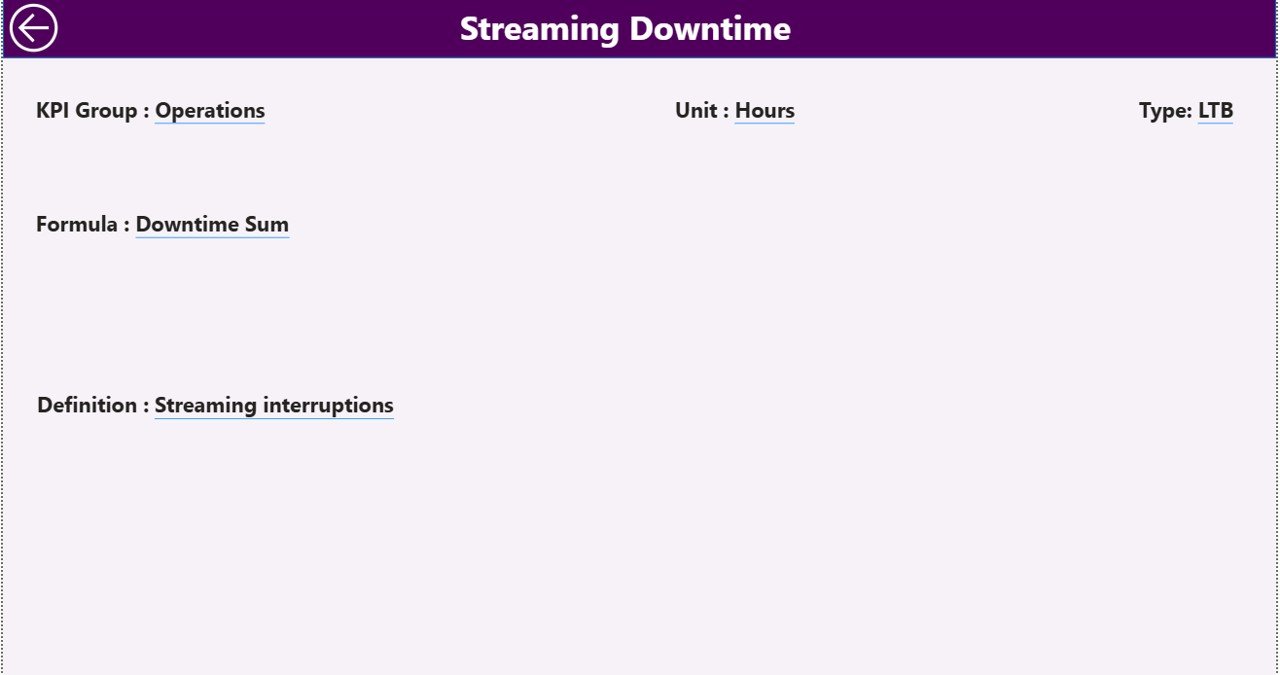
The KPI Definition Page improves clarity and transparency.
Purpose of the KPI Definition Page
-
Explains KPI formulas
-
Defines KPI objectives
-
Clarifies measurement logic
Because this page works as a hidden drill-through page, users can access definitions directly from the Summary Page.
Navigation Simplicity
A back button on the top-left corner returns users to the main page instantly. This design keeps navigation simple and intuitive.
How Does the Excel Data Source Power the Dashboard?
The dashboard uses an Excel file as its data source. This design keeps data management easy and flexible.
Input_Actual Sheet
In this sheet, users enter:
-
KPI Name
-
Month (first date of the month)
-
MTD actual values
-
YTD actual values
Input_Target Sheet
In this sheet, users enter:
-
KPI Name
-
Month (first date of the month)
-
MTD target values
-
YTD target values
KPI Definition Sheet
This sheet stores:
-
KPI Number
-
KPI Group
-
KPI Name
-
Unit
-
Formula
-
Definition
-
Type (UTB or LTB)
Because of this structure, updating data becomes fast and error-free.
Advantages of Gaming Esports KPI Dashboard in Power BI
Click to Purchases Gaming Esports KPI Dashboard in Power BI
A Gaming Esports KPI Dashboard in Power BI offers several advantages that directly impact performance and profitability.
Centralized Performance Tracking
You track all esports KPIs in one place. Therefore, you avoid scattered reports and manual consolidation.
Faster Decision-Making
Real-time visuals help teams react quickly. As a result, strategies improve continuously.
Clear Target Monitoring
Actual vs target comparisons highlight gaps instantly. Consequently, teams stay aligned with goals.
Historical Performance Analysis
MTD, YTD, and Year-over-Year comparisons reveal long-term trends.
User-Friendly Design
Simple layouts, icons, and slicers ensure easy usage for everyone.
Who Can Benefit from This Dashboard?
A Gaming Esports KPI Dashboard in Power BI serves multiple stakeholders.
Esports Team Managers
They monitor team performance and optimize strategies.
Coaches and Analysts
They analyze trends, consistency, and improvement areas.
Esports Organizations
They track operational KPIs and overall growth.
Sponsors and Investors
They review performance transparency and ROI indicators.
Tournament Organizers
They evaluate event performance and participation metrics.
Best Practices for the Gaming Esports KPI Dashboard in Power BI
Following best practices ensures long-term dashboard success.
Define KPIs Clearly
Always document KPI definitions, formulas, and intent.
Maintain Data Accuracy
Update Excel sheets regularly and validate values.
Use Meaningful KPI Groups
Group KPIs logically for better analysis.
Monitor Trends Consistently
Review MTD and YTD trends on a fixed schedule.
Keep the Dashboard Clean
Avoid unnecessary visuals that distract users.
Educate Users
Ensure users understand UTB and LTB logic.
Common Challenges in Esports KPI Tracking and How to Solve Them
Challenge: Data Inconsistency
Solution: Standardize data entry formats in Excel.
Challenge: KPI Overload
Solution: Focus on critical KPIs that drive results.
Challenge: Misinterpretation of Metrics
Solution: Use the KPI Definition Page effectively.
Challenge: Manual Reporting Delays
Solution: Refresh Power BI dashboards regularly.
How Does This Dashboard Improve Competitive Performance?
By visualizing performance clearly, teams identify weaknesses early. Moreover, they compare current performance with past results. As a result, continuous improvement becomes achievable.
This dashboard turns esports data into a strategic advantage.
Conclusion
The Gaming Esports KPI Dashboard in Power BI delivers clarity, speed, and accuracy in performance tracking. It simplifies complex esports data into interactive insights that drive smarter decisions.
With structured pages, Excel-based inputs, and powerful Power BI visuals, this dashboard supports teams, managers, and stakeholders in achieving measurable success. If you want better visibility, stronger performance alignment, and data-driven growth, this dashboard becomes an essential tool.
Frequently Asked Questions (FAQs)
Click to Purchases Gaming Esports KPI Dashboard in Power BI
What is a Gaming Esports KPI Dashboard in Power BI?
It is an interactive dashboard that tracks esports KPIs using Power BI and Excel data sources.
Can I customize KPIs in this dashboard?
Yes, you can add, modify, or remove KPIs through the Excel input sheets.
Does the dashboard support MTD and YTD analysis?
Yes, it includes both Month-to-Date and Year-to-Date performance metrics.
How often should I update the Excel data?
You should update it monthly or after major events for accurate insights.
Is this dashboard suitable for beginners?
Yes, the design remains user-friendly and easy to understand.
Can I use this dashboard for different esports games?
Yes, you can adapt KPI names and groups for any esports title.
Visit our YouTube channel to learn step-by-step video tutorials