Smart wearables continue to reshape healthcare, fitness, sports, and lifestyle industries. However, as the market grows rapidly, businesses face one common challenge: tracking performance clearly and accurately. That is exactly where a Smart Wearables KPI Dashboard in Power BI becomes essential.
This detailed guide explains what a Smart Wearables KPI Dashboard in Power BI is, why it matters, how it works, and how businesses can use it effectively. Moreover, you will learn its advantages, best practices, and frequently asked questions to help you implement it with confidence.
Click to Purchases Smart Wearables KPI Dashboard in Power BI
What Is a Smart Wearables KPI Dashboard in Power BI?
A Smart Wearables KPI Dashboard in Power BI is a centralized analytical solution that helps organizations monitor, analyze, and compare key performance indicators related to smart wearable devices. It converts raw data from Excel into interactive, visual, and actionable insights.
Instead of reviewing scattered spreadsheets, decision-makers can track MTD (Month-to-Date) and YTD (Year-to-Date) performance in one place. As a result, teams gain faster insights, reduce reporting errors, and improve decision-making.
This dashboard uses Microsoft Power BI for visualization and Microsoft Excel as the data source. Therefore, it remains easy to maintain and simple to scale.
Why Do Smart Wearables Businesses Need a KPI Dashboard?
Smart wearables businesses handle massive volumes of performance data. However, without structure, data becomes confusing and unusable. Therefore, a KPI dashboard plays a vital role.
Key Reasons to Use a KPI Dashboard
-
It provides real-time performance visibility
-
It supports data-driven decisions
-
It reduces manual reporting effort
-
It highlights target achievements and gaps
-
It improves strategic planning
Moreover, teams can compare current performance with targets and previous years in just a few clicks. As a result, leadership can act faster and smarter.
How Does the Smart Wearables KPI Dashboard in Power BI Work?
The Smart Wearables KPI Dashboard in Power BI works through a simple yet powerful structure. It combines Excel-based data input with Power BI visualization.
Data Flow Overview
-
Data entry happens in Excel
-
Power BI connects to Excel
-
KPIs calculate automatically
-
Visuals update instantly
Because of this structure, users can update numbers easily without technical skills.
What Are the Key Pages in the Smart Wearables KPI Dashboard?
This ready-to-use dashboard contains three powerful pages, each designed for a specific analytical purpose.
1. What Does the Summary Page Show?
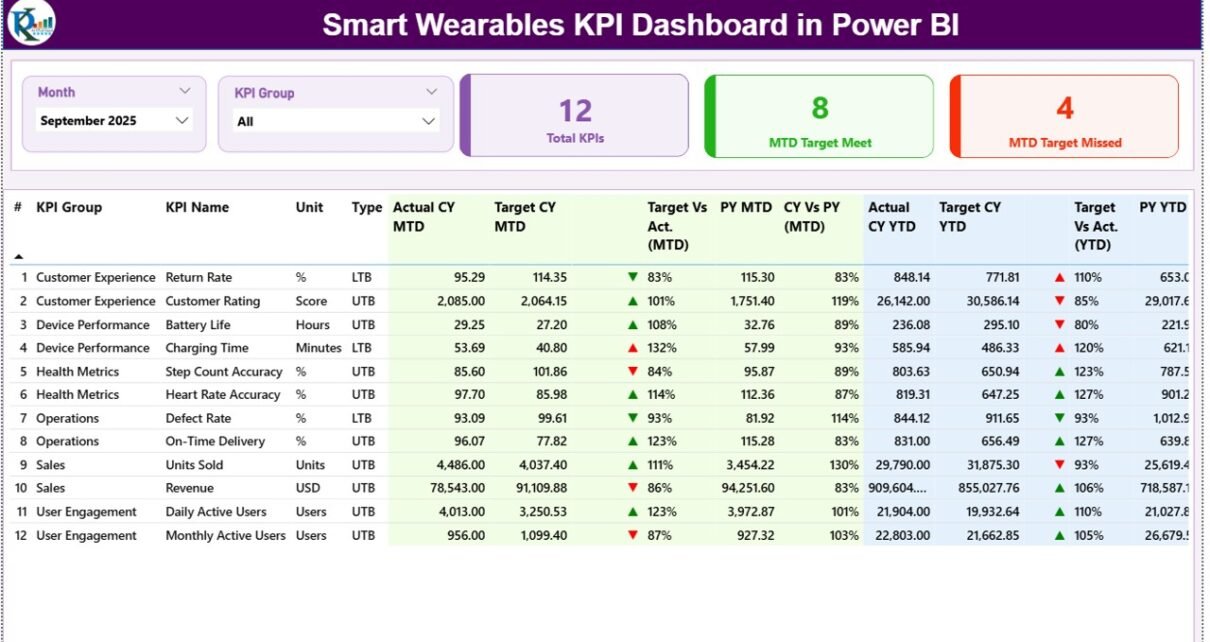
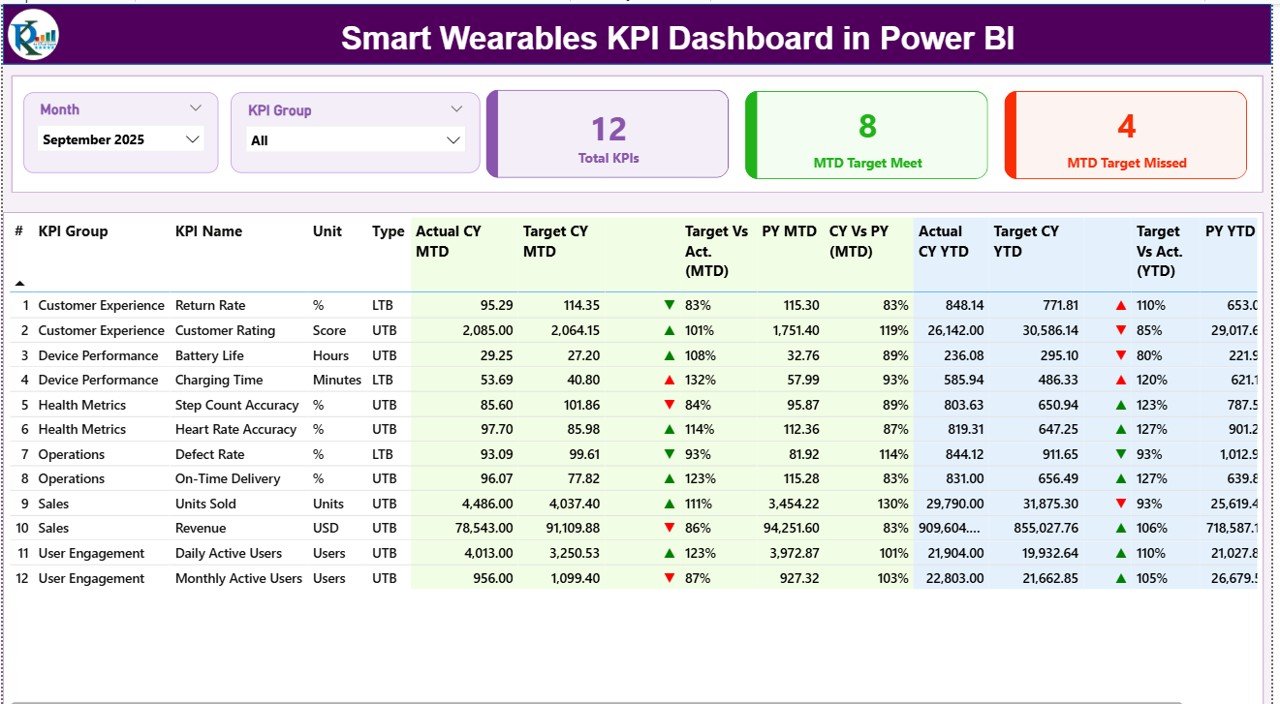
The Summary Page serves as the main dashboard view. It gives a complete snapshot of KPI performance at a glance.
Key Elements of the Summary Page
Interactive Slicers
-
Month slicer at the top
-
KPI Group slicer for category-based filtering
These slicers allow users to analyze data quickly by time period or KPI group.
KPI Cards
The dashboard displays three high-impact cards:
-
Total KPIs Count
-
MTD Target Met Count
-
MTD Target Missed Count
These cards instantly show overall performance status.
Detailed KPI Table Explained
Below the cards, the dashboard shows a detailed KPI table with rich performance insights.
-
KPI Number – Sequence number of each KPI
-
KPI Group – Category or group of the KPI
-
KPI Name – Name of the KPI
-
Unit – Measurement unit (%, hours, count, etc.)
-
Type – KPI type (LTB or UTB)
Performance Metrics Included
-
Actual CY MTD – Current Year MTD actual value
-
Target CY MTD – Current Year MTD target
-
MTD Icon – ▲ or ▼ icons with green/red colors
-
Target vs Actual (MTD) – Actual ÷ Target (%)
-
PY MTD – Previous Year MTD value
-
CY vs PY (MTD) – CY ÷ PY (%)
YTD Performance Metrics
-
Actual CY YTD
-
Target CY YTD
-
YTD Icon
-
Target vs Actual (YTD)
-
PY YTD
-
CY vs PY (YTD)
Because of this structure, users can compare targets, actuals, and trends without switching screens.
2. How Does the KPI Trend Page Help?
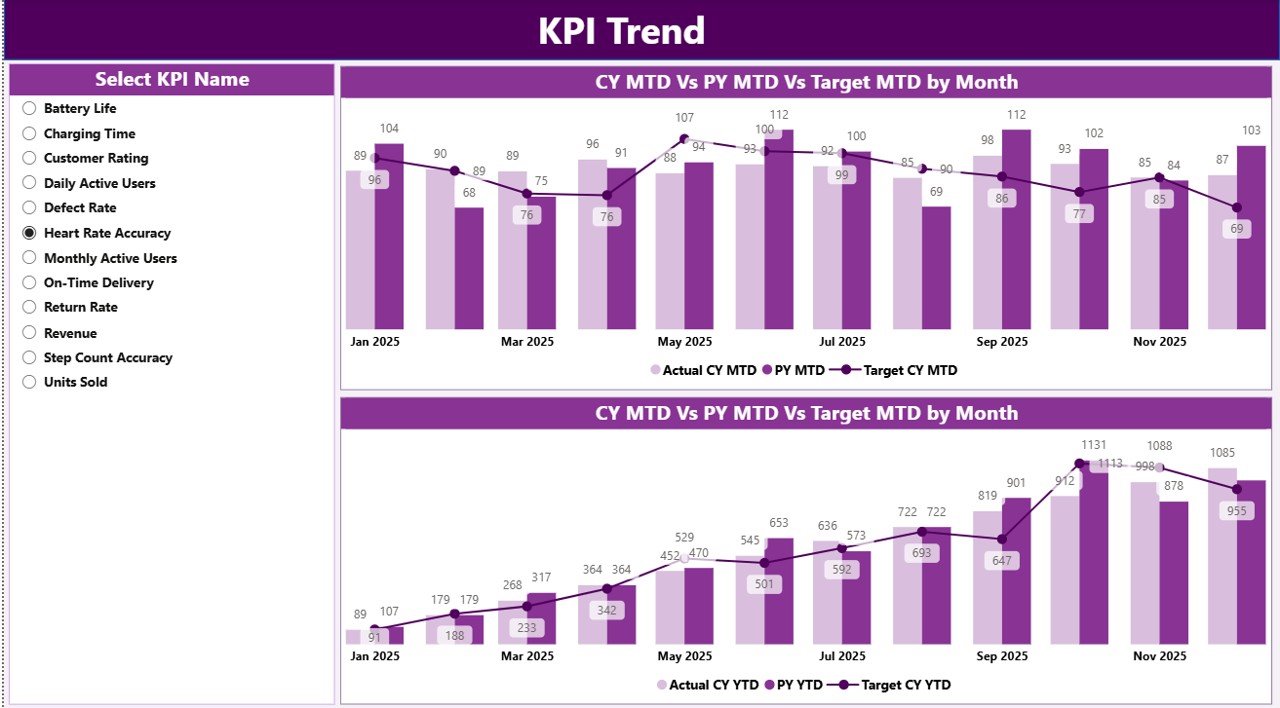
The KPI Trend Page focuses on performance trends over time.
Features of the KPI Trend Page
-
KPI Name slicer on the left
-
Two combo charts:
-
MTD Actual vs Target vs PY
-
YTD Actual vs Target vs PY
-
These charts help users:
-
Identify upward or downward trends
-
Compare performance year over year
-
Understand seasonality patterns
Therefore, trend analysis becomes faster and more visual.
3. What Is the Purpose of the KPI Definition Page?
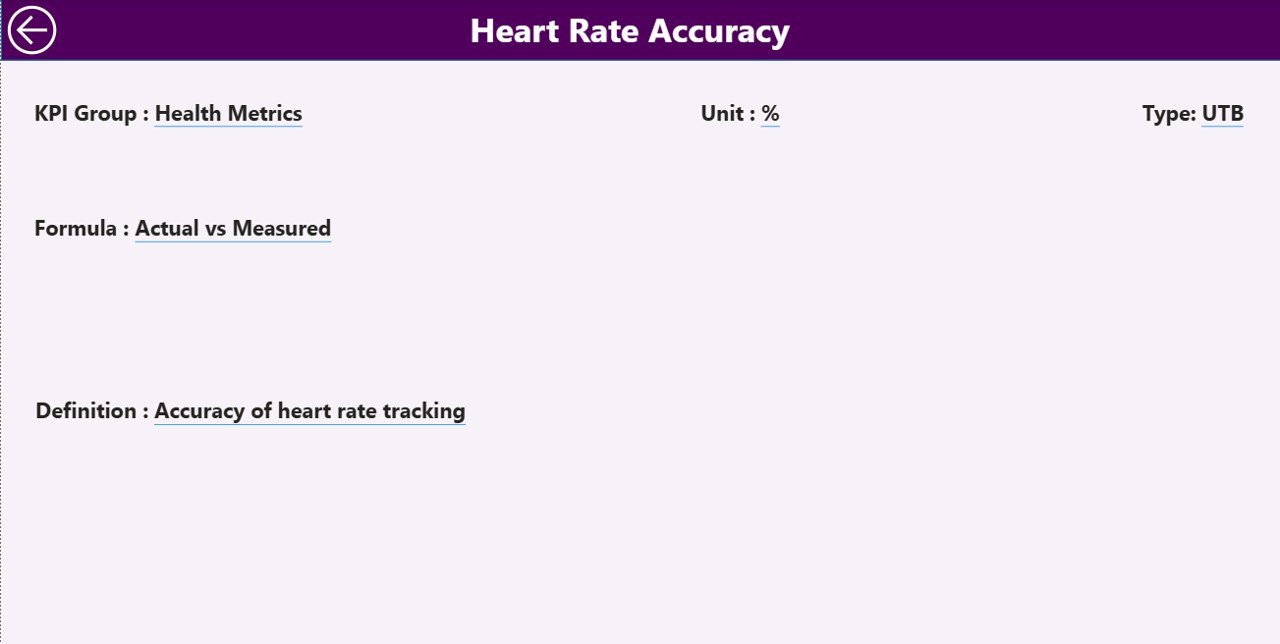
The KPI Definition Page provides deeper understanding of each KPI.
Key Highlights
-
Hidden drill-through page
-
Accessible from the Summary Page
-
Displays:
-
KPI Formula
-
KPI Definition
-
KPI Type (LTB or UTB)
-
This page ensures clarity and consistency across teams. Moreover, users can return to the main page using the back button on the top-left corner.
How Is Excel Used as the Data Source?
This dashboard uses Excel as its data source. As a result, data maintenance remains simple and flexible.
What Are the Excel Sheets Used in This Dashboard?
Click to Purchases Smart Wearables KPI Dashboard in Power BI
The Excel file contains three structured worksheets.
1. Input_Actual Sheet
This sheet stores actual performance data.
Required fields:
-
KPI Name
-
Month (first date of the month)
-
MTD Actual
-
YTD Actual
Users only need to enter numbers. Power BI handles the rest.
2. Input_Target Sheet
This sheet stores target values.
Required fields:
-
KPI Name
-
Month (first date of the month)
-
MTD Target
-
YTD Target
As targets update, visuals refresh automatically.
3. KPI Definition Sheet
This sheet defines each KPI.
Required fields:
-
KPI Number
-
KPI Group
-
KPI Name
-
Unit
-
Formula
-
Definition
-
Type (LTB or UTB)
Because definitions remain centralized, teams avoid confusion.
Advantages of Smart Wearables KPI Dashboard in Power BI
A Smart Wearables KPI Dashboard in Power BI offers several powerful advantages.
Key Advantages
-
✅ Centralized KPI tracking
-
✅ Real-time MTD and YTD analysis
-
✅ Visual target vs actual comparison
-
✅ Easy Excel-based data input
-
✅ Clear KPI definitions and formulas
-
✅ Interactive slicers and drill-through
-
✅ Reduced manual reporting effort
Moreover, leadership teams gain confidence in decisions because data remains accurate and transparent.
How Does This Dashboard Improve Business Decision-Making?
This dashboard supports better decisions by:
-
Highlighting underperforming KPIs
-
Showing growth trends clearly
-
Comparing current and past performance
-
Aligning teams around shared metrics
As a result, businesses can respond quickly to performance gaps and opportunities.
Best Practices for the Smart Wearables KPI Dashboard in Power BI
Following best practices ensures long-term success and reliability.
Recommended Best Practices
-
🔹 Keep KPI definitions clear and simple
-
🔹 Update Excel data regularly
-
🔹 Use consistent KPI naming
-
🔹 Validate targets before analysis
-
🔹 Limit KPIs to what matters most
-
🔹 Review trends monthly and quarterly
-
🔹 Train users on slicers and drill-through
By following these practices, teams maximize dashboard value.
How Can Teams Use This Dashboard Effectively?
Teams should integrate this dashboard into regular reviews.
Effective Usage Tips
-
Use it during monthly performance meetings
-
Share insights with leadership teams
-
Track improvement actions over time
-
Compare MTD and YTD trends together
Because the dashboard updates automatically, it supports continuous monitoring.
Who Can Benefit from a Smart Wearables KPI Dashboard?
This dashboard suits multiple roles and industries.
Ideal Users
-
Smart wearable manufacturers
-
Product managers
-
Operations teams
-
Business analysts
-
Strategy and leadership teams
Any organization tracking wearable performance can benefit.
Conclusion: Why Smart Wearables KPI Dashboard in Power BI Matters
A Smart Wearables KPI Dashboard in Power BI transforms raw data into meaningful insights. It simplifies KPI tracking, improves visibility, and supports faster decisions. Moreover, its Excel-based input and Power BI visuals make it easy to use and scale.
In a competitive smart wearables market, businesses that track performance clearly stay ahead. Therefore, adopting this dashboard becomes a smart and strategic move.
Frequently Asked Questions (FAQs)
Click to Purchases Smart Wearables KPI Dashboard in Power BI
What is a Smart Wearables KPI Dashboard in Power BI?
It is a visual analytics tool that tracks and analyzes smart wearables KPIs using Power BI and Excel.
Can non-technical users update this dashboard?
Yes. Users only need to update Excel sheets. Power BI updates automatically.
What does MTD and YTD mean?
MTD means Month-to-Date. YTD means Year-to-Date.
What is the difference between LTB and UTB KPIs?
LTB means Lower the Better. UTB means Upper the Better.
Can I customize KPIs in this dashboard?
Yes. You can add, remove, or modify KPIs in the Excel file.
Does this dashboard support trend analysis?
Yes. The KPI Trend Page shows MTD and YTD trends clearly.
Is this dashboard suitable for large datasets?
Yes. Power BI handles large datasets efficiently.
Visit our YouTube channel to learn step-by-step video tutorials