Running a pharmacy involves more than dispensing medicines. You must manage prescriptions, handle repeat visits, monitor staff efficiency, control delays, and ensure smooth workflows every single day. However, many pharmacies still rely on manual reports or scattered spreadsheets. As a result, workflow delays increase, bottlenecks remain hidden, and service quality drops.
That is exactly where a Pharmacy Workflow Bottleneck Analysis Dashboard in Power BI becomes a game-changer.
This detailed guide explains what this dashboard is, why it matters, how it works, its key features, advantages, best practices, and frequently asked questions. By the end, you will clearly understand how this dashboard helps pharmacies operate faster, smarter, and more efficiently.
What Is a Pharmacy Workflow Bottleneck Analysis Dashboard in Power BI?
A Pharmacy Workflow Bottleneck Analysis Dashboard in Power BI is an interactive analytics solution designed to identify delays, inefficiencies, and workflow issues across pharmacy operations.
Instead of guessing where problems exist, this dashboard visually highlights:
- Workflow stages that take too long
- Delay reasons that cause bottlenecks
- Repeat visits linked to inefficiencies
- Staff members or branches with performance gaps
Moreover, the dashboard updates dynamically as data changes. Therefore, pharmacy managers can act immediately rather than waiting for end-of-month reports.
Why Do Pharmacies Face Workflow Bottlenecks?
Pharmacies deal with multiple operational challenges every day. Although teams work hard, delays still happen. Let’s understand why.
Common Causes of Pharmacy Workflow Delays
- High prescription volume during peak hours
- Manual handoffs between workflow stages
- Limited staff during critical shifts
- Priority mismanagement for urgent cases
- Poor visibility into delay reasons
Because of these issues, pharmacies often experience long wait times, repeat visits, and dissatisfied customers.
That is why a workflow bottleneck analysis dashboard becomes essential.
How Does Power BI Help in Pharmacy Workflow Analysis?
Power BI transforms raw pharmacy data into clear and actionable insights. Instead of reviewing rows of numbers, managers see trends, patterns, and bottlenecks instantly.
Key Benefits of Using Power BI for Pharmacy Analytics
- Interactive visuals for faster understanding
- Real-time data refresh
- Easy filtering by branch, stage, staff, or delay reason
- Centralized reporting across workflows
As a result, decision-makers spend less time analyzing data and more time fixing problems.
What Are the Key Features of the Pharmacy Workflow Bottleneck Analysis Dashboard in Power BI?
This dashboard includes five powerful analytical pages, each designed to answer specific operational questions.
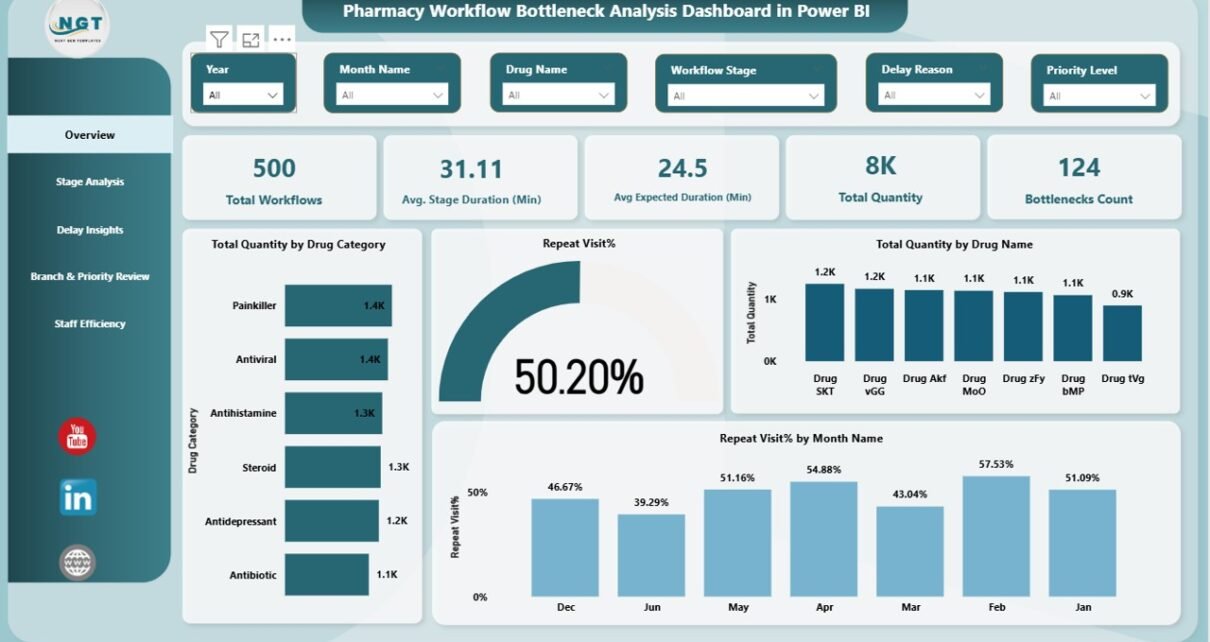
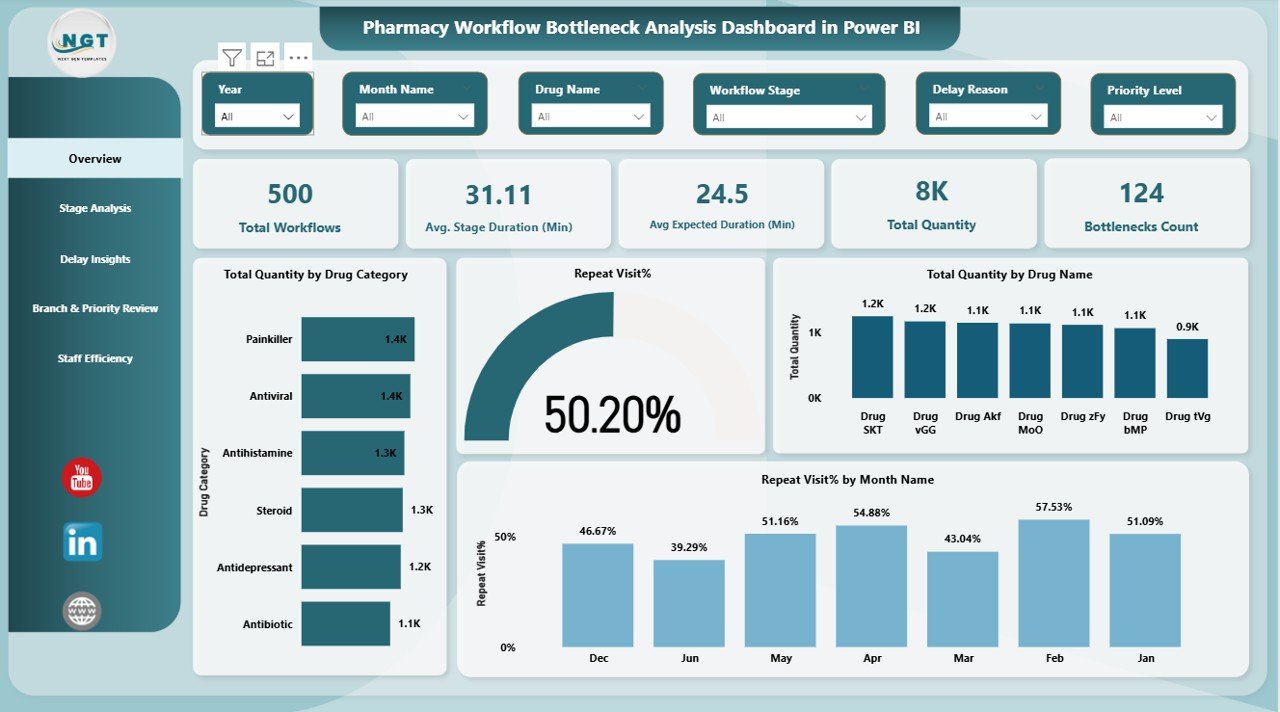
Overview Page: What Is Happening Across the Pharmacy?
The Overview page provides a high-level snapshot of overall pharmacy workflow performance.
Key Metrics on the Overview Page
- Total Workflows
- Average Stage Duration (Minutes)
- Avg.expected duration (Minutes)
- Bottlenecks Count
- Total Quantity Processed
Visual Insights Available
- Total quantity by drug category
- Total quantity by drug name
- Repeat visit percentage
- Repeat visit percentage by month
Because everything appears on one screen, managers instantly understand whether workflows perform efficiently or need attention.
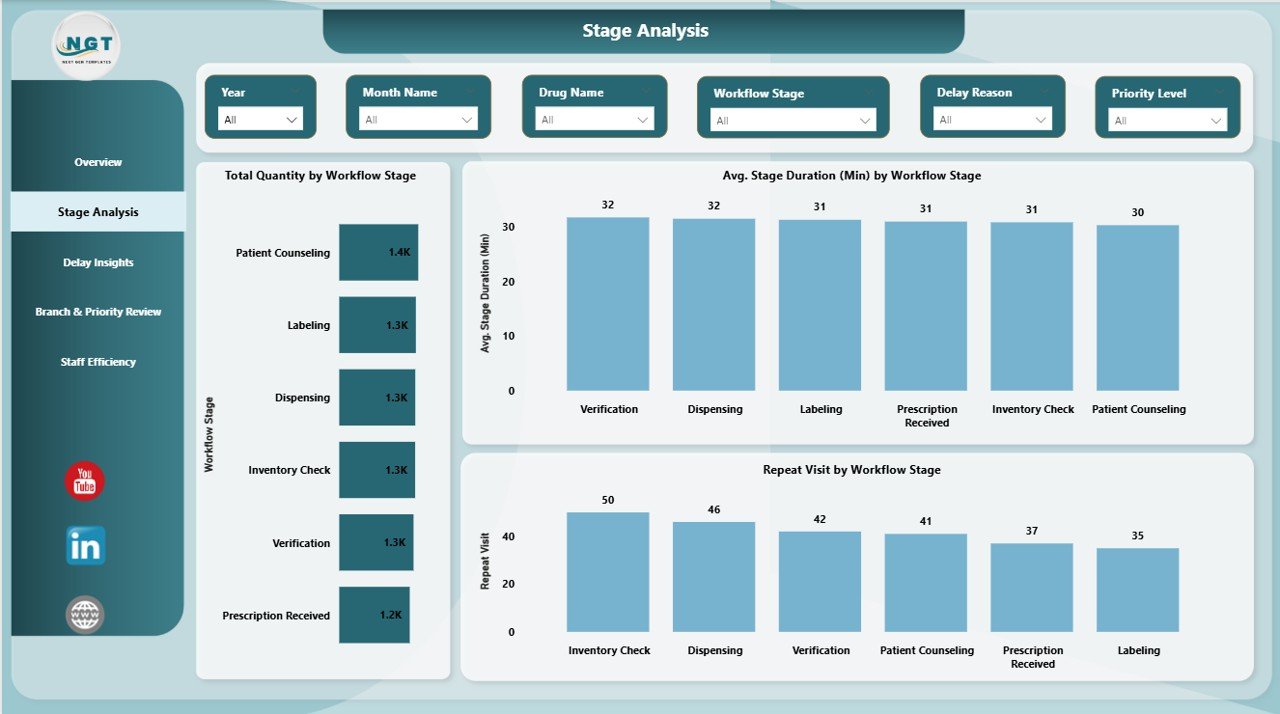
Stage Analysis Page: Which Workflow Stage Causes Delays?
Every pharmacy workflow includes multiple stages such as prescription intake, verification, dispensing, and billing. However, not all stages perform equally.
Insights Available in Stage Analysis
- Total quantity by workflow stage
- Average stage duration by workflow stage
- Repeat visits by workflow stage
This page helps you pinpoint exact stages where delays occur. Therefore, you can redesign processes or allocate more resources to critical stages.
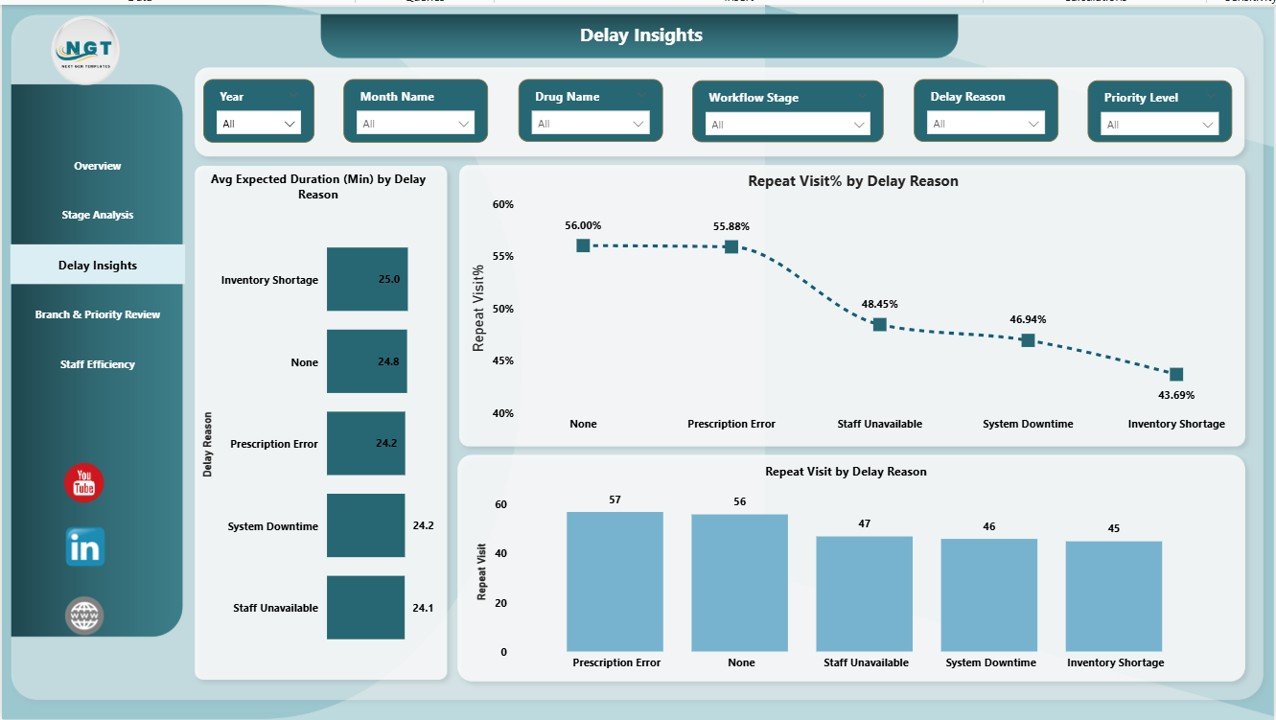
Delay Insights Page: Why Do Delays Occur?
Understanding delays matters more than identifying them. This page focuses on the root causes of workflow delays.
Key Metrics in Delay Insights
- Average expected duration (minutes) by delay reason
- Repeat visit percentage by delay reason
- Repeat visits by delay reason
With this data, pharmacy managers clearly see which delay reasons create the biggest operational impact. Consequently, corrective actions become more focused and effective.
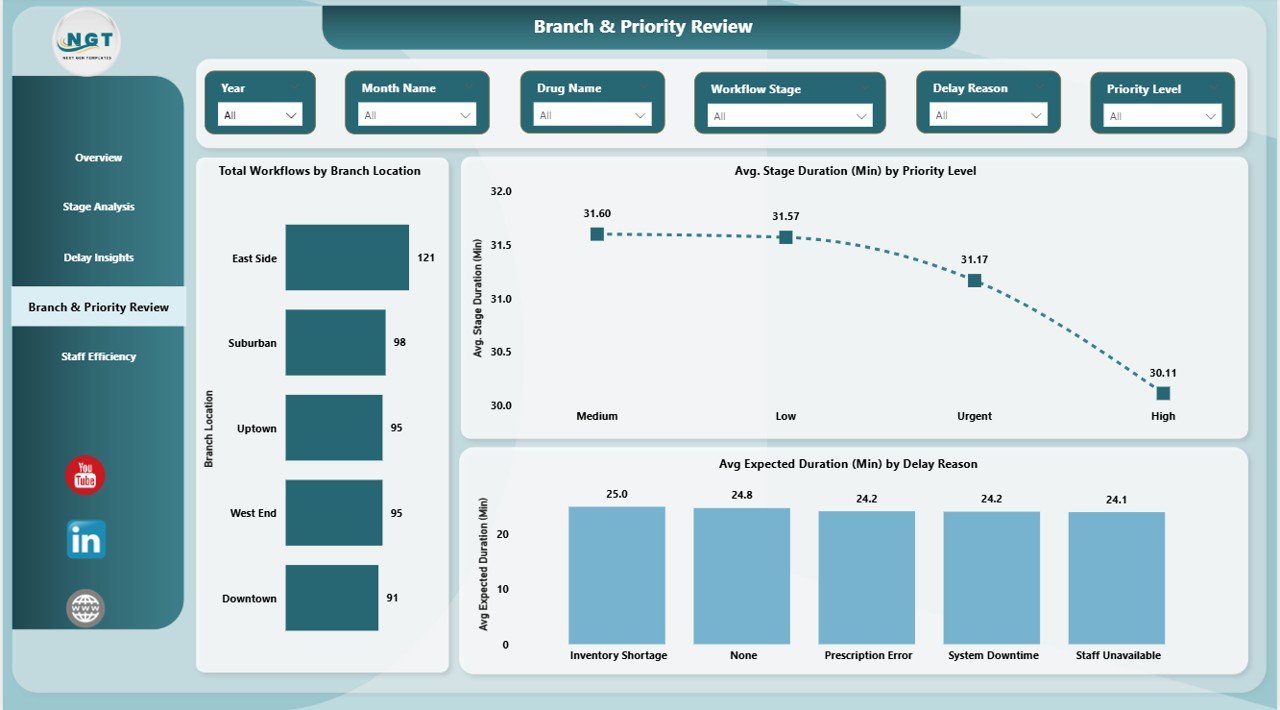
Branch & Priority Review Page: How Do Branches and Priorities Perform?
Not all branches or priority levels perform the same way. This page compares performance across locations and urgency levels.
Key Insights Provided
- Total workflows by branch location
- Average stage duration by priority level
- Average expected duration by delay reason
Because of this analysis, managers can identify underperforming branches and fix priority handling issues quickly.
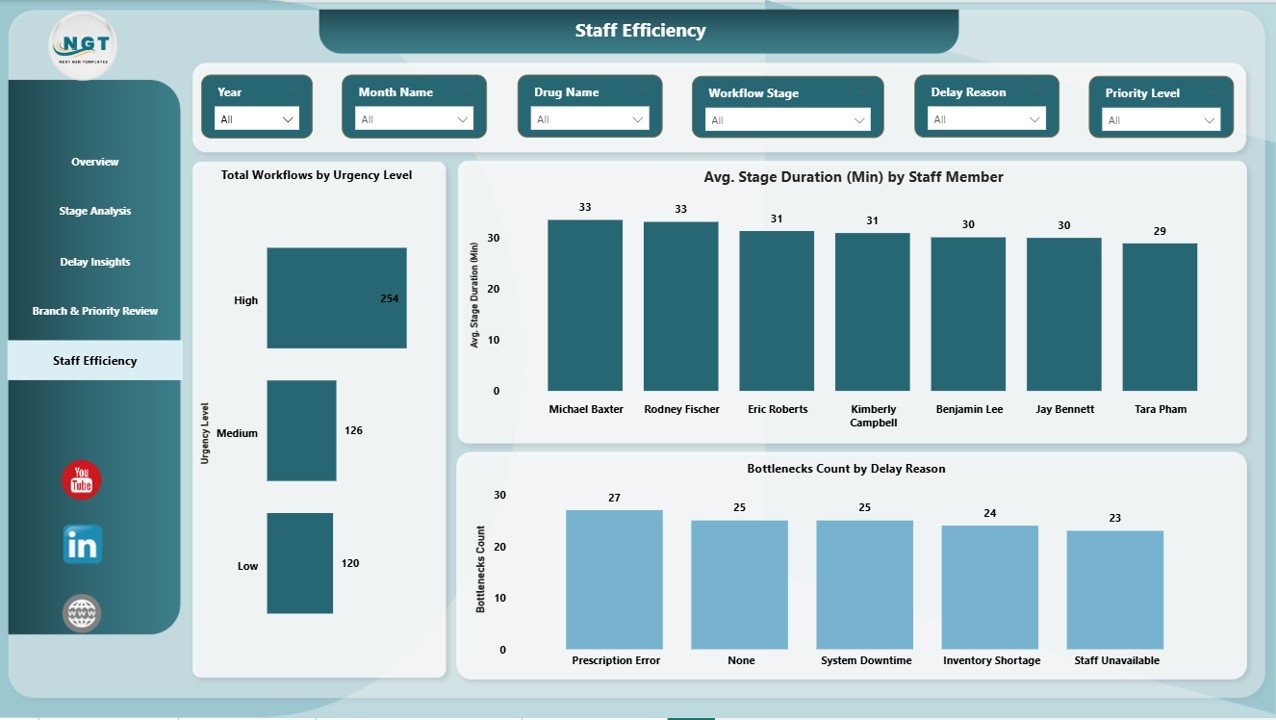
Staff Efficiency Page: Which Team Members Drive Performance?
Staff efficiency directly affects pharmacy workflow speed and quality. Therefore, this page focuses on individual and team performance.
Staff Efficiency Metrics
- Total workflows by urgency level
- Average stage duration by staff member
- Bottlenecks count by delay reason
Using this information, managers can plan training, balance workloads, and improve accountability.
Advantages of Pharmacy Workflow Bottleneck Analysis Dashboard in Power BI
This dashboard delivers clear operational value across pharmacy teams.
- Faster Bottleneck Identification
Instead of manual reviews, you instantly see where workflows slow down. Therefore, response time improves significantly.
- Reduced Patient Wait Time
When bottlenecks disappear, prescriptions move faster. As a result, customer satisfaction improves.
- Better Staff Productivity
Clear visibility into staff performance helps distribute workload efficiently.
- Improved Repeat Visit Control
By tracking repeat visit percentages, pharmacies reduce unnecessary revisits caused by inefficiencies.
- Data-Driven Decision Making
Decisions rely on real data instead of assumptions. Consequently, operational accuracy increases.
- Centralized Workflow Monitoring
All workflow insights remain in one dashboard, which saves time and effort.
How Does This Dashboard Improve Pharmacy Operations?
This dashboard does not just show numbers. Instead, it changes how pharmacies operate daily.
Operational Improvements You Can Expect
- Faster prescription turnaround
- Better delay management
- Balanced staff workload
- Higher customer satisfaction
- Improved compliance and accuracy
Because of these improvements, pharmacies operate more smoothly and profitably.
Best Practices for the Pharmacy Workflow Bottleneck Analysis Dashboard in Power BI
To get maximum value, you must follow proven best practices.
- Keep Data Updated Regularly
Always refresh data daily or weekly. Otherwise, insights lose relevance.
- Standardize Workflow Stages
Ensure all branches follow the same workflow definitions. This improves comparison accuracy.
- Track Delay Reasons Clearly
Use consistent delay reason categories. As a result, root cause analysis becomes easier.
- Monitor Repeat Visits Continuously
Repeat visits signal inefficiencies. Therefore, review this metric frequently.
- Use Filters for Deep Analysis
Apply filters by branch, staff, or time period to uncover hidden patterns.
- Review Dashboard in Team Meetings
Share insights with staff regularly. This builds accountability and ownership.
Who Should Use This Dashboard?
This dashboard suits a wide range of pharmacy stakeholders.
Ideal Users Include
- Pharmacy owners
- Operations managers
- Store managers
- Quality and compliance teams
- Healthcare administrators
Because the dashboard stays simple and visual, both technical and non-technical users benefit.
How Is This Dashboard Better Than Traditional Reports?
Traditional reports show static numbers. However, this dashboard tells a story.
Dashboard vs Traditional Reports
- Interactive vs static
- Real-time insights vs delayed reports
- Visual clarity vs long spreadsheets
- Faster decisions vs manual analysis
Therefore, Power BI dashboards clearly outperform traditional reporting methods.
What Data Is Required for This Dashboard?
You need structured workflow data to power this dashboard.
Common Data Fields Include
- Workflow ID
- Drug name and category
- Workflow stage
- Stage duration
- Delay reason
- Staff member
- Branch location
- Priority and urgency level
- Visit date
Once data exists, Power BI handles the rest.
How Often Should Pharmacies Review This Dashboard?
Regular review maximizes benefits.
Recommended Review Frequency
- Daily for high-volume pharmacies
- Weekly for branch managers
- Monthly for strategic planning
Frequent reviews ensure problems never grow unnoticed.
Conclusion: Why Every Pharmacy Needs a Workflow Bottleneck Dashboard
Pharmacy operations grow more complex every year. Manual tracking no longer works. Without clear visibility, bottlenecks slow workflows, staff struggle, and customers wait longer.
A Pharmacy Workflow Bottleneck Analysis Dashboard in Power BI solves these challenges by providing real-time, visual, and actionable insights. It helps pharmacies reduce delays, improve staff efficiency, control repeat visits, and deliver better service consistently.
If your pharmacy aims to operate smarter, faster, and more efficiently, this dashboard becomes an essential operational tool.
Frequently Asked Questions (FAQs)
What is a Pharmacy Workflow Bottleneck Analysis Dashboard in Power BI?
It is an interactive dashboard that identifies workflow delays, bottlenecks, and inefficiencies across pharmacy operations using Power BI visuals.
Can this dashboard work for multiple pharmacy branches?
Yes, it supports branch-level analysis and comparison across multiple locations.
Does this dashboard help reduce patient wait time?
Absolutely. By identifying delays and bottlenecks, pharmacies improve workflow speed and service quality.
Is Power BI required to use this dashboard?
Yes, Power BI Desktop or Power BI Service is required to view and interact with the dashboard.
Can non-technical staff use this dashboard?
Yes, the dashboard uses simple visuals and filters, which makes it easy for non-technical users.
How often should the data be updated?
Ideally, data should update daily or weekly to maintain accuracy and relevance.
Watch the step-by-step video tutorial:
Visit our YouTube channel to learn step-by-step video tutorials