Internal audit teams play a critical role in protecting organizations from financial risks, compliance failures, and operational inefficiencies. However, when audit data stays scattered across emails, manual registers, or disconnected Excel files, teams lose visibility and control.
That is exactly where an Internal Audit KPI Dashboard in Excel becomes a powerful and practical solution.
In this detailed guide, you will learn what an Internal Audit KPI Dashboard in Excel is, why audit teams need it, how it works, its structure, key features, advantages, best practices, and common questions. By the end of this article, you will clearly understand how this ready-to-use Excel dashboard helps internal audit teams track performance, improve compliance, and support management decisions with confidence.
What Is an Internal Audit KPI Dashboard in Excel?
Click to Purchases Internal Audit KPI Dashboard in Excel
An Internal Audit KPI Dashboard in Excel is a structured and interactive reporting tool designed to track, monitor, and analyze key internal audit performance indicators in one centralized place.
Instead of reviewing multiple audit reports manually, audit managers and leadership teams can view all important KPIs on a single dashboard. As a result, they gain instant insights into audit performance, target achievement, and year-over-year progress.
Because Excel powers this dashboard, teams can easily customize KPIs, update data monthly, and share reports with stakeholders without relying on complex software or expensive BI tools.
Why Do Internal Audit Teams Need a KPI Dashboard?
Internal audit functions operate under strict timelines, regulatory expectations, and management scrutiny. Therefore, tracking performance manually creates unnecessary risks.
An Internal Audit KPI Dashboard in Excel solves these challenges because it helps teams:
-
Monitor audit performance consistently
-
Compare actual results against targets
-
Track month-to-date (MTD) and year-to-date (YTD) progress
-
Identify compliance gaps early
-
Improve accountability and transparency
-
Support audit committee and management reviews
Moreover, Excel dashboards remain easy to use, widely accepted, and cost-effective, which makes them ideal for internal audit teams of all sizes.
How Does an Internal Audit KPI Dashboard in Excel Work?
The dashboard works by connecting structured KPI definitions with monthly actual, target, and previous-year data. Once users enter data into the input sheets, Excel automatically updates all calculations, charts, and indicators.
As a result, audit managers can instantly analyze performance by month, KPI, or time period without manual effort.
This dashboard focuses on clarity, accuracy, and ease of use, which ensures that audit insights remain actionable and reliable.
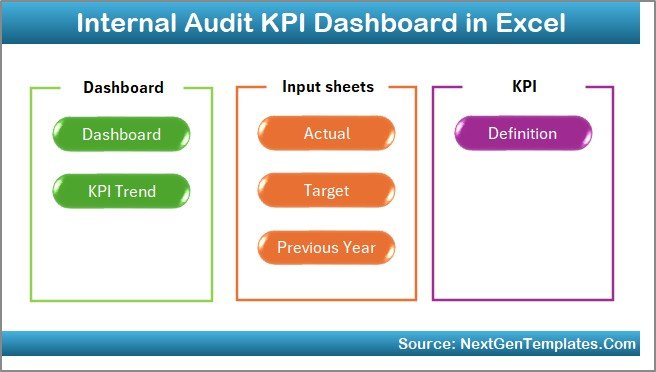
Structure of the Internal Audit KPI Dashboard in Excel
This ready-to-use Internal Audit KPI Dashboard in Excel contains 7 well-organized worksheets, each designed for a specific purpose. Together, these sheets create a complete audit performance tracking system.
1. Home Sheet – Central Navigation Hub
The Home sheet works as the index page of the dashboard.
Key Highlights of the Home Sheet:
-
Acts as a landing page for users
-
Contains 6 navigation buttons
-
Allows quick movement to each worksheet
-
Improves user experience and usability
Because of this design, even non-technical users can navigate the dashboard smoothly.
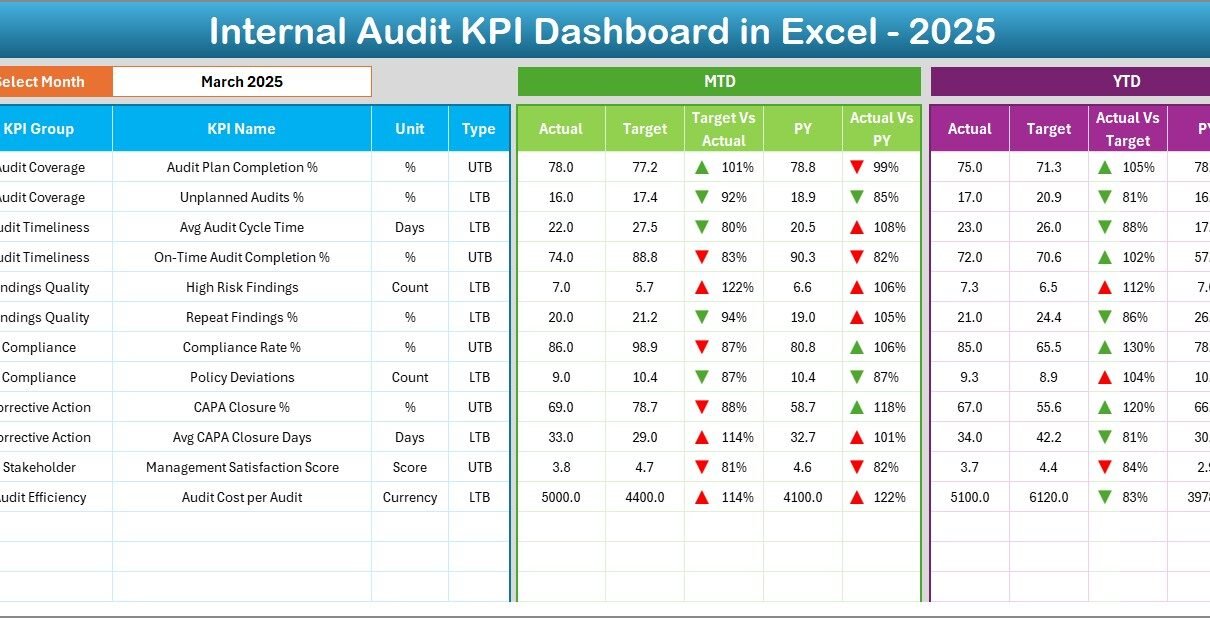
2. Dashboard Sheet – Complete KPI Overview
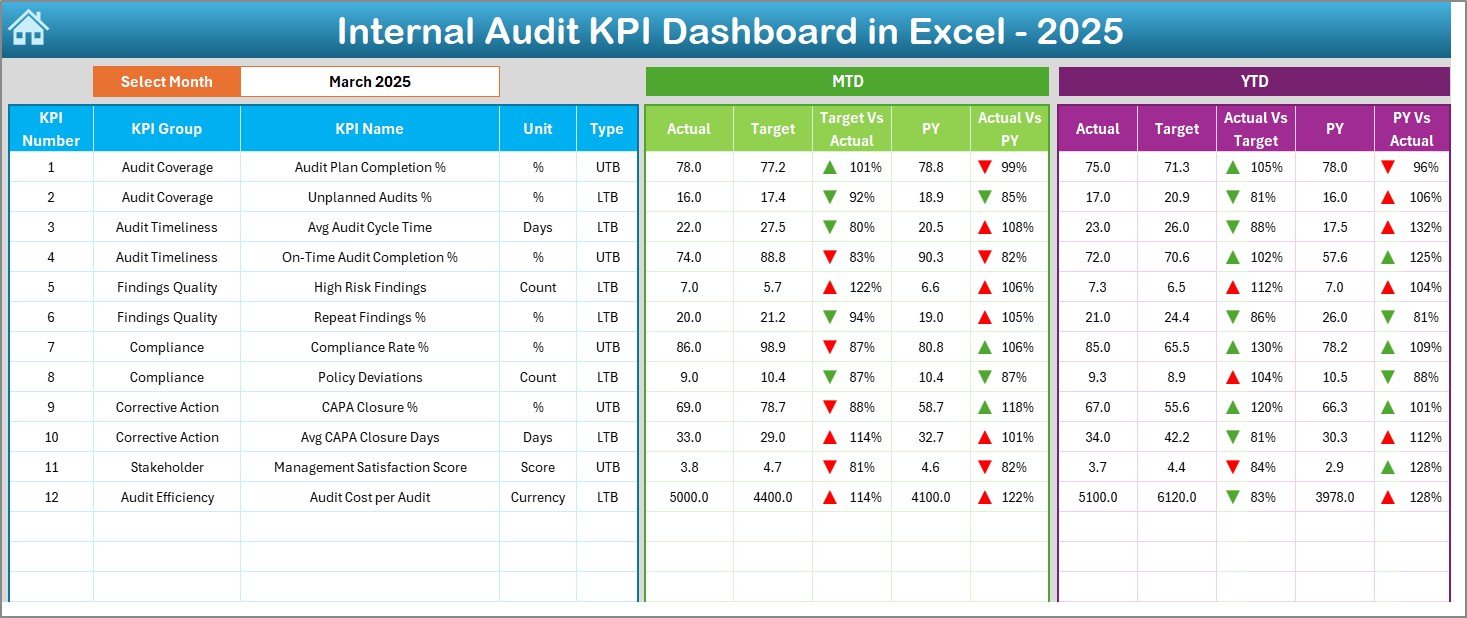
The Dashboard sheet serves as the main analytical page of the entire file.
What Does the Dashboard Sheet Show?
On this sheet, you can view all KPIs at a glance with powerful comparisons and visual indicators.
Month Selection:
-
Select the month from the drop-down in cell D3
-
The entire dashboard updates automatically for the selected month
Key Metrics Displayed:
-
MTD Actual
-
MTD Target
-
MTD Previous Year (PY)
-
Target vs Actual comparison
-
PY vs Actual comparison
Additionally, the dashboard shows:
-
YTD Actual
-
YTD Target
-
YTD Previous Year
-
Target vs Actual (YTD)
-
PY vs Actual (YTD)
Visual Indicators:
-
Conditional formatting with up and down arrows
-
Instant visibility of performance status
-
Faster identification of gaps and improvements
Because of this structure, audit managers can quickly understand where performance meets expectations and where corrective action is required.
3. KPI Trend Sheet – Deep KPI-Level Analysis
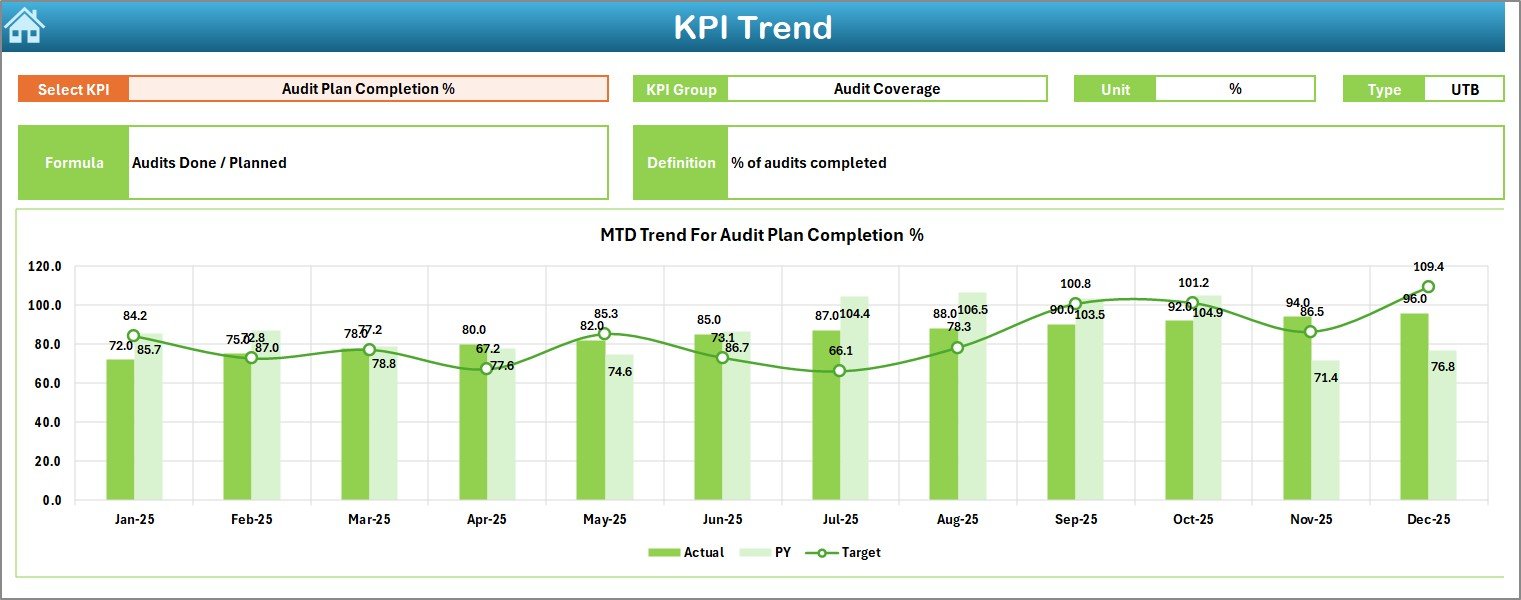
The KPI Trend sheet focuses on detailed analysis for a single KPI.
How Does the KPI Trend Sheet Work?
-
Select the KPI name from the drop-down in cell C3
-
The sheet automatically displays detailed information related to that KPI
Information Displayed:
-
KPI Group
-
Unit of Measurement
-
KPI Type (Lower the Better or Upper the Better)
-
KPI Formula
-
KPI Definition
Trend Analysis:
-
MTD trend chart for Actual, Target, and PY
-
YTD trend chart for Actual, Target, and PY
Because of these trend charts, audit teams can identify performance patterns, recurring issues, and long-term improvement areas.
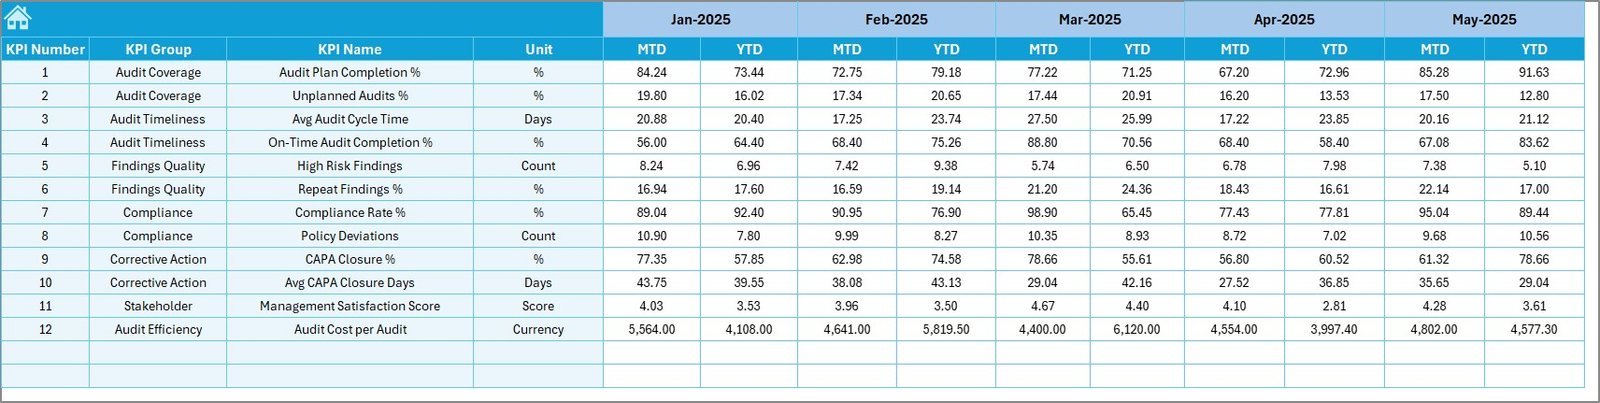
4. Actual Numbers Input Sheet – Data Entry for Current Year
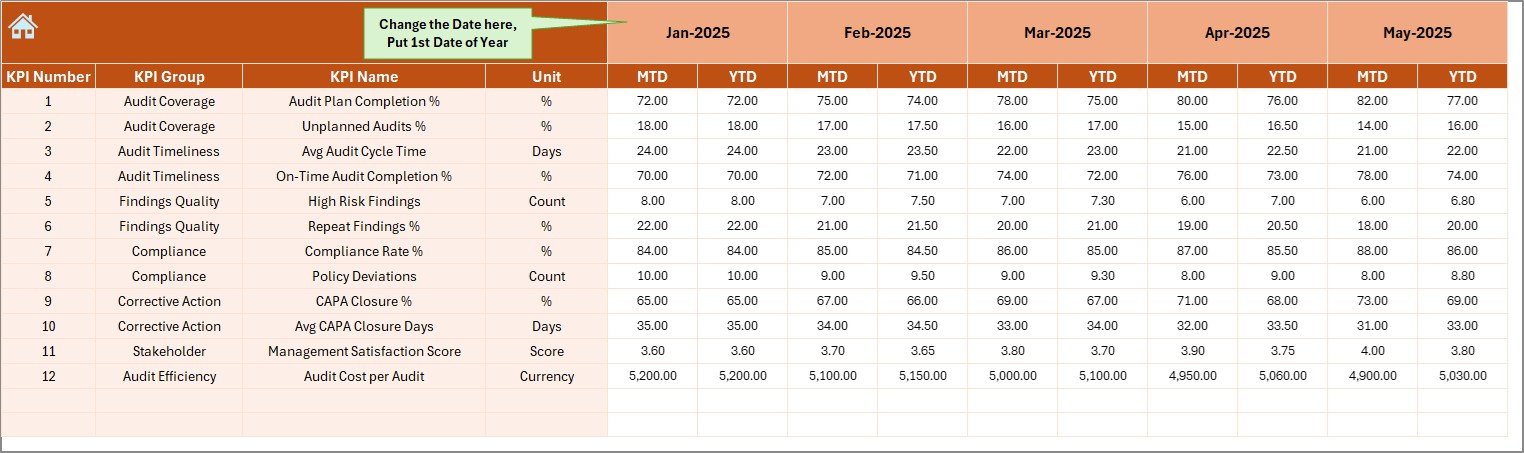
The Actual Numbers Input sheet allows users to enter actual audit performance data.
How to Use This Sheet:
-
Enter MTD and YTD actual values for each KPI
-
Change the reporting month using cell E1
-
Enter the first month of the financial year in cell E1
Once users update this data, the dashboard automatically reflects the changes.
As a result, teams save time and avoid manual recalculations.
Click to Purchases Internal Audit KPI Dashboard in Excel
5. Target Sheet – Define Performance Expectations
The Target sheet stores the planned or expected performance values for each KPI.
Key Functions:
-
Enter MTD target values
-
Enter YTD target values
-
Maintain consistent benchmarks across months
Because targets drive performance evaluation, this sheet ensures alignment between audit goals and actual outcomes.
6. Previous Year Number Sheet – Year-on-Year Comparison
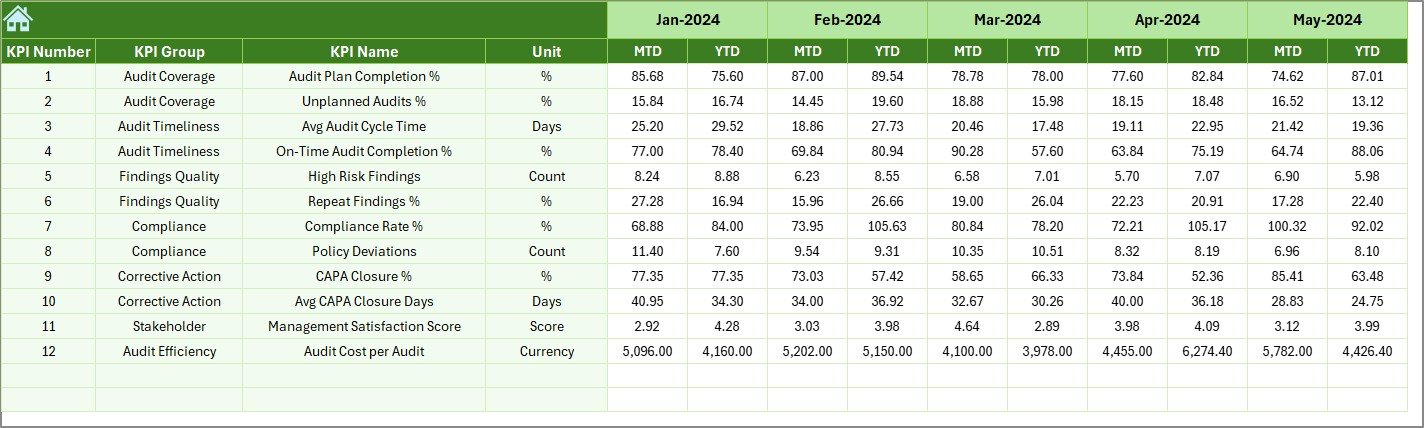
The Previous Year Number sheet captures historical audit performance data.
Why Is This Sheet Important?
-
Enables year-over-year comparison
-
Helps identify long-term performance trends
-
Supports audit committee discussions
-
Improves strategic audit planning
Users enter data in the same structure as the current year, which ensures accurate comparisons.
7. KPI Definition Sheet – Central KPI Repository
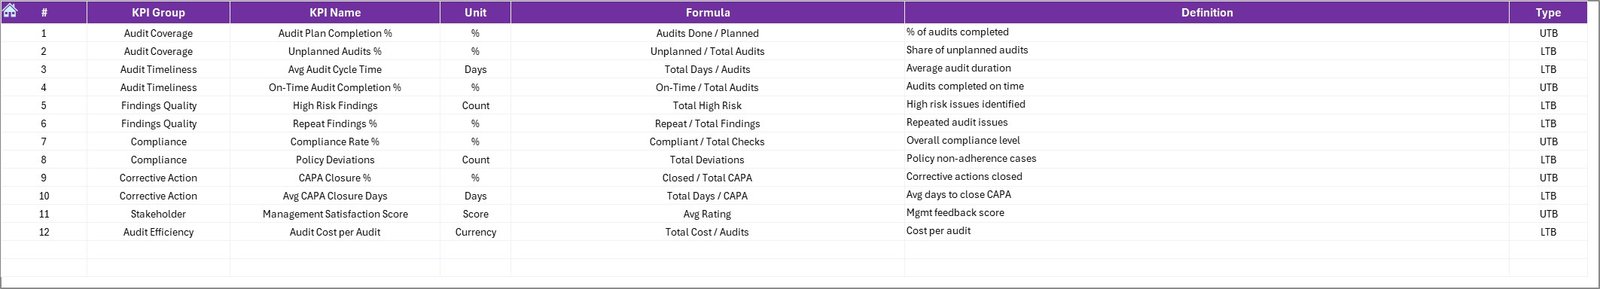
The KPI Definition sheet acts as the backbone of the dashboard.
Information Stored:
-
KPI Name
-
KPI Group
-
Unit of Measurement
-
KPI Formula
-
KPI Definition
Because all KPI logic stays centralized, the dashboard remains consistent, auditable, and easy to maintain.
Advantages of an Internal Audit KPI Dashboard in Excel
Using an Internal Audit KPI Dashboard in Excel offers multiple practical benefits.
1. Centralized Audit Performance Tracking
All KPIs stay in one place, which eliminates confusion and duplication.
2. Faster Decision-Making
Real-time calculations and visual indicators help management act quickly.
3. Improved Audit Transparency
Clear metrics improve communication with stakeholders and audit committees.
4. Better Compliance Monitoring
Teams can identify risks and gaps early, which reduces compliance issues.
Click to Purchases Internal Audit KPI Dashboard in Excel
5. Easy Customization
Excel allows users to add, modify, or remove KPIs without technical support.
6. Cost-Effective Solution
Excel dashboards avoid expensive BI tools while delivering powerful insights.
How Does This Dashboard Improve Internal Audit Effectiveness?
This dashboard transforms raw audit data into meaningful insights.
Because of structured KPI tracking:
-
Audit teams improve accountability
-
Management gains confidence in reporting
-
Risk exposure reduces over time
-
Continuous improvement becomes measurable
As a result, internal audit functions move from reactive reporting to proactive performance management.
Best Practices for the Internal Audit KPI Dashboard in Excel
To get the maximum value from your dashboard, follow these best practices.
1. Define Clear and Relevant KPIs
Select KPIs that align with audit objectives, risk priorities, and compliance requirements.
2. Maintain Consistent Data Entry
Update actual, target, and PY data monthly without delays.
3. Review Trends, Not Just Numbers
Use the KPI Trend sheet to understand performance patterns, not only monthly results.
4. Use Conditional Formatting Wisely
Rely on visual indicators to highlight risks and achievements clearly.
5. Keep KPI Definitions Updated
Ensure formulas and definitions stay accurate and aligned with audit standards.
6. Share Insights with Stakeholders
Use dashboard outputs during management and audit committee meetings.
Who Should Use an Internal Audit KPI Dashboard in Excel?
This dashboard suits a wide range of users, including:
-
Internal Audit Managers
-
Audit Executives
-
Compliance Teams
-
Risk Management Teams
-
CFOs and Finance Leaders
-
Audit Committees
Because Excel remains universally accepted, both technical and non-technical users can benefit from this dashboard.
Conclusion
An Internal Audit KPI Dashboard in Excel provides a simple yet powerful way to monitor audit performance, ensure compliance, and support data-driven decisions. By combining structured KPI definitions, automated calculations, trend analysis, and visual indicators, this dashboard turns complex audit data into clear and actionable insights.
Moreover, its flexible Excel-based design allows audit teams to customize, update, and scale the dashboard as organizational needs evolve. As a result, internal audit functions gain stronger control, better transparency, and improved strategic value.
If your audit team wants to move beyond manual reporting and gain real-time visibility, this Internal Audit KPI Dashboard in Excel serves as an ideal solution.
Frequently Asked Questions (FAQs)
What is the main purpose of an Internal Audit KPI Dashboard in Excel?
The dashboard helps track, analyze, and report internal audit performance using structured KPIs in Excel.
Can non-technical users operate this dashboard?
Yes, the dashboard uses simple data entry and navigation buttons, which makes it easy for all users.
How often should audit data be updated?
Audit teams should update data monthly to maintain accuracy and relevance.
Can I add or remove KPIs from the dashboard?
Yes, users can modify KPIs easily through the KPI Definition and input sheets.
Does this dashboard support year-over-year analysis?
Yes, the Previous Year Number sheet enables accurate year-on-year comparisons.
Is this dashboard suitable for large organizations?
Yes, the dashboard scales well for small, medium, and large audit functions.
Visit our YouTube channel to learn step-by-step video tutorials