Sustainability has moved from a “good-to-have” initiative to a business-critical responsibility. Today, organizations across industries focus on reducing environmental impact, improving social responsibility, and strengthening governance practices. However, many sustainability offices still struggle with scattered data, manual reports, and delayed insights.
That is exactly where a Sustainability Office KPI Dashboard in Excel creates real value.
In this detailed and practical article, you will learn what a Sustainability Office KPI Dashboard in Excel is, why it matters, how it works, its worksheet-wise structure, key use cases, advantages, best practices, and frequently asked questions. By the end of this guide, you will clearly understand how this ready-to-use Excel dashboard helps sustainability teams monitor performance, improve accountability, and drive measurable impact.
Click to Purchases Sustainability Office KPI Dashboard in Excel
What Is a Sustainability Office KPI Dashboard in Excel?
A Sustainability Office KPI Dashboard in Excel is a structured and visual performance management tool designed to track, analyze, and report sustainability-related key performance indicators (KPIs).
Instead of relying on multiple spreadsheets, emails, or manual reports, this dashboard brings all sustainability KPIs into one centralized and interactive Excel file. As a result, sustainability managers gain instant clarity on performance trends, target achievement, and improvement areas.
Moreover, Excel makes this dashboard cost-effective, flexible, and easy to update, even for non-technical users.
Why Does a Sustainability Office Need a KPI Dashboard?
Sustainability initiatives involve multiple dimensions such as environmental impact, energy usage, waste management, compliance, and social responsibility. However, without proper tracking, these initiatives lose direction.
A Sustainability Office KPI Dashboard in Excel helps because:
-
It converts raw sustainability data into actionable insights
-
It improves transparency and accountability
-
It enables monthly, YTD, and year-over-year comparisons
-
It supports data-driven sustainability decisions
-
It simplifies internal and external reporting
Therefore, organizations that use a KPI dashboard always stay ahead in sustainability performance management.
How Does a Sustainability Office KPI Dashboard in Excel Work?
The dashboard works on a simple yet powerful logic.
First, you define sustainability KPIs and targets.
Next, you enter actual and previous year values.
Then, Excel formulas, charts, and conditional formatting automatically calculate performance.
As a result, decision-makers can instantly see:
-
Which KPIs meet targets
-
Which KPIs fall behind
-
How performance changes month-over-month
-
How current performance compares with the previous year
-
Click to Purchases Sustainability Office KPI Dashboard in Excel
What Are the Key Features of a Sustainability Office KPI Dashboard in Excel?
This ready-to-use Sustainability Office KPI Dashboard in Excel comes with a structured worksheet design that ensures clarity, accuracy, and ease of use.
Below is the worksheet-wise explanation.
1. Home Sheet: How Does the Navigation Work?
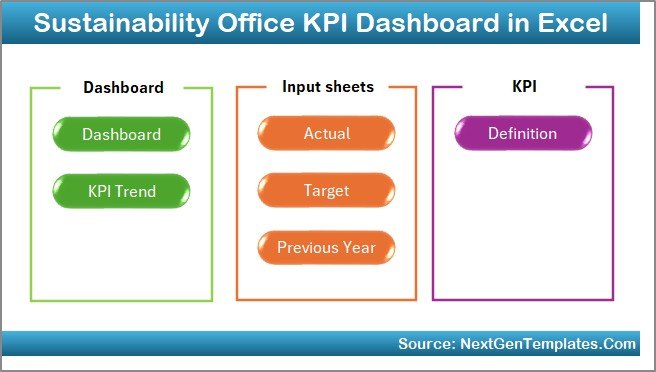
The Home sheet works as an index page for the dashboard.
Key Highlights:
-
Clean and professional layout
-
6 navigation buttons to jump to different sheets
-
Saves time by eliminating manual scrolling
Because of this structure, users can access any section of the dashboard in a single click.
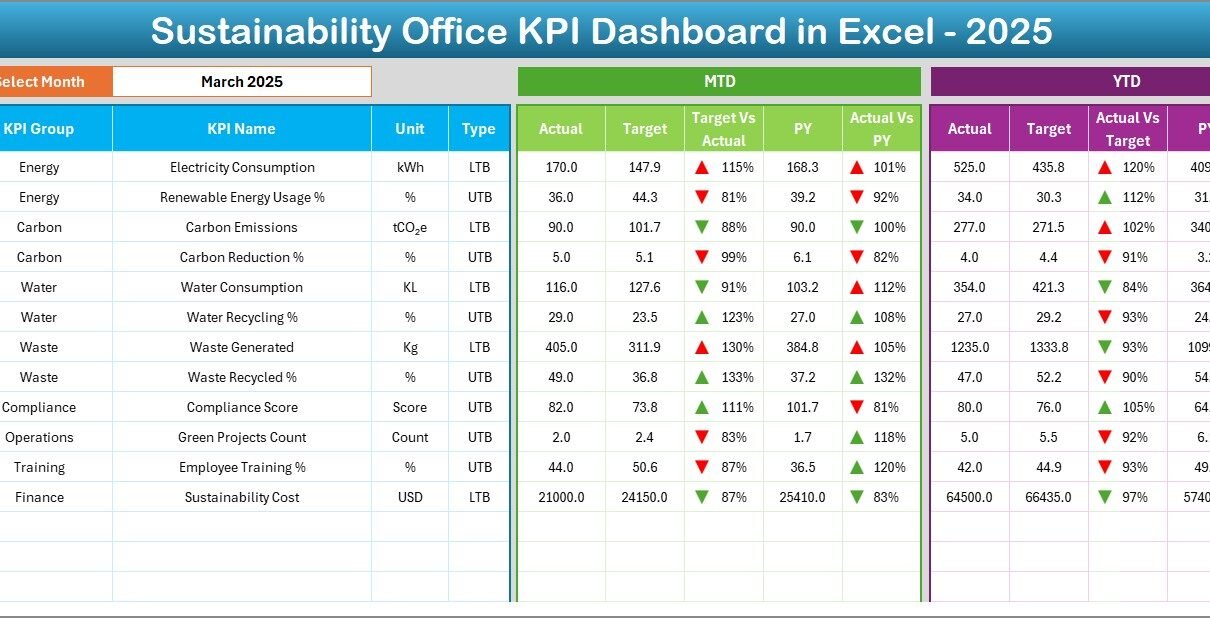
2. Dashboard Sheet: What Insights Does the Main Dashboard Show?
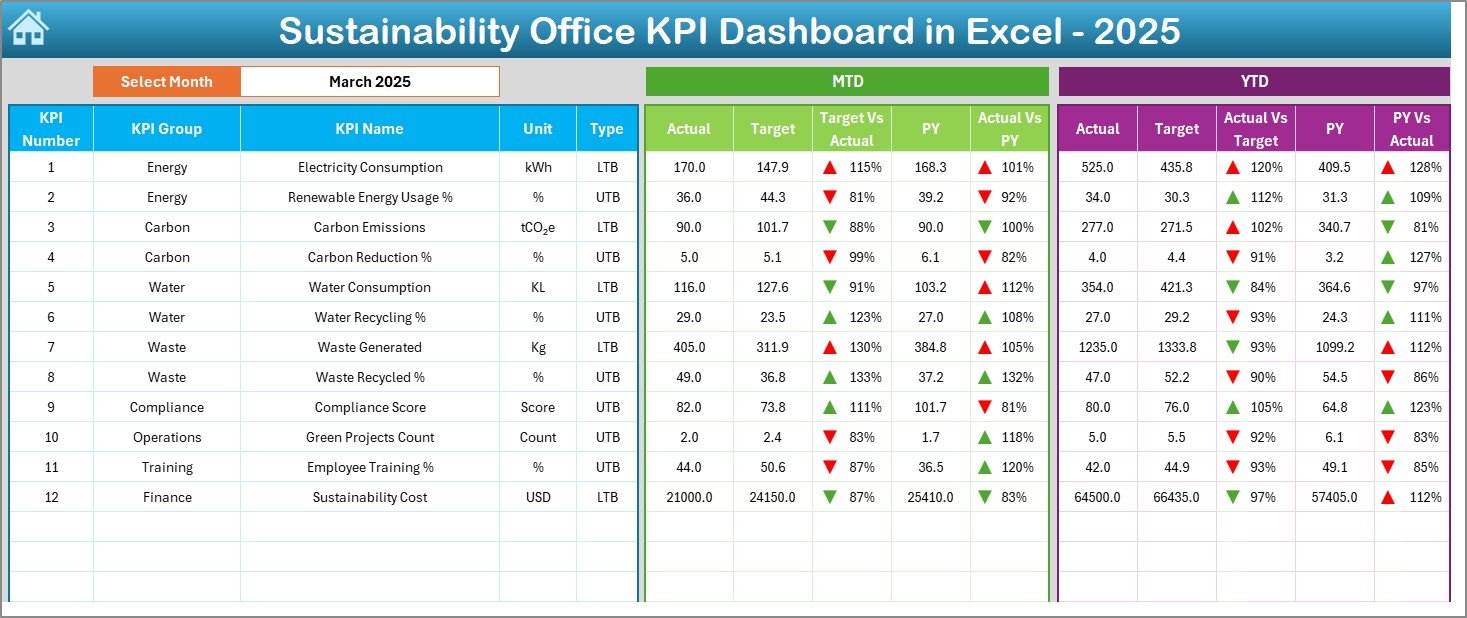
The Dashboard sheet is the heart of the Sustainability Office KPI Dashboard in Excel.
Key Features:
-
Month selection using a drop-down at cell D3
-
Automatic update of all KPIs based on the selected month
-
Clear comparison of:
-
MTD Actual vs Target
-
MTD Actual vs Previous Year
-
YTD Actual vs Target
-
YTD Actual vs Previous Year
-
Visual Enhancements:
-
Conditional formatting with up and down arrows
-
Easy-to-read KPI performance indicators
-
Clear separation between MTD and YTD views
As a result, sustainability managers can immediately understand performance status without reading long reports.
3. KPI Trend Sheet: How Can You Analyze KPI Performance Over Time?
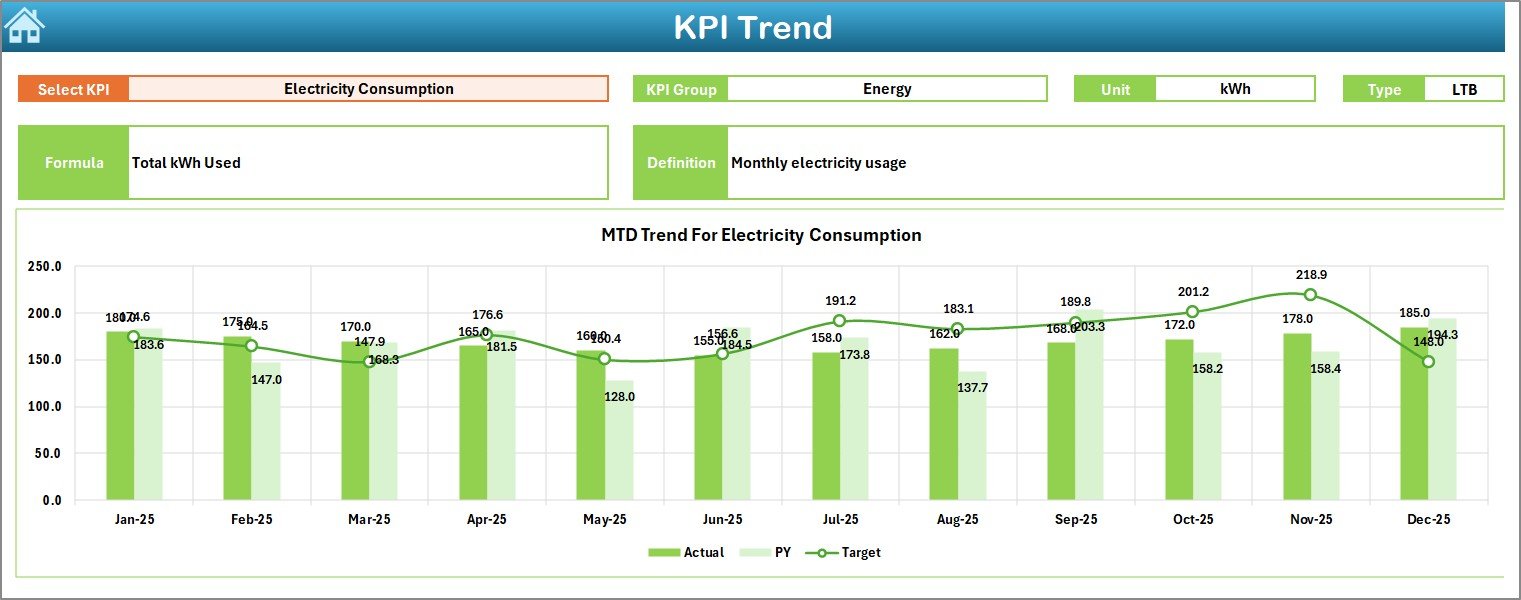
The KPI Trend sheet focuses on deep KPI-level analysis.
How It Works:
-
Select a KPI name from the drop-down at cell C3
-
Automatically display:
-
KPI Group
-
KPI Unit
-
KPI Type (Lower the Better or Upper the Better)
-
KPI Formula
-
KPI Definition
-
Trend Analysis:
-
MTD trend chart for Actual, Target, and Previous Year
-
YTD trend chart for Actual, Target, and Previous Year
Because of these trend visuals, sustainability teams can easily identify patterns, risks, and improvement opportunities.
Click to Purchases Sustainability Office KPI Dashboard in Excel
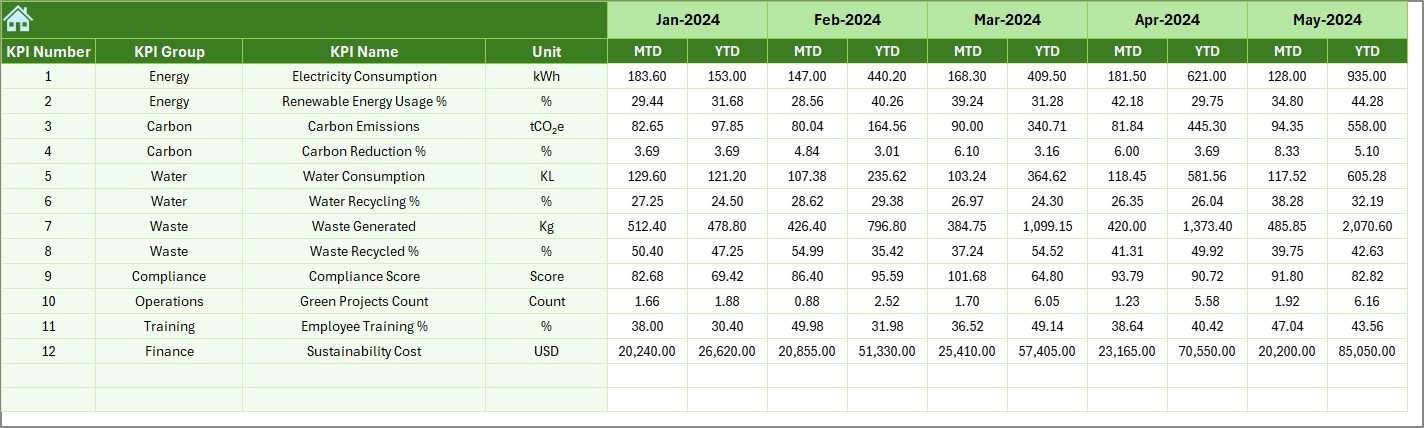
4. Actual Numbers Input Sheet: Where Do You Enter Current Data?
The Actual Numbers Input sheet is where users enter current-year sustainability data.
Key Features:
-
Input fields for MTD and YTD actual values
-
Month selection using cell E1
-
Automatic alignment with dashboard calculations
This structured input approach reduces data entry errors and ensures consistency across reports.
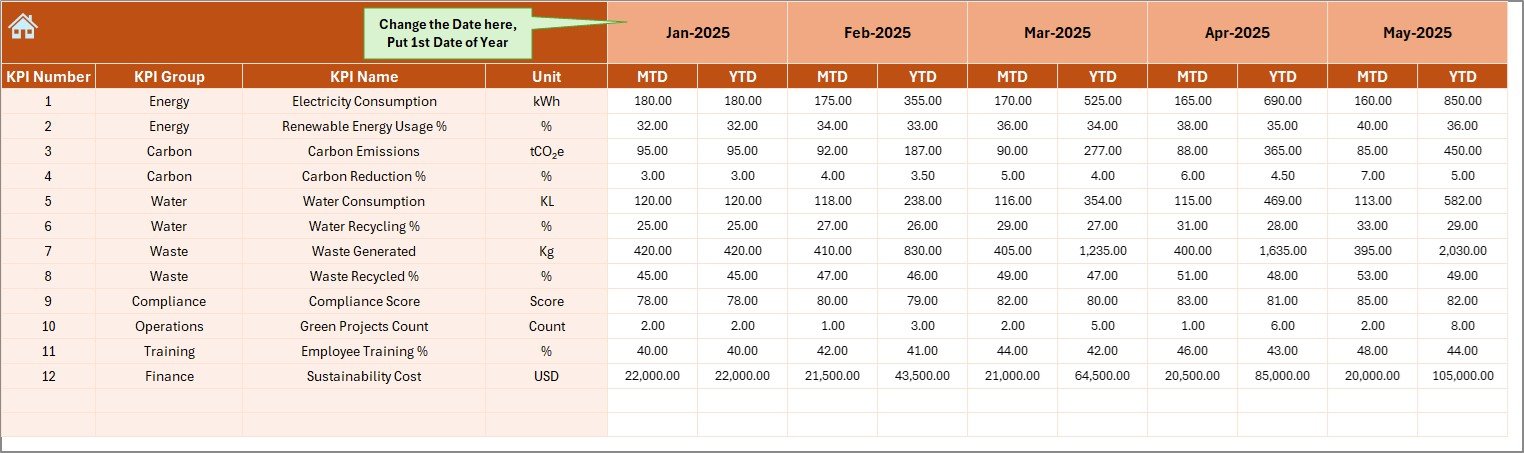
5. Target Sheet: How Do You Set Sustainability Goals?
The Target Sheet stores monthly and yearly sustainability targets.
What You Enter Here:
-
KPI-wise MTD targets
-
KPI-wise YTD targets
Since targets directly feed the dashboard, teams can easily track progress against sustainability commitments.
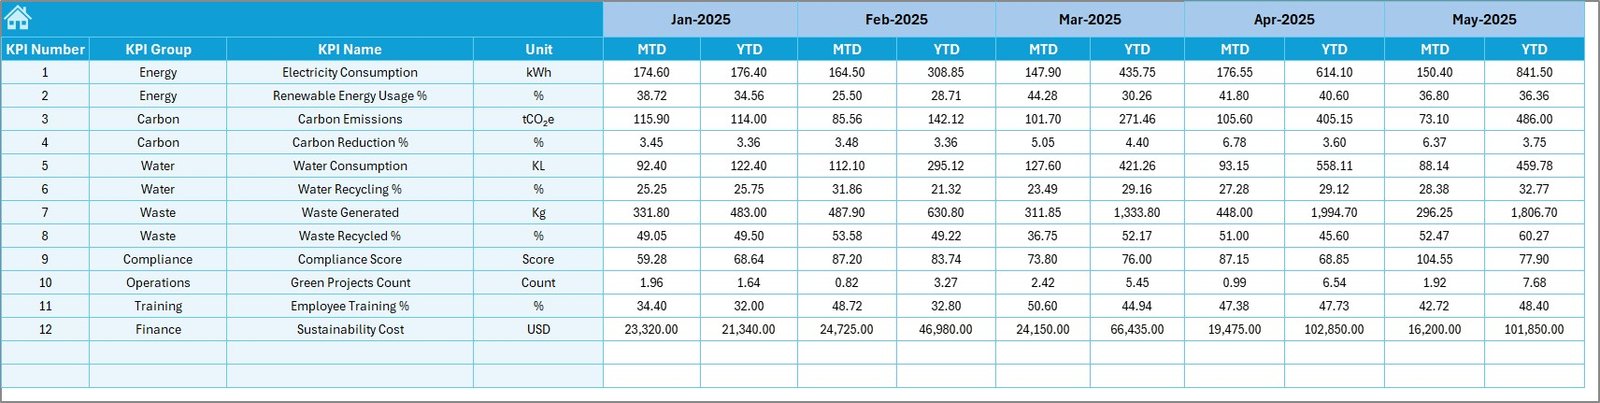
6. Previous Year Number Sheet: Why Is Historical Comparison Important?
The Previous Year Number sheet captures sustainability data from the prior year.
Benefits:
-
Enables year-over-year performance comparison
-
Helps identify long-term sustainability trends
-
Supports regulatory and ESG reporting requirements
Because historical data plays a key role in sustainability evaluation, this sheet adds strong analytical depth.
7. KPI Definition Sheet: How Do You Standardize KPIs?
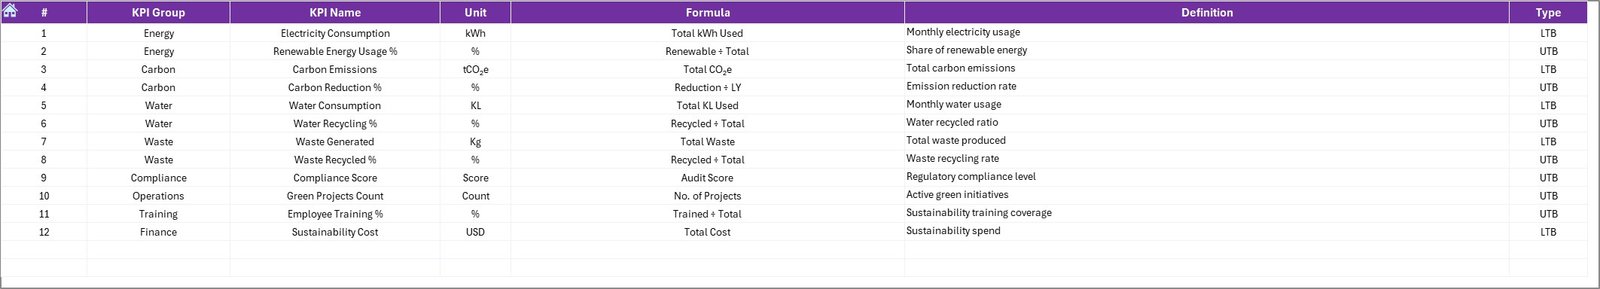
The KPI Definition sheet ensures consistency and clarity across the organization.
Key Fields:
-
KPI Name
-
KPI Group
-
Unit of Measurement
-
KPI Formula
-
KPI Definition
This sheet acts as a single source of truth for sustainability KPIs.
What Types of KPIs Can You Track in a Sustainability Office KPI Dashboard?
A Sustainability Office KPI Dashboard in Excel supports a wide range of KPIs, such as:
-
Energy consumption per unit
-
Carbon emissions reduction
-
Waste recycling rate
-
Water usage efficiency
-
Renewable energy usage %
-
Compliance audit score
-
Sustainability training coverage
-
Supplier sustainability rating
Because Excel is flexible, you can easily customize KPIs based on organizational goals.
Advantages of Sustainability Office KPI Dashboard in Excel
Using a Sustainability Office KPI Dashboard in Excel offers multiple advantages.
1. Centralized Sustainability Data
All sustainability KPIs stay in one structured file, which improves visibility and control.
2. Easy to Use and Update
Excel familiarity ensures quick adoption across teams without technical barriers.
3. Real-Time Performance Monitoring
Monthly selections instantly update performance metrics.
4. Clear Target vs Actual Comparison
Conditional formatting highlights gaps and achievements clearly.
5. Cost-Effective Solution
No expensive software or licenses are required.
6. Improved Decision-Making
Visual insights support faster and more confident sustainability decisions.
How Does This Dashboard Support ESG and Compliance Reporting?
Sustainability reporting often requires accurate, consistent, and well-documented data.
This dashboard supports ESG and compliance by:
-
Maintaining KPI definitions in one place
-
Tracking historical performance
-
Providing structured monthly and YTD reports
-
Supporting audit readiness with transparent data flow
As a result, organizations can respond confidently to stakeholder and regulatory requirements.
Best Practices for the Sustainability Office KPI Dashboard in Excel
To get maximum value, follow these best practices.
1. Define Clear KPIs
Always align KPIs with sustainability goals and regulatory requirements.
2. Update Data Regularly
Enter actual values monthly to maintain data accuracy.
3. Validate Input Data
Review numbers before finalizing monthly reports.
4. Use Consistent Units
Ensure uniform measurement units across all KPIs.
5. Review Trends, Not Just Numbers
Analyze trends to identify long-term sustainability improvement areas.
6. Train Users
Educate team members on data entry and dashboard interpretation.
Click to Purchases Sustainability Office KPI Dashboard in Excel
Who Should Use a Sustainability Office KPI Dashboard in Excel?
This dashboard works best for:
-
Sustainability officers
-
ESG managers
-
Environmental compliance teams
-
Corporate responsibility teams
-
Operations and facility managers
-
Senior leadership teams
Because of its flexibility, both small and large organizations can benefit from it.
How Can This Dashboard Improve Sustainability Strategy?
A Sustainability Office KPI Dashboard in Excel turns sustainability into a measurable and manageable function.
It helps teams:
-
Track progress clearly
-
Identify gaps early
-
Align actions with targets
-
Communicate results effectively
Therefore, sustainability initiatives become proactive instead of reactive.
Conclusion: Why Should You Use a Sustainability Office KPI Dashboard in Excel?
A Sustainability Office KPI Dashboard in Excel provides a simple yet powerful way to manage sustainability performance. It combines structured data input, visual analysis, trend tracking, and standardized KPIs in one ready-to-use file.
Instead of struggling with scattered reports, sustainability teams gain clarity, control, and confidence. As a result, organizations can drive meaningful sustainability outcomes while meeting compliance and stakeholder expectations.
Frequently Asked Questions (FAQs)
What is a Sustainability Office KPI Dashboard in Excel used for?
It helps track, analyze, and report sustainability KPIs such as energy, emissions, waste, and compliance performance.
Can non-technical users use this dashboard?
Yes, the dashboard uses simple Excel features and structured input sheets, which makes it easy for non-technical users.
Does the dashboard support monthly and yearly analysis?
Yes, it supports MTD, YTD, and previous year comparisons.
Can I customize KPIs in the dashboard?
Yes, you can easily modify KPIs using the KPI Definition sheet.
Is this dashboard suitable for ESG reporting?
Yes, it supports ESG reporting through structured data, KPI definitions, and historical tracking.
Do I need advanced Excel skills to maintain it?
No, basic Excel knowledge is enough to update and use the dashboard effectively.
Visit our YouTube channel to learn step-by-step video tutorials