Managing private equity investments demands clarity, accuracy, and speed. However, many private equity firms still rely on scattered spreadsheets, manual reports, and delayed MIS files. As a result, tracking fund performance, valuations, ownership, and returns becomes slow and error-prone.
That is exactly where a Private Equity Dashboard in Excel creates real value.
In this detailed and practical article, you will learn what a Private Equity Dashboard in Excel is, why it matters, how it works, its page-wise structure, key features, advantages, best practices, and frequently asked questions. By the end of this guide, you will clearly understand how this ready-to-use Excel dashboard helps private equity professionals monitor investments and make confident decisions.
Click to Purchases Private Equity Dashboard in Excel
What Is a Private Equity Dashboard in Excel?
A Private Equity Dashboard in Excel is a structured, visual, and interactive reporting tool designed to track key private equity metrics such as invested amount, current valuation, ownership percentage, IRR, MOIC, and exit status.
Instead of reviewing multiple sheets or long reports, this dashboard displays all critical investment information in one place. Moreover, it uses Excel’s built-in features such as slicers, charts, formulas, and conditional formatting to present data clearly.
As a result, fund managers, analysts, and investment teams gain instant insights into portfolio performance without relying on complex tools.
Why Do Private Equity Firms Need a Dashboard in Excel?
Private equity firms manage multiple funds, industries, regions, and investment stages. Therefore, they need a consolidated view of performance.
Without a dashboard:
-
Teams waste time compiling reports
-
Data inconsistencies increase
-
Decision-making slows down
-
Performance trends remain hidden
However, a Private Equity Dashboard in Excel solves these challenges by centralizing data and automating analysis. Additionally, Excel remains flexible, widely used, and easy to update.
How Does a Private Equity Dashboard in Excel Work?
A Private Equity Dashboard in Excel works on a simple yet powerful flow:
-
Data Input
You capture investment data in structured data sheets. -
Data Processing
Excel formulas and pivot tables calculate KPIs like IRR, MOIC, valuation, and ownership. -
Interactive Analysis
Slicers allow users to filter data by fund, region, industry, investment stage, or month. -
Visual Reporting
Charts and KPI cards display trends and comparisons instantly.
Because of this flow, users can analyze performance dynamically without modifying raw data.
What Are the Key Features of a Private Equity Dashboard in Excel?
This ready-to-use Private Equity Dashboard in Excel comes with several powerful features designed for professional use.
Page Navigator for Easy Navigation
The dashboard includes a Page Navigator located on the left side. This feature allows users to move seamlessly between pages with a single click. As a result, navigation becomes fast and intuitive.
Right-Side Slicers for Dynamic Filtering
Each analytical page contains right-side slicers. These slicers allow users to filter data by relevant dimensions such as fund name, industry, region, investment stage, or month. Therefore, analysis becomes interactive and flexible.
What Pages Are Included in the Private Equity Dashboard in Excel?
This dashboard consists of five structured analytical pages, each focusing on a specific performance dimension.
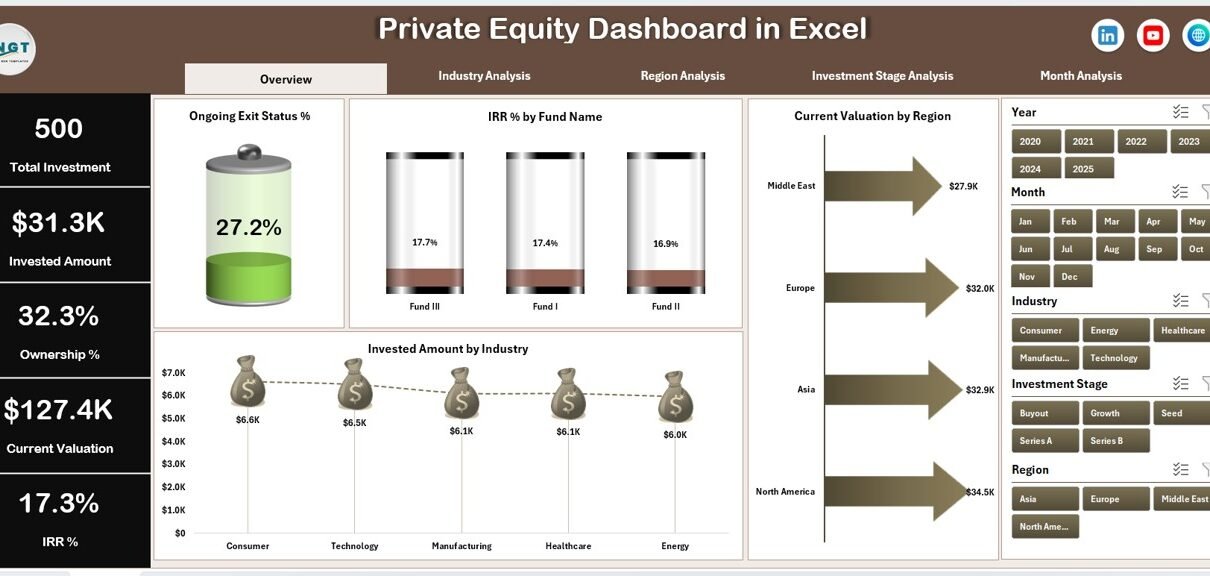
Overview Page: What Does the Overview Page Show?
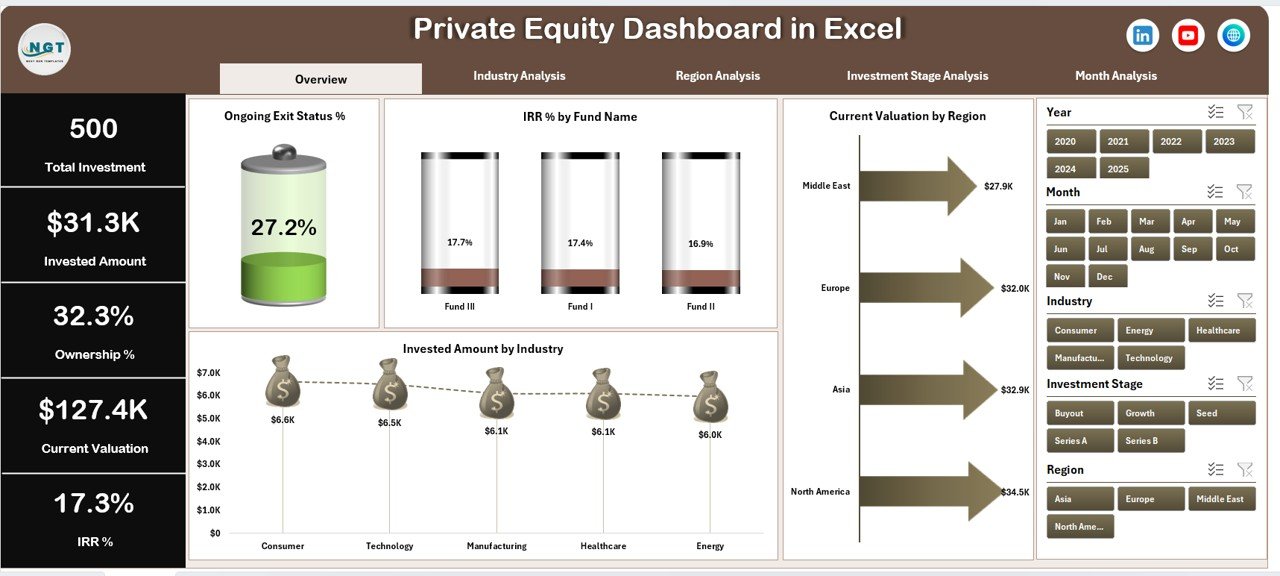
The Overview Page serves as the main landing page of the dashboard. It provides a high-level summary of private equity performance.
Key Elements of the Overview Page
-
Four KPI Cards
These cards highlight critical summary metrics at a glance. -
Four Analytical Charts
-
Ongoing Exit Status %
-
IRR % by Fund Name
-
Current Valuation by Region
-
Invested Amount by Industry
-
Because of this layout, users can quickly assess portfolio health before diving deeper.
Click to Purchases Private Equity Dashboard in Excel
Industry Analysis Page: How Do Investments Perform Across Industries?
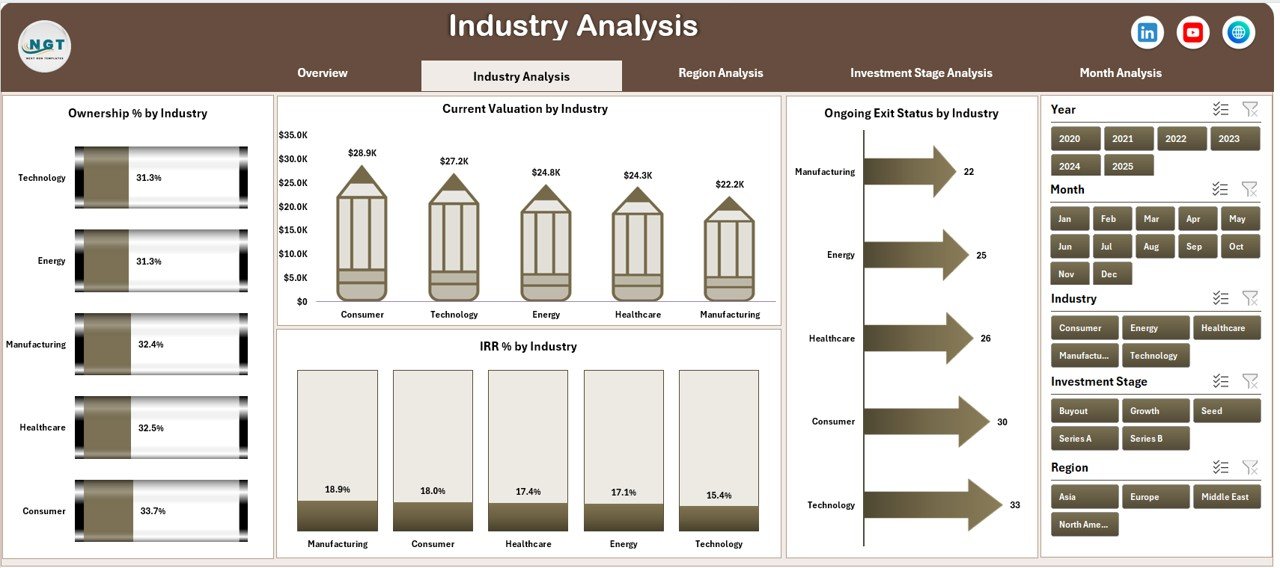
The Industry Analysis Page focuses on sector-wise investment performance. This page helps users understand which industries drive value.
Charts Included in Industry Analysis
-
Ownership % by Industry
-
Current Valuation by Industry
-
Ongoing Exit Status by Industry
-
IRR % by Industry
Since this page uses slicers, users can filter results dynamically. Therefore, comparisons across industries become quick and accurate.
Region Analysis Page: How Do Investments Perform Across Regions?
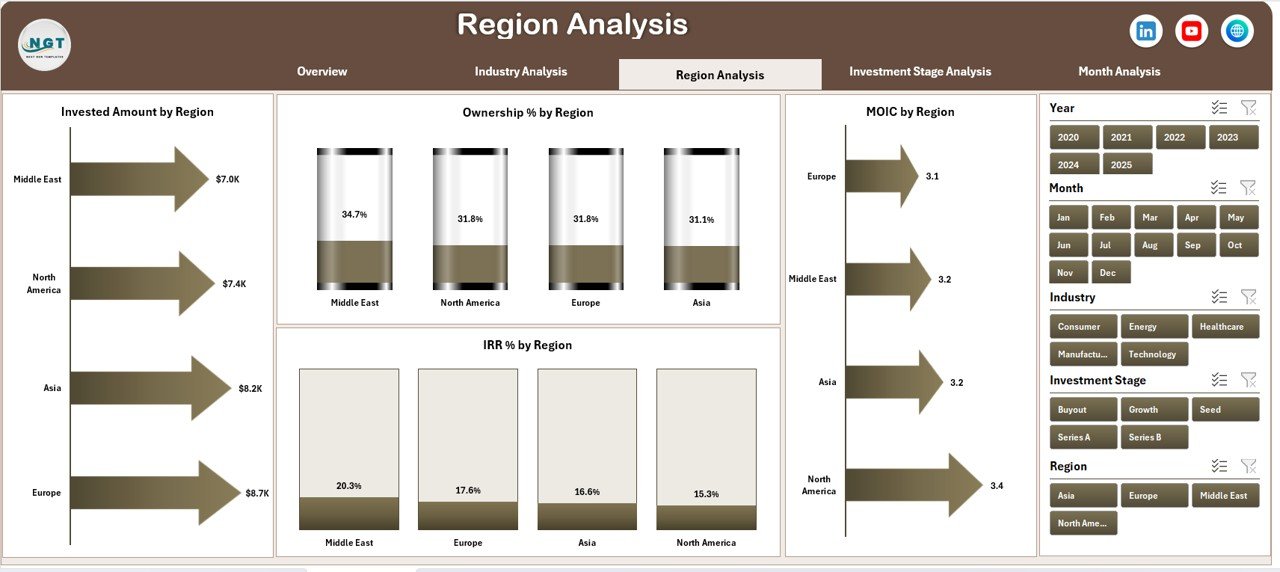
The Region Analysis Page provides insights into geographical performance.
Charts Included in Region Analysis
-
Invested Amount by Region
-
Ownership % by Region
-
MOIC by Region
-
IRR % by Region
This page helps firms identify high-performing regions and manage geographical risk effectively.
Investment Stage Analysis Page: Which Stages Deliver Better Returns?
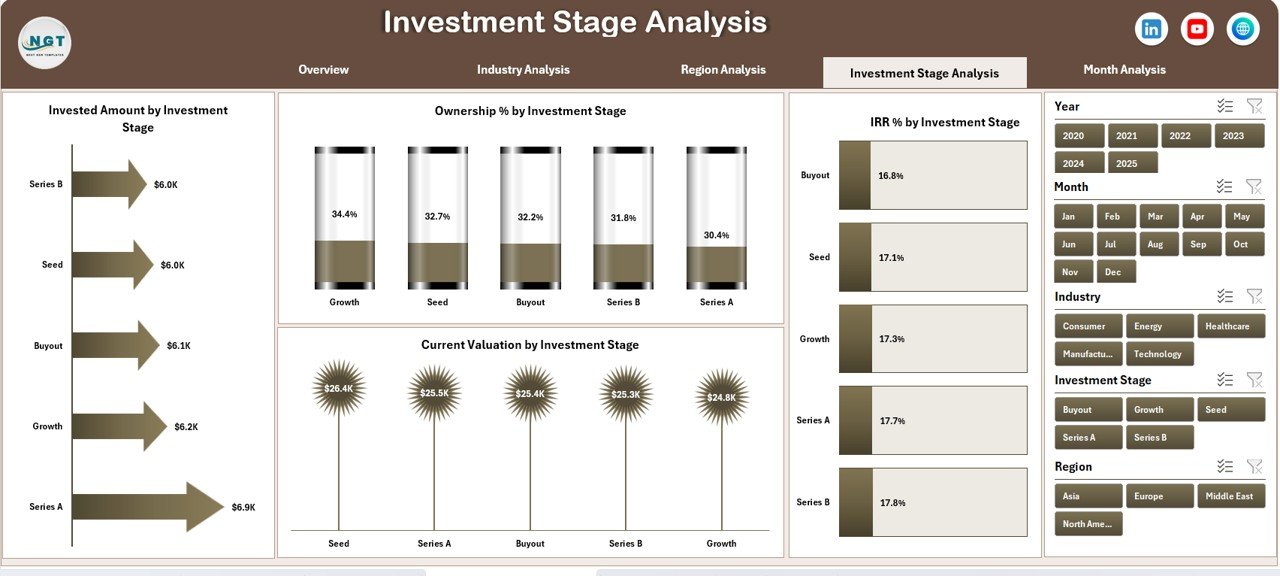
Private equity investments span multiple stages. Hence, tracking performance by stage becomes essential.
Charts Included in Investment Stage Analysis
Click to Purchases Private Equity Dashboard in Excel
-
Invested Amount by Investment Stage
-
Ownership % by Investment Stage
-
Current Valuation by Investment Stage
-
IRR % by Investment Stage
As a result, firms can optimize capital allocation across early, growth, and late stages.
Month Analysis Page: How Do Investments Trend Over Time?
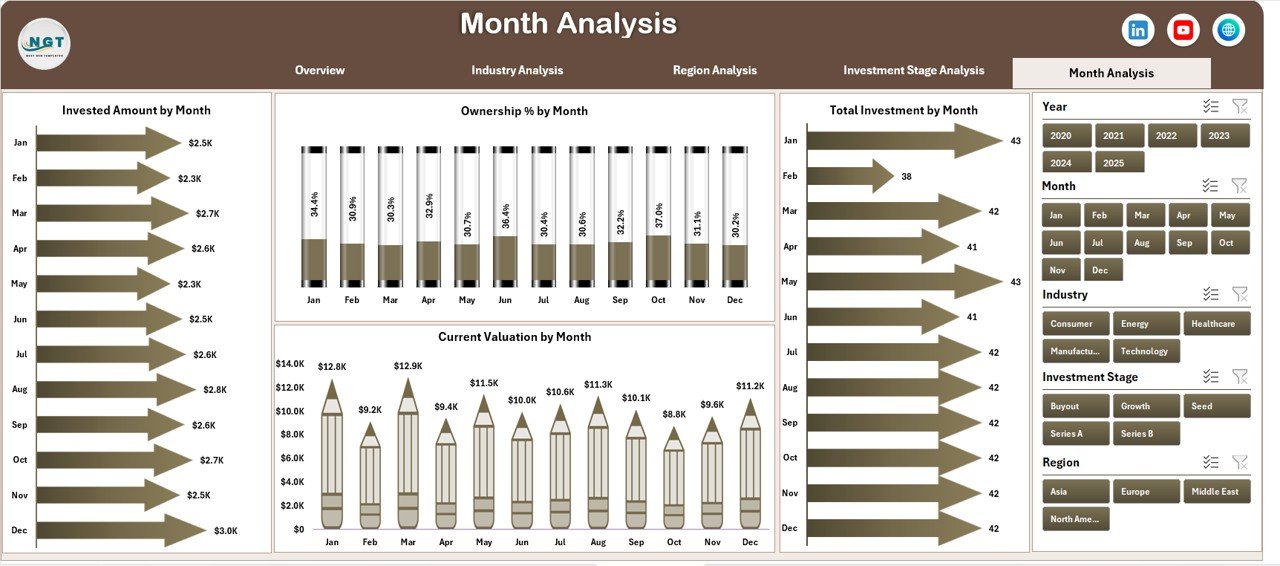
The Month Analysis Page focuses on time-based performance tracking.
Charts Included in Month Analysis
-
Invested Amount by Month
-
Ownership % by Month
-
Current Valuation by Month
-
Total Investment by Month
This page helps users identify seasonal trends and investment timing patterns.
What Supporting Sheets Are Included in the Dashboard?
Data Sheet
The Data Sheet stores all raw investment data in a structured format. It acts as the backbone of the dashboard. Once users update this sheet, the dashboard refreshes automatically.
Support Sheet
The Support Sheet contains helper calculations, lookup tables, and intermediate data used for charts and slicers. This sheet ensures accuracy and stability.
What KPIs Can You Track Using a Private Equity Dashboard in Excel?
This dashboard allows tracking of key private equity KPIs such as:
-
Invested Amount
-
Current Valuation
-
Ownership Percentage
-
Internal Rate of Return (IRR)
-
Multiple on Invested Capital (MOIC)
-
Exit Status
-
Fund-wise Performance
-
Industry-wise Performance
-
Region-wise Performance
-
Stage-wise Performance
Because of this coverage, the dashboard supports both strategic and operational decisions.
Advantages of a Private Equity Dashboard in Excel
Click to Purchases Private Equity Dashboard in Excel
Centralized Investment Visibility
The dashboard brings all investment data into one place. Therefore, teams avoid fragmented reporting.
Faster Decision-Making
Since insights update instantly, managers make decisions faster and with confidence.
Improved Accuracy
Automated calculations reduce manual errors and improve data reliability.
Interactive Analysis
Slicers and filters allow users to analyze data from multiple angles effortlessly.
Cost-Effective Solution
Excel eliminates the need for expensive BI tools while delivering professional-grade insights.
Easy Customization
Users can easily add new KPIs, charts, or funds without technical complexity.
Best Practices for the Private Equity Dashboard in Excel
Use Structured Data Tables
Always maintain clean and structured data in the Data Sheet. This practice improves accuracy and performance.
Limit Manual Overrides
Avoid hard-coding values in charts or calculations. Instead, rely on formulas and pivot tables.
Keep KPIs Consistent
Use consistent definitions for IRR, MOIC, and valuation across all pages.
Refresh Data Regularly
Update the data periodically to ensure insights remain relevant.
Use Clear Naming Conventions
Label funds, regions, and stages clearly to avoid confusion during analysis.
Protect Key Sheets
Protect calculation and support sheets to prevent accidental changes.
Who Can Use a Private Equity Dashboard in Excel?
This dashboard suits a wide range of professionals, including:
-
Private Equity Fund Managers
-
Investment Analysts
-
Portfolio Managers
-
Finance Teams
-
CFOs and Investment Committees
-
Boutique PE Firms and Large Funds
Because Excel remains universal, teams adopt this dashboard quickly.
How Does This Dashboard Improve Reporting Efficiency?
The dashboard eliminates repetitive reporting tasks. Instead of preparing monthly reports manually, users simply update data and review insights instantly. As a result, reporting time reduces significantly.
Can You Customize a Private Equity Dashboard in Excel?
Yes, you can fully customize this dashboard. You can add new pages, KPIs, charts, or slicers based on business needs. Moreover, Excel allows easy integration with existing data sources.
Conclusion: Is a Private Equity Dashboard in Excel Worth It?
Absolutely.
A Private Equity Dashboard in Excel transforms raw investment data into actionable insights. It improves transparency, enhances decision-making, and saves valuable time. Moreover, it offers flexibility, affordability, and ease of use.
If you manage private equity investments and want clarity without complexity, this dashboard delivers exactly what you need.
Frequently Asked Questions About Private Equity Dashboard in Excel
What is the main purpose of a Private Equity Dashboard in Excel?
The main purpose is to track, analyze, and visualize private equity investment performance in one centralized view.
Can Excel handle complex private equity data?
Yes, Excel can handle complex data efficiently when structured properly using tables, formulas, and pivot charts.
Is this dashboard suitable for multiple funds?
Yes, the dashboard supports multiple funds and allows fund-wise filtering using slicers.
Do I need advanced Excel skills to use this dashboard?
No, basic Excel knowledge is enough to use and update the dashboard.
How often should I update the data?
You should update the data monthly or quarterly, depending on reporting requirements.
Can I share this dashboard with stakeholders?
Yes, you can share the Excel file securely with stakeholders or export visuals for presentations.
Visit our YouTube channel to learn step-by-step video tutorials