Managing forensic and investigation activities without structured performance tracking creates delays, blind spots, and compliance risks. However, when teams rely on a Forensics & Investigation KPI Dashboard in Excel, they gain complete visibility into performance, efficiency, and outcomes.
A Forensics & Investigation KPI Dashboard in Excel helps investigation units, audit teams, legal departments, compliance officers, and risk teams track key metrics in one centralized and interactive view. Instead of working with scattered spreadsheets, emails, and reports, teams can analyze real-time KPIs, trends, and gaps instantly.
In this detailed guide, you will learn what a Forensics & Investigation KPI Dashboard in Excel is, how it works, why it is important, its key worksheets, advantages, best practices, and frequently asked questions.
Click to buy Forensics & Investigation KPI Dashboard in Excel
What Is a Forensics & Investigation KPI Dashboard in Excel?
A Forensics & Investigation KPI Dashboard in Excel is a structured reporting and monitoring tool designed to track, analyze, and visualize investigation-related key performance indicators. It converts raw investigation data into clear metrics, trends, and comparisons.
Instead of manually calculating metrics every month, teams can use this dashboard to:
- Track investigation efficiency
- Monitor compliance and accuracy
- Compare targets vs actual performance
- Analyze month-to-date (MTD) and year-to-date (YTD) results
- Identify performance gaps early
Because the dashboard is built in Microsoft Excel, it remains easy to use, flexible, and cost-effective.
Why Do Forensics and Investigation Teams Need KPI Dashboards?
Forensics and investigation teams deal with sensitive data, strict deadlines, and regulatory expectations. Therefore, performance visibility becomes critical.
A KPI dashboard helps because:
- It reduces manual tracking errors
- It improves decision-making speed
- It ensures accountability
- It supports compliance audits
- It highlights risk areas early
Moreover, Excel dashboards allow teams to stay agile without investing in expensive BI tools.
How Does a Forensics & Investigation KPI Dashboard in Excel Work?
This dashboard works by combining multiple structured worksheets into one integrated reporting system. Each worksheet serves a specific purpose, while formulas and drop-downs connect them dynamically.
Once users enter actual, target, and previous-year data, the dashboard automatically:
- Updates MTD and YTD KPIs
- Applies conditional formatting
- Displays trends and comparisons
- Refreshes visuals based on selected month or KPI
As a result, teams gain instant insights with minimal effort.
What Are the Key Features of a Forensics & Investigation KPI Dashboard in Excel?
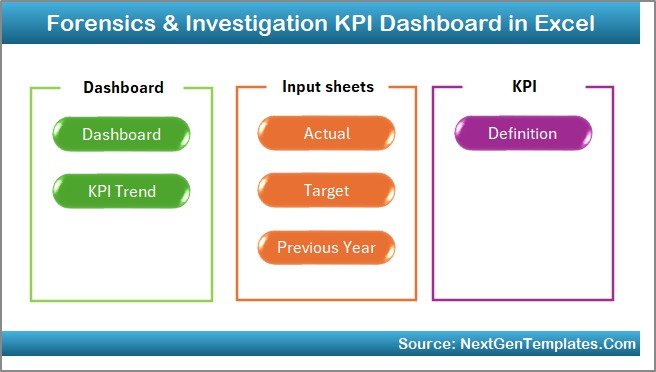
This Forensics & Investigation KPI Dashboard in Excel includes 7 well-structured worksheets, each designed to support reporting, analysis, and decision-making.
Summary Page
The Summary Page works as an index or navigation hub.
Key Highlights of the Summary Page
- Acts as the home screen of the dashboard
- Includes 6 clickable buttons
- Allows users to jump to any worksheet instantly
- Improves usability and navigation
Because investigation dashboards often contain multiple sheets, this page saves time and improves user experience.
Click to buy Forensics & Investigation KPI Dashboard in Excel
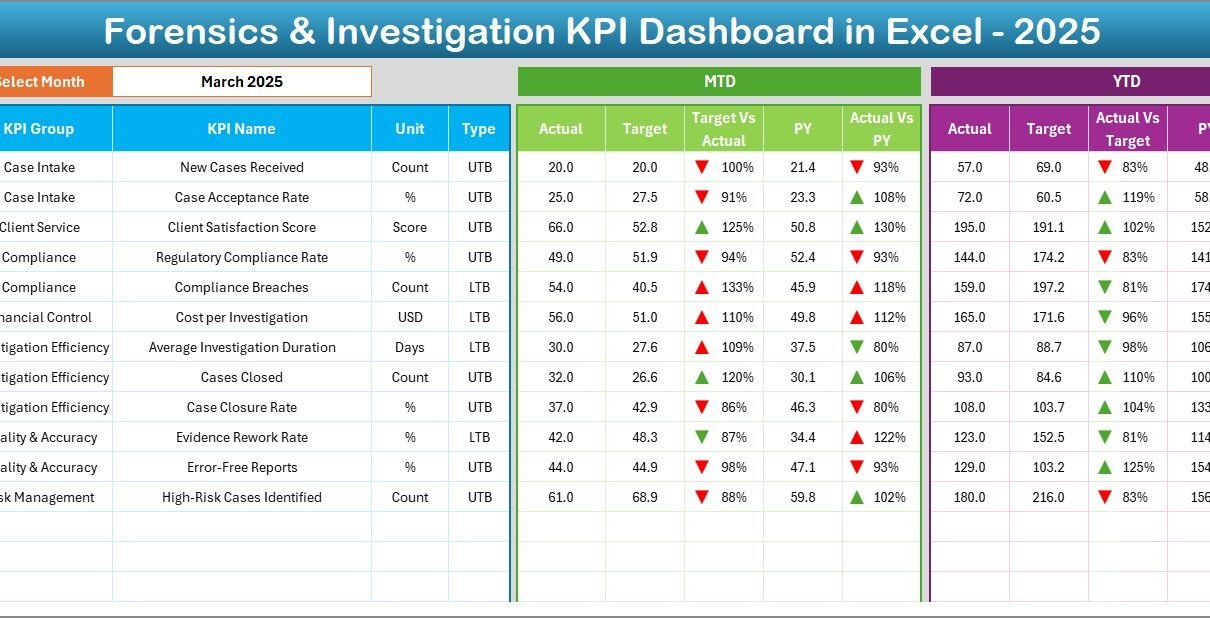
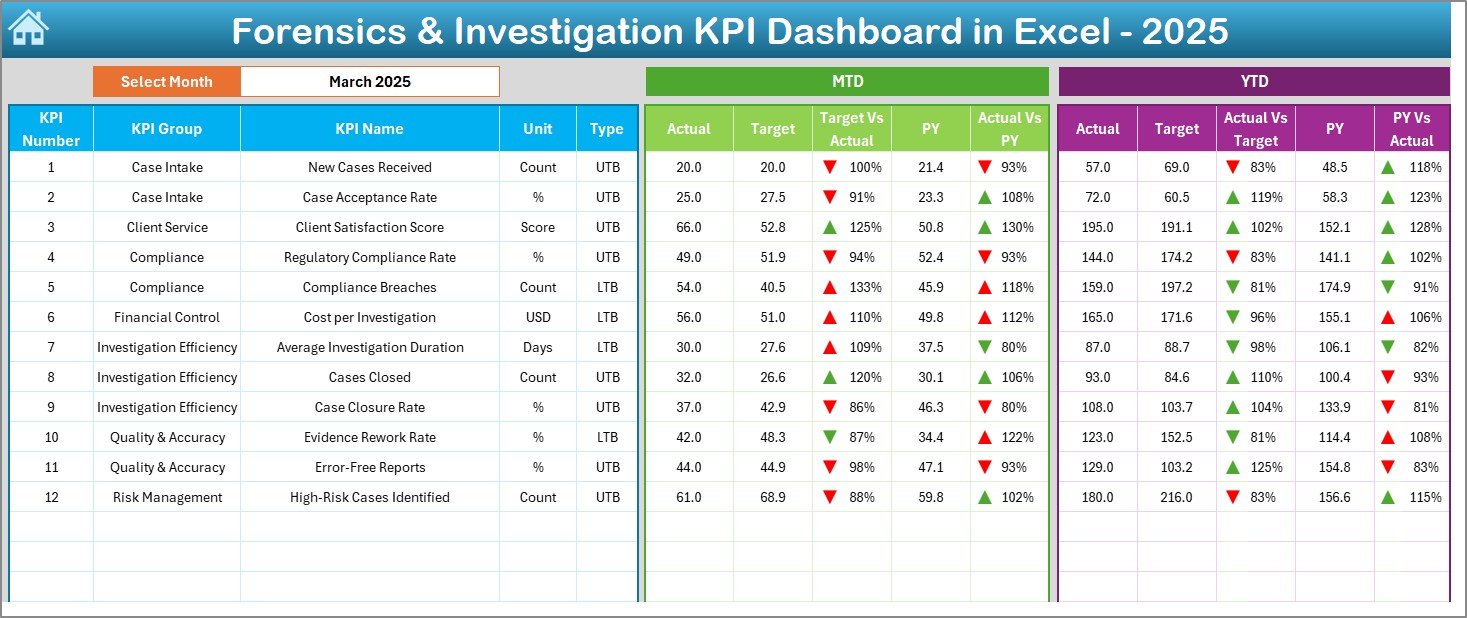
Dashboard Sheet
The Dashboard Sheet is the core of the entire system.
Key Capabilities of the Dashboard Sheet
- Displays all KPIs in one view
- Allows month selection using a drop-down in cell D3
- Automatically updates all KPIs for the selected month
- Shows MTD Actual, Target, and Previous Year values
- Shows YTD Actual, Target, and Previous Year values
Compares:
Target vs Actual
Previous Year vs Actual
Click to buy Forensics & Investigation KPI Dashboard in Excel
Uses up and down arrow conditional formatting
Because of this structure, decision-makers can quickly identify:
- Underperforming KPIs
- Positive trends
- Year-over-year improvements
- Target gaps
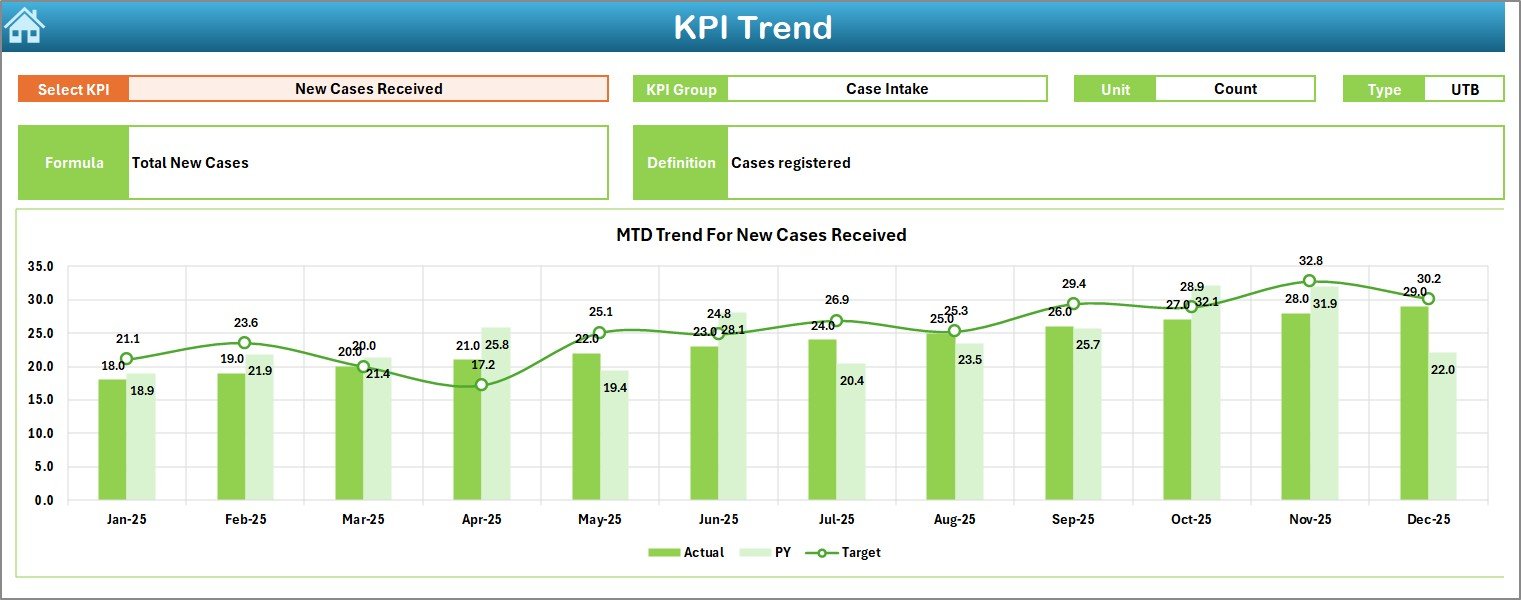
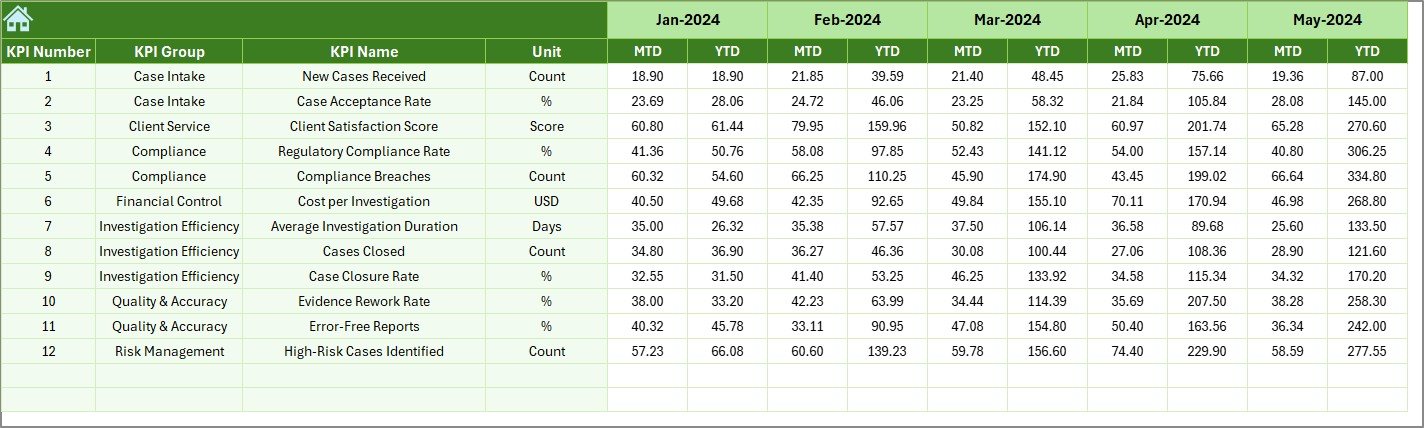
Trend Sheet
The Trend Sheet focuses on deep KPI-level analysis.
How the Trend Sheet Works
- Users select a KPI name from a drop-down in cell C3
- The sheet dynamically displays:
KPI Group
KPI Unit
KPI Type (LTB or UTB)
KPI Formula
KPI Definition
Shows MTD and YTD trend charts
Compares:
Actual
Target
Previous Year values
Because trends tell stories, this sheet helps teams:
- Identify recurring issues
- Measure consistency
- Track long-term improvements
- Support management reviews
Click to buy Forensics & Investigation KPI Dashboard in Excel
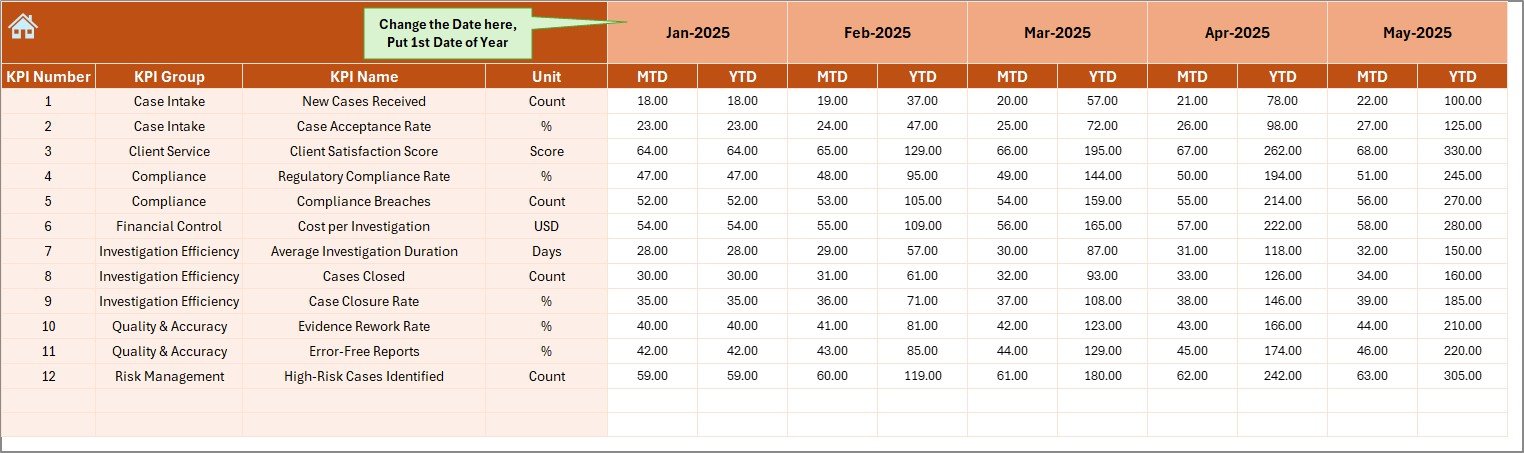
Actual Numbers Input Sheet
The Actual Numbers Input Sheet stores real performance data.
Key Inputs in This Sheet
- Users enter MTD and YTD actual values
- Month selection available in cell E1
- Users input the first month of the year in E1
- All calculations update automatically
Because this sheet controls real data, accurate input ensures reliable insights across the dashboard.
Click to buy Forensics & Investigation KPI Dashboard in Excel
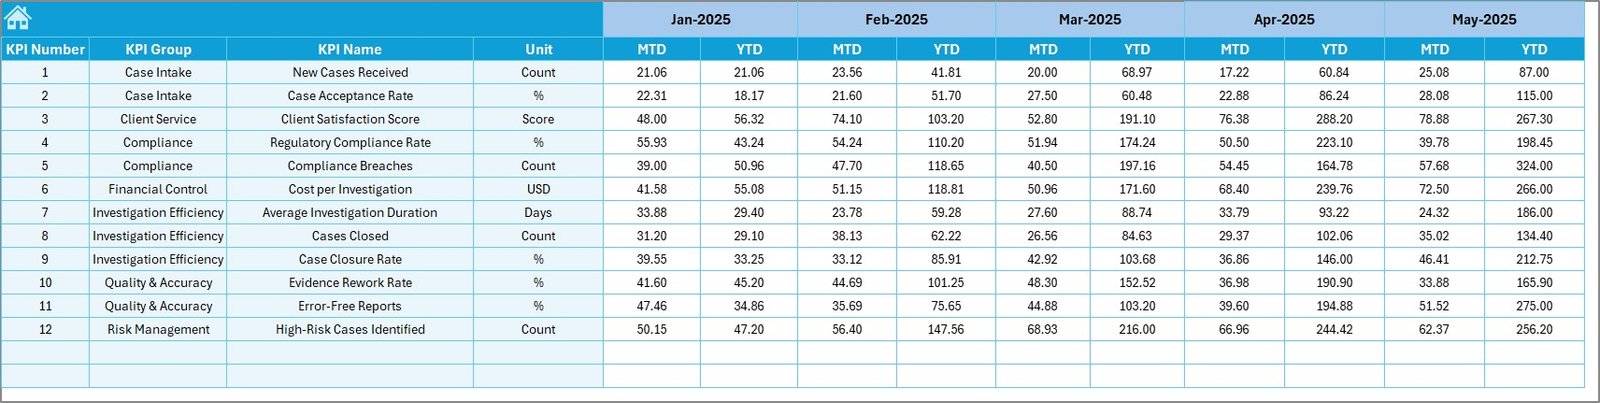
Target Sheet
The Target Sheet defines performance expectations.
Why Targets Matter
- They create accountability
- They guide investigations planning
- They help measure success
Target Sheet Features
- Users enter monthly MTD and YTD target values
- Targets apply to each KPI
- Dashboard compares targets with actual performance automatically
As a result, teams can track whether investigations meet defined benchmarks.
Click to buy Forensics & Investigation KPI Dashboard in Excel
Previous Year
The Previous Year Numbers Sheet enables year-over-year analysis.
Benefits of This Sheet
- Stores last year’s MTD and YTD values
- Enables comparison with current performance
- Highlights improvement or decline trends
- Supports audit and compliance reviews
Because historical context matters, this sheet strengthens decision-making.
Click to buy Forensics & Investigation KPI Dashboard in Excel
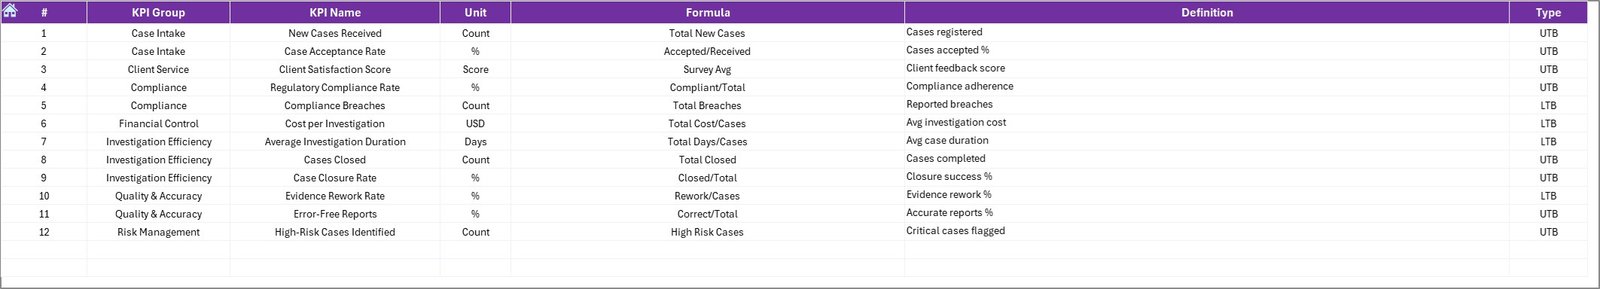
KPI Definition Sheet
The KPI Definition Sheet acts as the dashboard’s knowledge base.
Information Stored Here
- KPI Name
- KPI Group
- Unit of measurement
- Formula
- Short KPI definition
Because all KPIs follow clear definitions, this sheet ensures:
- Consistency
- Transparency
- Easy onboarding of new users
- Audit-ready documentation
Click to buy Forensics & Investigation KPI Dashboard in Excel
Advantages of Forensics & Investigation KPI Dashboard in Excel
A Forensics & Investigation KPI Dashboard in Excel delivers several practical benefits.
- Centralized Performance Visibility
All KPIs appear in one place, which simplifies monitoring and reporting.
- Faster Decision-Making
Because data updates instantly, managers can act quickly.
- Improved Accuracy
Automated formulas reduce manual calculation errors.
- Cost-Effective Solution
Excel eliminates the need for expensive BI tools.
- Easy Customization
Teams can modify KPIs, targets, and formats easily.
- Better Compliance and Audit Support
Historical tracking and documentation improve audit readiness.
- Enhanced Accountability
Clear targets and comparisons assign ownership and responsibility.
Who Can Use a Forensics & Investigation KPI Dashboard in Excel?
This dashboard suits multiple roles and industries, including:
- Forensic investigation teams
- Internal audit departments
- Compliance teams
- Legal and risk departments
- Corporate investigation units
- Government agencies
- Consulting firms
Because Excel remains widely used, adoption stays easy across organizations.
Best Practices for the Forensics & Investigation KPI Dashboard in Excel
To maximize value, teams should follow proven best practices.
- Define KPIs Clearly
Always maintain clear formulas and definitions in the KPI Definition sheet.
- Use Consistent Data Entry
Ensure users enter data in the correct format and month.
- Review Targets Regularly
Update targets based on changing investigation complexity.
- Validate Data Monthly
Cross-check actual values before final reporting.
- Limit KPI Overload
Track meaningful KPIs instead of excessive metrics.
- Use Trend Analysis Actively
Review trend charts during monthly and quarterly reviews.
- Protect Data Integrity
Apply sheet protection to prevent accidental changes.
How Does This Dashboard Improve Investigation Performance?
This dashboard improves performance because it:
- Highlights inefficiencies early
- Encourages data-driven decisions
- Tracks workload and outcomes clearly
- Aligns investigations with organizational goals
- Supports continuous improvement
Therefore, teams move from reactive reporting to proactive management.
Common KPIs Tracked in Forensics & Investigation Dashboards
Although KPIs vary by organization, common examples include:
- Case closure rate
- Average investigation cycle time
- Evidence accuracy rate
- Compliance adherence percentage
- Cost per investigation
- Reopened case rate
- Timely reporting percentage
Excel allows easy KPI additions as requirements evolve.
Why Choose Excel Over Other Tools?
Excel remains a preferred choice because:
- It requires no licensing cost
- Most users already know Excel
- It supports formulas, charts, and automation
- It allows offline usage
- It integrates with other systems easily
Therefore, Excel dashboards deliver flexibility without complexity.
Conclusion: Is a Forensics & Investigation KPI Dashboard in Excel Worth It?
A Forensics & Investigation KPI Dashboard in Excel offers a powerful yet simple way to monitor, analyze, and improve investigation performance. By combining structured data input, automated calculations, dynamic visuals, and clear KPI definitions, this dashboard supports better decisions and stronger compliance.
Because the dashboard remains flexible, scalable, and user-friendly, it fits organizations of all sizes. When teams follow best practices and maintain data quality, this dashboard becomes a long-term performance management asset.
Frequently Asked Questions (FAQs)
What is the main purpose of a Forensics & Investigation KPI Dashboard in Excel?
The main purpose is to track, analyze, and visualize investigation performance metrics in one centralized system.
Can non-technical users use this dashboard?
Yes, Excel-based dashboards remain easy to use for non-technical users.
How often should data be updated?
Teams should update data monthly or as investigations progress.
Can I add more KPIs to the dashboard?
Yes, Excel allows easy customization and KPI expansion.
Does this dashboard support audits?
Yes, historical tracking and KPI definitions support audit and compliance needs.
Is this dashboard suitable for large organizations?
Yes, with proper structure and governance, it scales well for large teams.
Click to buy Forensics & Investigation KPI Dashboard in Excel
Visit our YouTube channel to learn step-by-step video tutorials
Watch the step-by-step video tutorial: