Travel agencies operate in a highly competitive and fast-moving environment. They manage bookings, customers, agents, destinations, revenue, and service quality on a daily basis. However, when agencies rely on manual reports or disconnected spreadsheets, performance visibility drops and decision-making slows down.
That is exactly why a Travel Agencies KPI Dashboard in Excel becomes a critical business tool.
In this detailed article, you will learn what a Travel Agencies KPI Dashboard in Excel is, why travel businesses need it, how it works, its worksheet structure, key features, advantages, best practices, and frequently asked questions. By the end of this guide, you will clearly understand how this ready-to-use Excel dashboard helps travel agencies monitor performance and make smarter decisions.
Click to Purchases Travel Agencies KPI Dashboard in Excel
What Is a Travel Agencies KPI Dashboard in Excel?
A Travel Agencies KPI Dashboard in Excel is an interactive and structured reporting solution designed to track key performance indicators relevant to travel agency operations.
Instead of reviewing multiple static reports, managers use one Excel dashboard to monitor:
-
Sales and booking performance
-
Revenue and targets
-
Operational efficiency
-
Growth trends
-
Year-over-year comparisons
Because Excel supports formulas, drop-downs, conditional formatting, and charts, this dashboard provides both MTD (Month-to-Date) and YTD (Year-to-Date) performance views in one place.
As a result, travel agencies gain clarity, control, and confidence in their decision-making.
Why Do Travel Agencies Need a KPI Dashboard?
Travel agencies handle large volumes of transactional and performance data. Therefore, without proper monitoring, issues remain hidden until they become serious problems.
A Travel Agencies KPI Dashboard in Excel helps because it:
-
Centralizes KPI tracking
-
Compares actual results against targets
-
Highlights performance gaps visually
-
Shows trends over time
-
Supports faster management decisions
Moreover, Excel remains widely used and cost-effective, which makes this dashboard easy to adopt across teams.
Click to Purchases Travel Agencies KPI Dashboard in Excel
How Does a Travel Agencies KPI Dashboard in Excel Work?
The dashboard works by collecting KPI data in structured input sheets and transforming it into meaningful insights using formulas and visuals.
Here is how the workflow typically looks:
-
Define KPIs and targets
-
Enter actual numbers for each month
-
Input previous year data
-
Select the reporting month
-
Review MTD and YTD performance
-
Analyze trends and variances
Because calculations and visuals update automatically, users always see the latest performance.
What Are the Key Features of the Travel Agencies KPI Dashboard?
This ready-to-use Travel Agencies KPI Dashboard in Excel includes several powerful features that simplify performance monitoring.
Key Highlights
-
Home navigation sheet
-
Interactive dashboard with month selection
-
MTD and YTD KPI analysis
-
Target vs Actual and PY vs Actual comparison
-
Conditional formatting with up/down arrows
-
KPI trend analysis
-
Structured input and definition sheets
Each feature works together to deliver a professional and reliable reporting experience.
What Worksheets Are Included in the Travel Agencies KPI Dashboard?
This Excel dashboard includes seven structured worksheets, each designed for a specific purpose.
Click to Purchases Travel Agencies KPI Dashboard in Excel
1. What Is the Home Sheet and Why Is It Important?
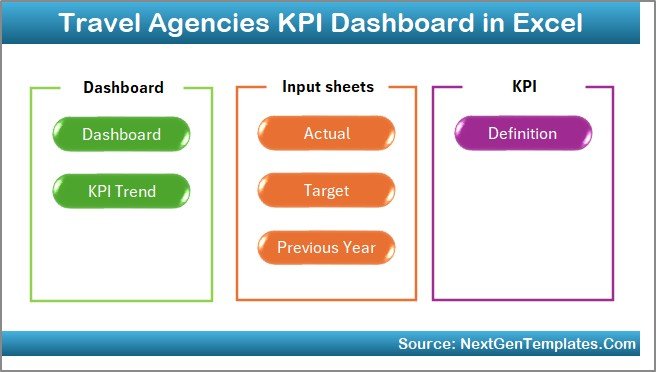
The Home Sheet acts as an index and navigation hub for the dashboard.
Key Features of the Home Sheet
-
Six navigation buttons
-
Quick access to all dashboard sections
-
Clean and user-friendly layout
Because of this design, users can move between sheets quickly without scrolling or searching.
2. What Is the Dashboard Sheet and How Does It Work?
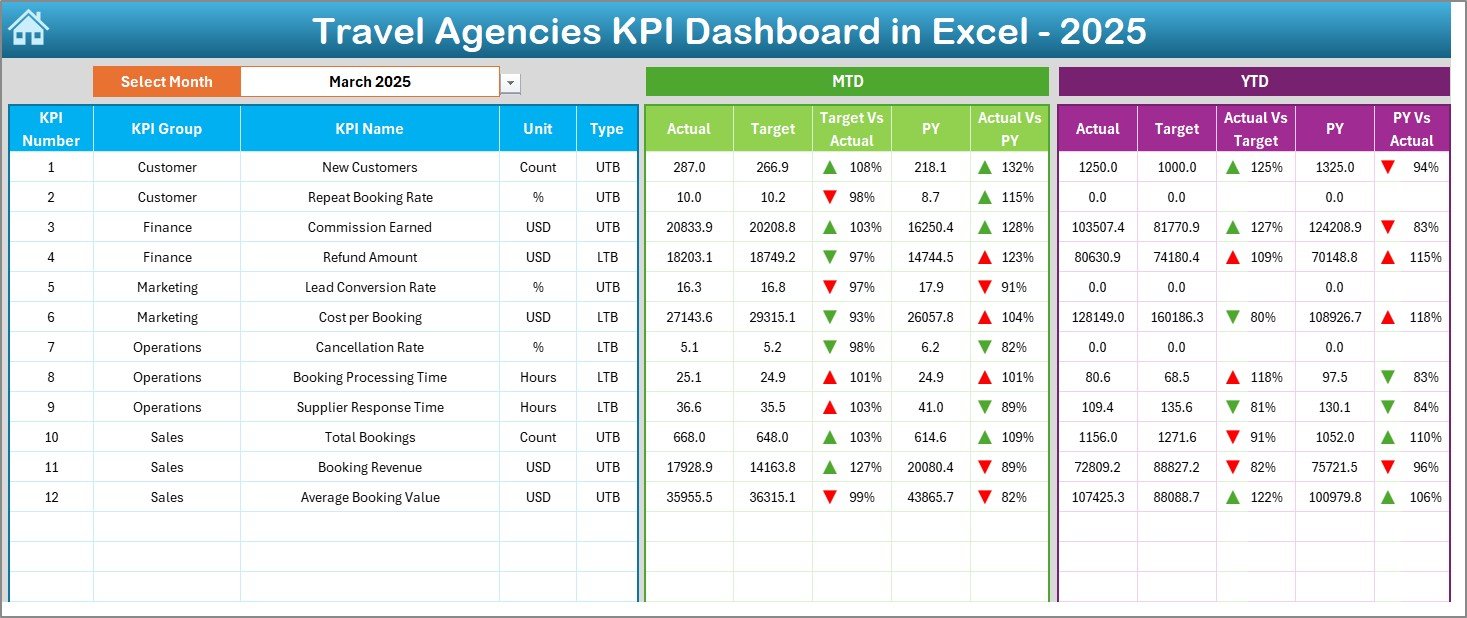
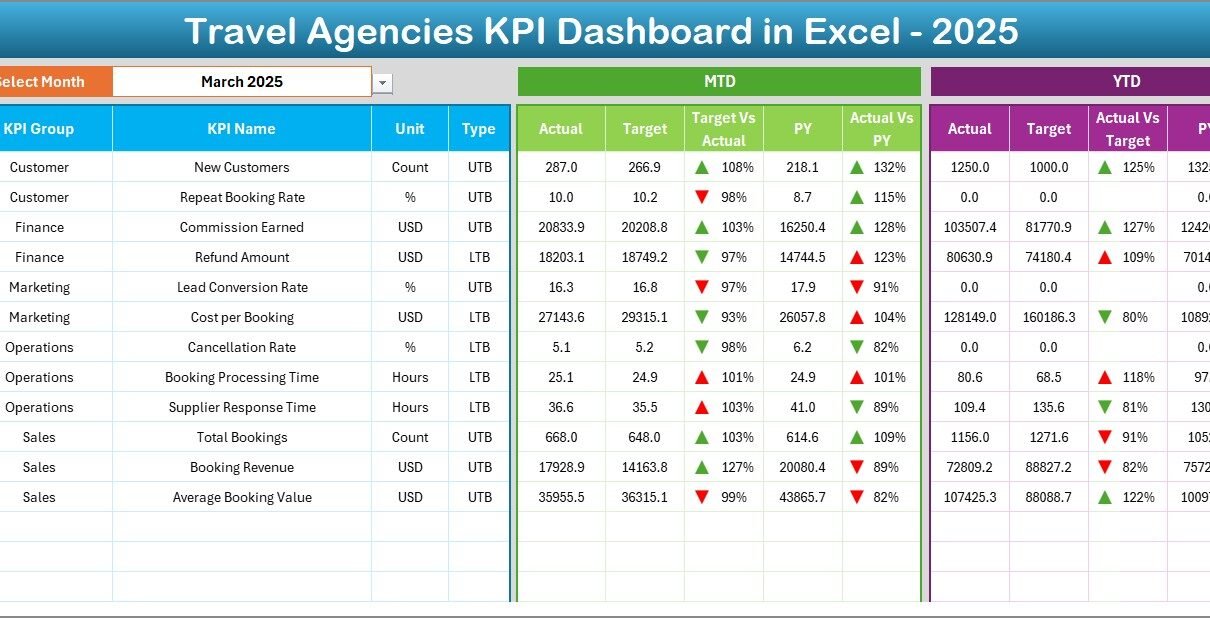
The Dashboard Sheet is the main reporting page of the Travel Agencies KPI Dashboard in Excel.
Month Selection Feature
On cell D3, users can select the reporting month from a drop-down list. As soon as the month changes, the entire dashboard updates automatically.
What KPI Information Does the Dashboard Display?
The dashboard shows both MTD and YTD performance metrics.
🔹 MTD Section Displays:
-
Actual values
-
Target values
-
Previous Year (PY) values
-
Target vs Actual variance
-
PY vs Actual variance
🔹 YTD Section Displays:
-
Actual values
-
Target values
-
Previous Year values
-
Target vs Actual variance
-
PY vs Actual variance
Conditional Formatting with Arrows
Up and down arrows visually indicate positive or negative performance. Because of this visual clarity, managers can instantly identify strong and weak KPIs.
Click to Purchases Travel Agencies KPI Dashboard in Excel
3. What Is the KPI Trend Sheet and Why Is It Useful?
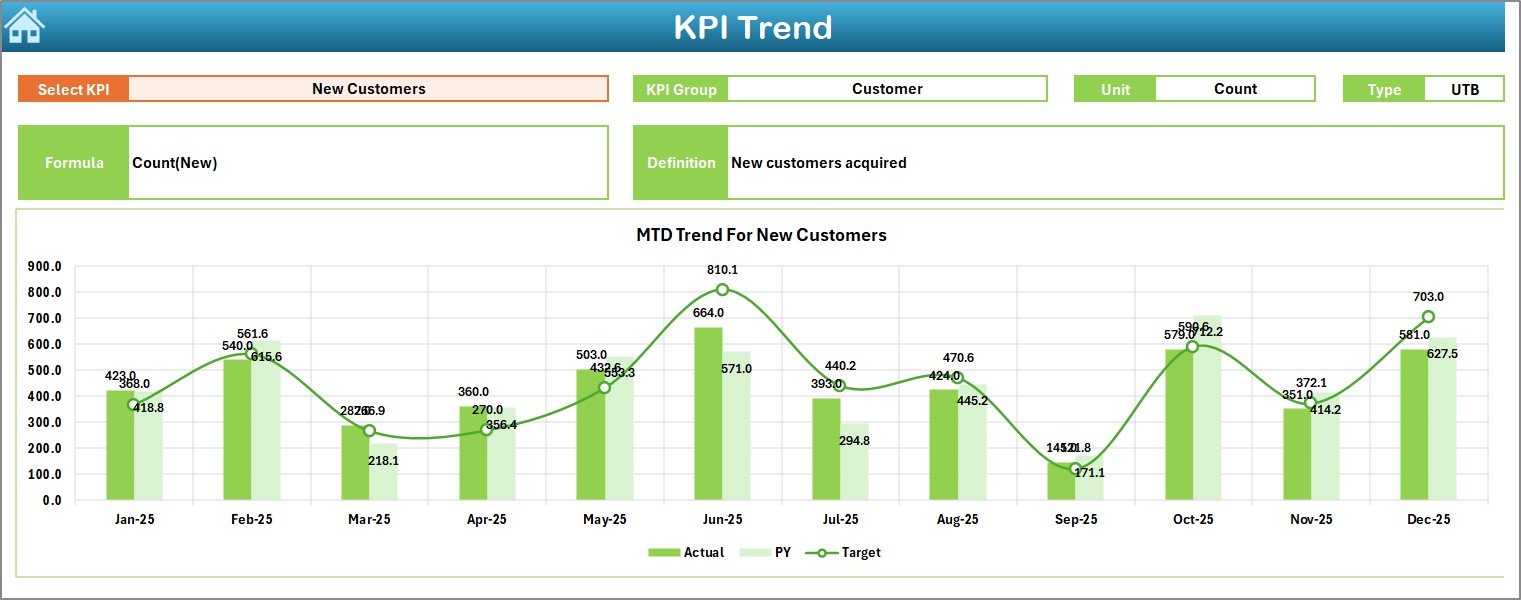
The KPI Trend Sheet focuses on individual KPI performance over time.
How the KPI Trend Sheet Works
-
Select the KPI name from the drop-down in cell C3
-
The sheet automatically displays related KPI details
Information Displayed
-
KPI Group
-
Unit of KPI
-
KPI Type (Upper the Better or Lower the Better)
-
KPI Formula
-
KPI Definition
Trend Charts Included
The sheet displays MTD and YTD trend charts for:
-
Actual values
-
Target values
-
Previous Year values
Because trends reveal patterns, this sheet helps managers identify consistent growth or recurring issues.
Click to Purchases Travel Agencies KPI Dashboard in Excel
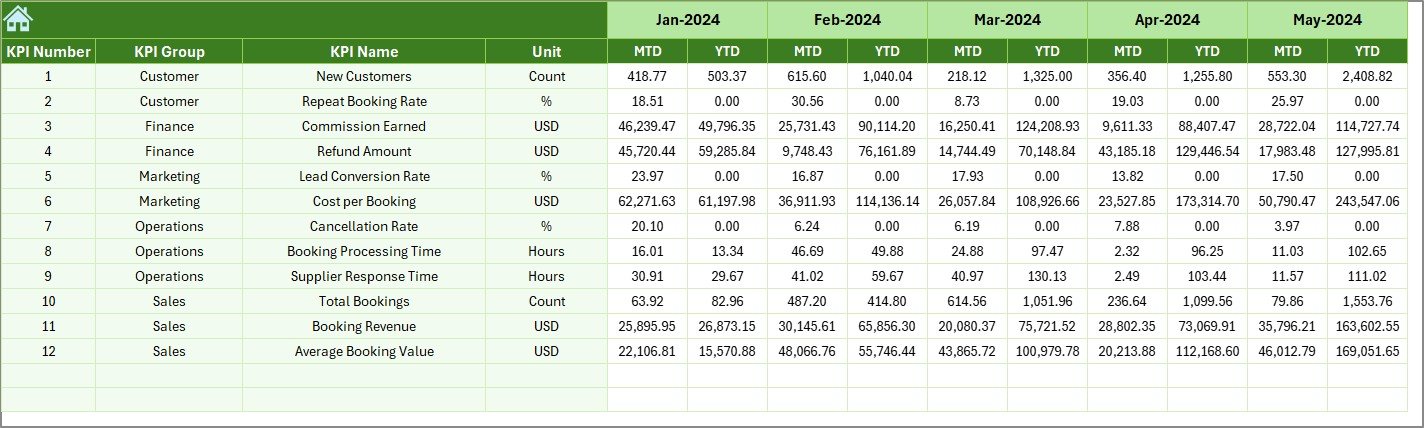
4. What Is the Actual Numbers Input Sheet Used For?
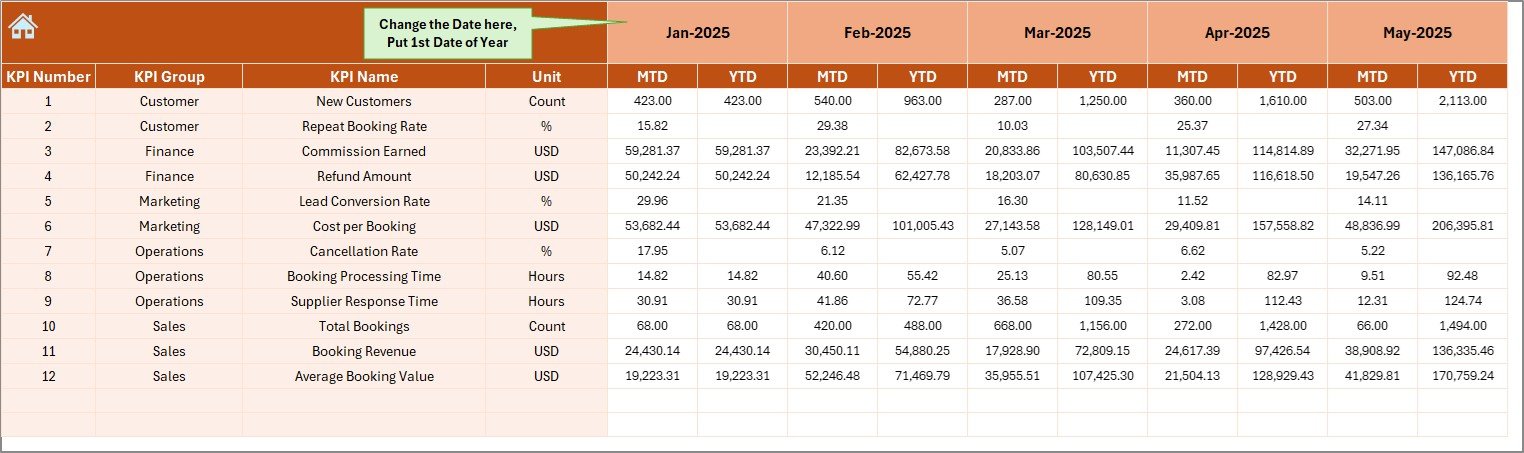
The Actual Numbers Input Sheet captures real performance data.
Key Features
-
Enter MTD and YTD actual values
-
Change reporting month from cell E1
-
Set the first month of the year dynamically
Because data entry remains simple and structured, reporting stays accurate and consistent.
5. What Is the Target Sheet and Why Is It Required?
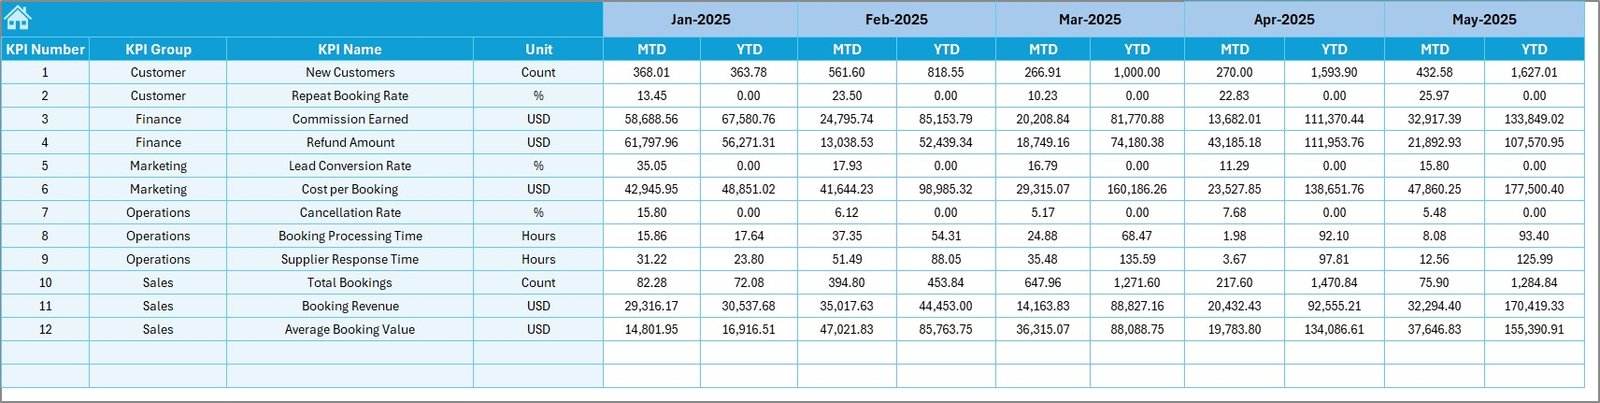
The Target Sheet stores performance targets for each KPI.
What Users Enter Here
-
Monthly MTD targets
-
Monthly YTD targets
These targets allow the dashboard to calculate variances and performance status.
Click to Purchases Travel Agencies KPI Dashboard in Excel
6. What Is the Previous Year Number Sheet Used For?
The Previous Year Number Sheet captures historical performance data.
Why This Sheet Matters
-
Enables year-over-year comparison
-
Highlights growth or decline
-
Supports strategic planning
Users enter previous year data in the same structure as current year data.
7. What Is the KPI Definition Sheet and Why Is It Important?
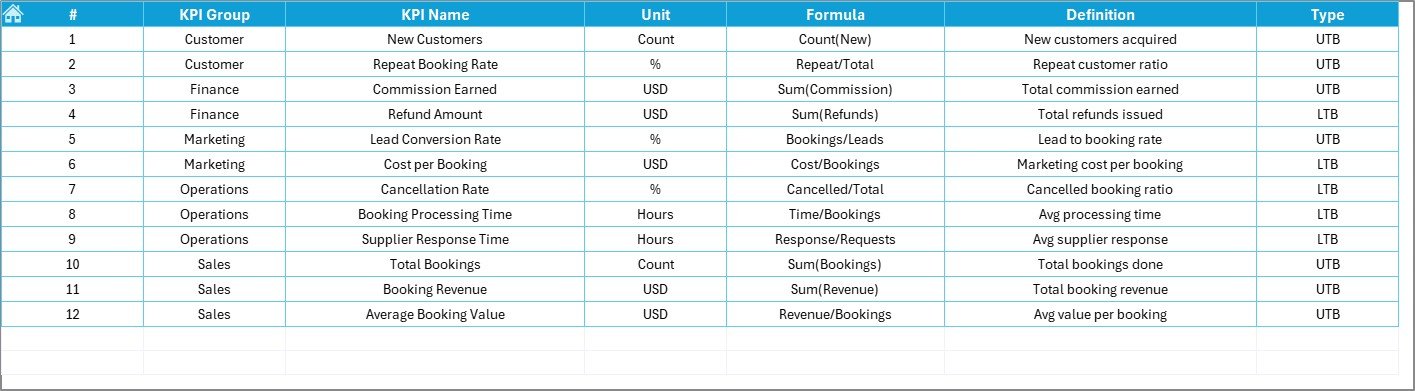
The KPI Definition Sheet ensures clarity and standardization.
Information Captured
-
KPI Name
-
KPI Group
-
Unit of measurement
-
KPI Formula
-
KPI Definition
Because everyone refers to the same definitions, KPI interpretation remains consistent across teams.
Click to Purchases Travel Agencies KPI Dashboard in Excel
What Types of KPIs Can Travel Agencies Track Using This Dashboard?
A Travel Agencies KPI Dashboard in Excel supports KPIs such as:
-
Booking volume
-
Revenue growth
-
Conversion rate
-
Customer acquisition
-
Cancellation rate
-
Average booking value
-
Agent productivity
Therefore, agencies can customize the dashboard to match their business goals.
How Does This Dashboard Improve Travel Agency Performance?
This dashboard improves performance because it:
-
Provides real-time visibility
-
Highlights gaps against targets
-
Shows trends and comparisons
-
Encourages data-driven decisions
As a result, agencies respond faster to market changes.
Click to Purchases Travel Agencies KPI Dashboard in Excel
Advantages of Travel Agencies KPI Dashboard in Excel
Using a Travel Agencies KPI Dashboard in Excel offers several advantages.
✔ Centralized Performance Tracking
All KPIs appear in one interactive dashboard.
✔ Easy to Use
Excel familiarity reduces training time.
✔ MTD and YTD Analysis
Users can switch between short-term and long-term views.
✔ Visual Performance Indicators
Arrows and formatting highlight performance instantly.
✔ Cost-Effective
Excel avoids expensive BI tools.
✔ Customizable
Agencies can modify KPIs as needed.
Best Practices for the Travel Agencies KPI Dashboard in Excel
To get maximum value from this dashboard, follow these best practices.
📌 Define KPIs Clearly
Maintain accurate definitions in the KPI Definition sheet.
📌 Set Realistic Targets
Targets should reflect business strategy and capacity.
📌 Update Data Regularly
Consistent updates ensure reliable insights.
📌 Review Trends Monthly
Focus on trends, not just individual numbers.
📌 Validate Input Data
Accurate data leads to accurate decisions.
📌 Use the Dashboard in Review Meetings
Integrate the dashboard into performance discussions.
Click to Purchases Travel Agencies KPI Dashboard in Excel
Who Should Use a Travel Agencies KPI Dashboard in Excel?
This dashboard suits:
-
Travel agency owners
-
Sales and operations managers
-
Regional heads
-
Finance teams
-
Small and mid-sized travel businesses
Because of its flexibility, different agency models can use it effectively.
Conclusion: Why Should You Use a Travel Agencies KPI Dashboard in Excel?
A Travel Agencies KPI Dashboard in Excel provides a structured, visual, and reliable way to monitor business performance. Because it combines KPI tracking, trend analysis, and comparisons in one Excel file, it simplifies reporting and improves decision-making.
Moreover, its ready-to-use design allows quick implementation without technical complexity. If your goal involves improving transparency, performance control, and strategic planning, this dashboard becomes a powerful solution.
Frequently Asked Questions (FAQs)
1. What is a Travel Agencies KPI Dashboard in Excel?
It is an Excel-based dashboard used to track and analyze travel agency KPIs.
2. Does the dashboard support month selection?
Yes, users can select the reporting month from a drop-down.
3. Can I track MTD and YTD performance?
Yes, the dashboard displays both MTD and YTD metrics.
4. Does it include trend analysis?
Yes, the KPI Trend sheet shows MTD and YTD trends.
5. Can I customize KPIs?
Yes, you can add or modify KPIs easily.
6. Is this dashboard suitable for small agencies?
Yes, small and mid-sized agencies benefit greatly from it.
7. Does it compare with previous year data?
Yes, the dashboard includes PY vs Actual analysis.
8. Does it require advanced Excel skills?
No, basic Excel knowledge is sufficient.
Click to Purchases Travel Agencies KPI Dashboard in Excel
Visit our YouTube channel to learn step-by-step video tutorials