Warehousing operations play a critical role in supply chain success. Every inbound unit, outbound shipment, storage decision, and transaction directly affects cost, efficiency, and customer satisfaction. However, when warehouse teams rely on scattered spreadsheets or manual reports, visibility drops and decisions slow down.
That is exactly why a Warehousing Dashboard in Excel becomes a powerful and essential business tool.
In this detailed guide, you will learn what a Warehousing Dashboard in Excel is, why businesses need it, how it works, its dashboard structure, analytical pages, key features, advantages, best practices, and frequently asked questions. By the end of this article, you will clearly understand how a ready-to-use Warehousing Dashboard in Excel helps organizations improve operational efficiency and data-driven decision-making.
Click to Purchases Warehousing Dashboard in Excel
What Is a Warehousing Dashboard in Excel?
A Warehousing Dashboard in Excel is an interactive and structured reporting solution designed to monitor warehouse performance metrics in one centralized view.
Instead of reviewing multiple static reports, warehouse managers use one Excel dashboard to track:
-
Units received
-
Storage utilization
-
On-time and delayed shipments
-
Available stock levels
-
Warehouse-wise performance
-
Item category trends
-
Monthly operational movements
Because Excel supports pivot tables, slicers, formulas, and charts, this dashboard delivers real-time insights while remaining flexible and easy to maintain.
As a result, warehouse teams move from reactive reporting to proactive warehouse performance management.
Why Do Businesses Need a Warehousing Dashboard in Excel?
Warehousing operations involve multiple moving parts. However, without proper visibility, inefficiencies remain hidden. Therefore, businesses need a structured dashboard to monitor operations clearly.
Here is why a Warehousing Dashboard in Excel matters:
-
It provides one single source of truth
-
It reduces manual reporting effort
-
It highlights bottlenecks in real time
-
It supports faster operational decisions
-
It improves inventory and storage planning
-
It enhances shipment reliability
Moreover, Excel dashboards remain cost-effective and easy to deploy, especially for small and mid-sized organizations.
How Does a Warehousing Dashboard in Excel Work?
A Warehousing Dashboard in Excel works by connecting structured warehouse data with pivot-based visual analytics.
The workflow typically follows these steps:
-
Warehouse data gets recorded in a structured Data Sheet
-
Pivot tables process and summarize the data
-
Charts visualize KPIs and trends
-
Slicers filter results dynamically
-
KPI cards display high-level performance
Because everything runs inside Excel, users do not need advanced technical skills to operate or update the dashboard.
Key Features of the Warehousing Dashboard in Excel
This ready-to-use Warehousing Dashboard in Excel includes several powerful features that improve usability and insights.
Page Navigator
The Page Navigator, located on the left side, allows users to move between different analytical pages instantly. As a result, navigation remains smooth and intuitive.
Right-Side Slicers
Each dashboard page includes slicers on the right side. These slicers help users filter data dynamically by relevant dimensions such as month, warehouse name, storage type, or item category.
KPI Cards
The dashboard displays four KPI cards on the Overview page. These cards highlight critical warehouse metrics at a glance.
Pivot-Based Charts
All visuals use pivot charts. Therefore, users can easily refresh, modify, or extend the dashboard without breaking formulas.
Dashboard Structure: Pages Explained in Detail
This Warehousing Dashboard in Excel includes five analytical pages, each designed for a specific business purpose.
Click to Purchases Warehousing Dashboard in Excel
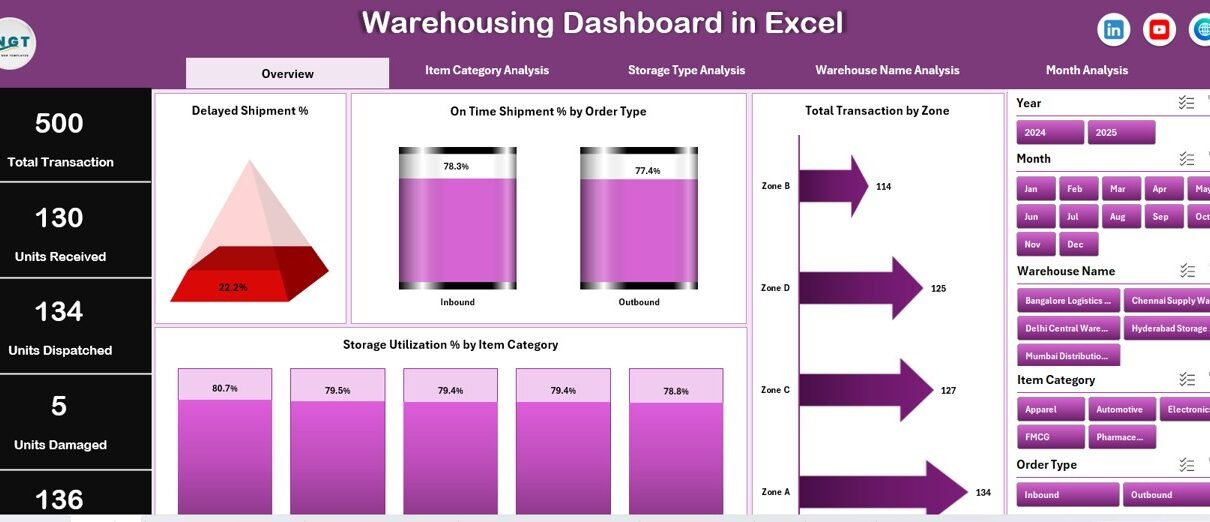
1. Overview Page: How Do You Monitor Warehouse Performance at a Glance?
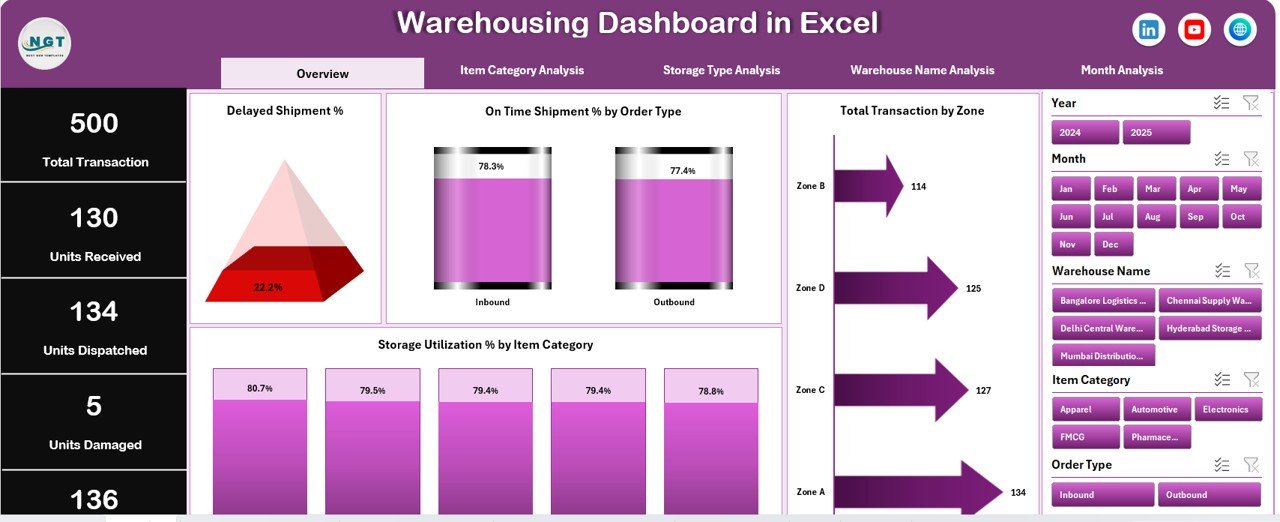
The Overview Page acts as the control center of the entire dashboard.
What Does the Overview Page Show?
This page displays:
-
Right-side slicer for dynamic filtering
-
Four KPI cards for high-level metrics
-
Four summary charts for operational insights
Key KPI Cards
The four cards typically show:
-
Delayed Shipment %
-
On-Time Shipment %
-
Total Transactions
-
Storage Utilization %
These cards help decision-makers understand warehouse health instantly.
Charts on the Overview Page
The Overview Page includes:
-
Delayed Shipment % by Order Type
-
On-Time Shipment % by Order Type
-
Total Transactions by Zone
-
Storage Utilization % by Item Category
As a result, managers quickly identify performance gaps and improvement areas.
2. Item Category Analysis: How Are Different Items Performing?
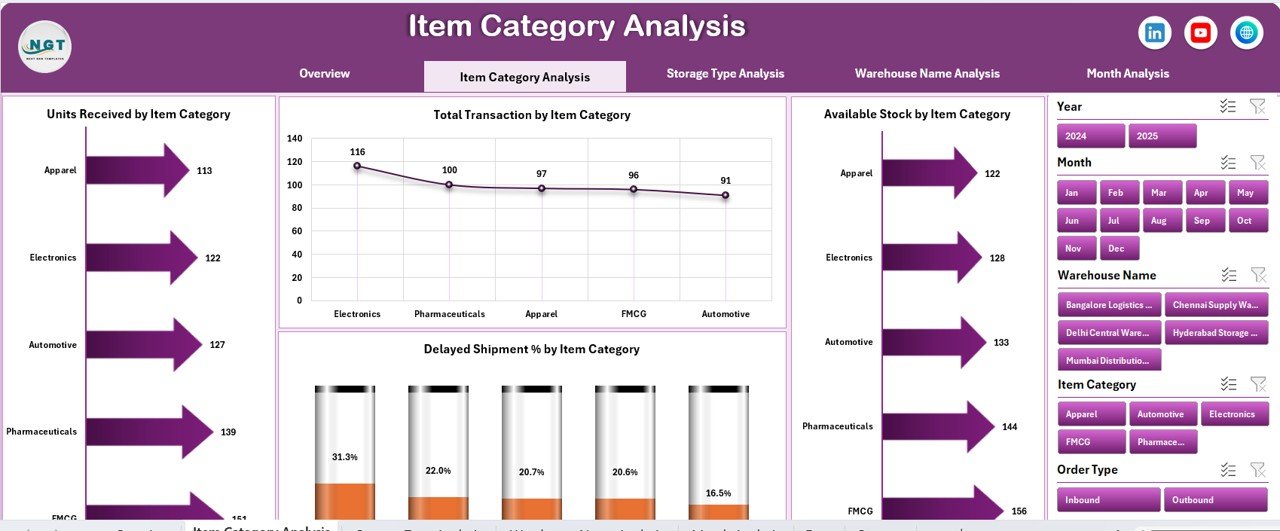
The Item Category Analysis page focuses on performance across product or item categories.
Why Is Item Category Analysis Important?
Different item categories behave differently in terms of storage, movement, and shipment delays. Therefore, analyzing them separately improves planning accuracy.
Charts Included on This Page
This page displays four key charts:
-
Units Received by Item Category
-
Total Transactions by Item Category
-
Available Stock by Item Category
-
Delayed Shipment % by Item Category
With these insights, warehouse teams optimize stock allocation and reduce delays.
Click to Purchases Warehousing Dashboard in Excel
3. Storage Type Analysis: How Efficiently Are Storage Areas Used?
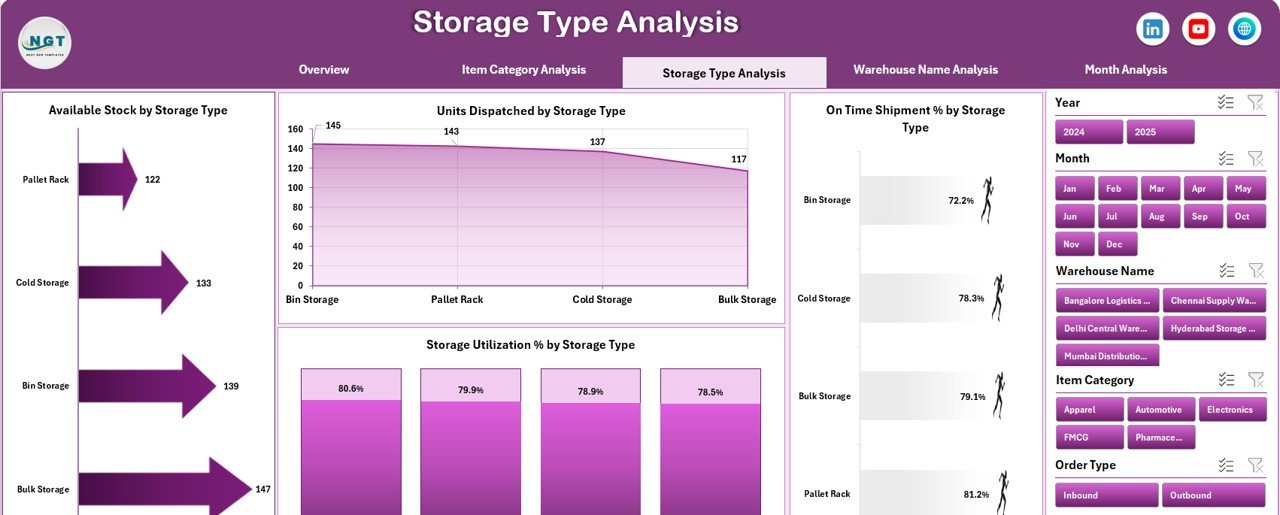
The Storage Type Analysis page evaluates warehouse performance by storage type.
Why Analyze Storage Types Separately?
Different storage types—such as pallets, racks, bins, or cold storage—have unique capacity and utilization patterns. Therefore, tracking them individually improves space management.
Charts on the Storage Type Analysis Page
This page includes:
-
Units Received by Storage Type
-
Available Stock by Storage Type
-
On-Time Shipment % by Storage Type
-
Storage Utilization % by Storage Type
As a result, warehouse managers identify underutilized or overloaded storage zones.
4. Warehouse Name Analysis: Which Warehouse Performs Better?
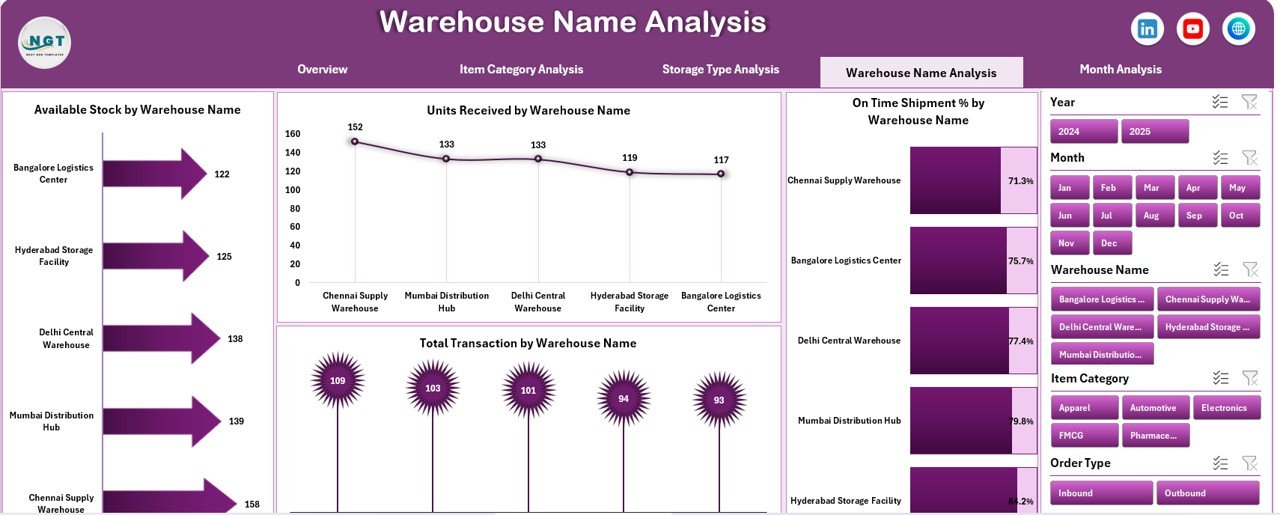
The Warehouse Name Analysis page compares performance across multiple warehouses.
Why Is Warehouse Comparison Necessary?
Organizations with multiple warehouses must identify top performers and underperformers. Therefore, this analysis supports benchmarking and corrective actions.
Charts Included on This Page
The page displays:
-
Units Received by Warehouse Name
-
On-Time Shipment % by Warehouse Name
-
Available Stock by Warehouse Name
-
Total Transactions by Warehouse Name
With these insights, leadership teams improve resource allocation and process consistency.
5. Month Analysis: How Do Warehouse Trends Change Over Time?
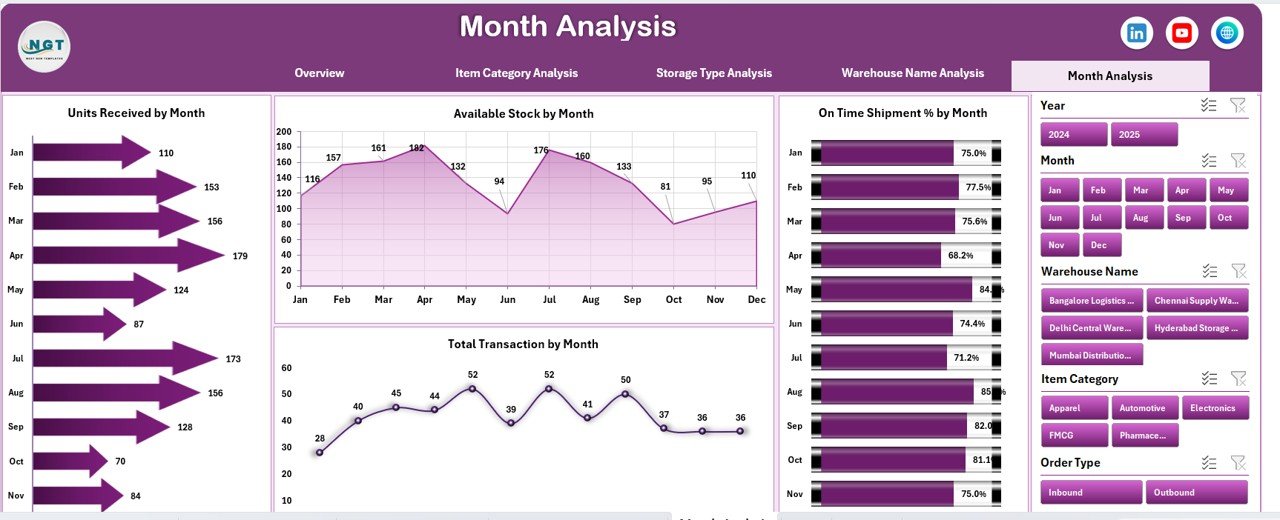
The Month Analysis page tracks warehouse activity across months.
Why Is Monthly Analysis Important?
Warehouse demand fluctuates due to seasonality, promotions, and market trends. Therefore, month-wise analysis supports forecasting and capacity planning.
Charts on the Month Analysis Page
This page includes:
-
Units Received by Month
-
On-Time Shipment % by Month
-
Available Stock by Month
-
Total Transactions by Month
As a result, planners anticipate future demand more accurately.
Support and Data Sheets: How Does the Dashboard Stay Organized?
Data Sheet
The Data Sheet stores all transactional warehouse data in a structured tabular format. This sheet acts as the backbone of the dashboard.
Support Sheet
The Support Sheet manages helper tables, calculations, and slicer connections. Because of this separation, the dashboard remains clean and easy to maintain.
Advantages of Warehousing Dashboard in Excel
A Warehousing Dashboard in Excel offers several operational and strategic advantages.
Centralized Reporting
All warehouse KPIs appear in one place, which reduces confusion and duplication.
Improved Decision-Making
Visual insights help managers take faster and more confident decisions.
Time Savings
Automation reduces manual report preparation time significantly.
Cost-Effective Solution
Excel dashboards eliminate the need for expensive BI tools.
User-Friendly Design
Even non-technical users can operate and update the dashboard easily.
Scalable Structure
Users can add more KPIs, warehouses, or time periods without redesigning the dashboard.
Who Should Use a Warehousing Dashboard in Excel?
This dashboard suits a wide range of users:
-
Warehouse Managers
-
Supply Chain Analysts
-
Operations Heads
-
Inventory Planners
-
Logistics Teams
-
Business Owners
-
Consultants and Analysts
Because Excel remains widely used, adoption stays fast and smooth.
Best Practices for the Warehousing Dashboard in Excel
Click to Purchases Warehousing Dashboard in Excel
To maximize value, follow these best practices.
Keep Data Clean and Consistent
Always use standardized naming for item categories, warehouses, and storage types.
Update Data Regularly
Frequent updates ensure insights remain accurate and actionable.
Use Slicers Wisely
Avoid cluttering the dashboard with too many filters. Instead, focus on meaningful slicers.
Focus on Actionable KPIs
Track only those metrics that drive operational improvements.
Validate KPIs Periodically
Review KPI definitions regularly to ensure alignment with business goals.
Protect Critical Sheets
Lock formulas and pivot structures to avoid accidental changes.
How Does a Warehousing Dashboard in Excel Improve Operational Efficiency?
This dashboard improves efficiency by:
-
Highlighting shipment delays early
-
Improving storage utilization planning
-
Reducing stock-out risks
-
Optimizing transaction flow
-
Supporting data-driven workforce planning
As a result, warehouse operations become predictable and controlled.
Conclusion: Why a Warehousing Dashboard in Excel Is a Must-Have Tool
A Warehousing Dashboard in Excel transforms raw warehouse data into actionable insights. Instead of reacting to problems late, teams identify issues early and act quickly.
Because this dashboard includes structured pages, intuitive slicers, KPI cards, and pivot-based visuals, it supports daily operations as well as long-term planning.
If your warehouse relies on Excel, this dashboard becomes a powerful upgrade that delivers clarity, speed, and confidence.
Frequently Asked Questions (FAQs)
What is a Warehousing Dashboard in Excel used for?
A Warehousing Dashboard in Excel tracks warehouse KPIs such as inventory levels, shipment performance, storage utilization, and transaction volumes in one interactive view.
Can small businesses use a Warehousing Dashboard in Excel?
Yes. Small and mid-sized businesses benefit greatly because Excel dashboards remain affordable and easy to manage.
Does this dashboard require advanced Excel skills?
No. Basic knowledge of Excel filters and pivot tables is enough to use the dashboard.
Can I customize the dashboard?
Yes. Users can add KPIs, charts, warehouses, or time periods easily.
How often should warehouse data be updated?
Daily or weekly updates work best, depending on transaction volume.
Can this dashboard handle multiple warehouses?
Yes. The Warehouse Name Analysis page supports multi-warehouse comparisons effectively.
Is this dashboard suitable for reporting to management?
Absolutely. The overview KPIs and visual charts make it ideal for executive reporting.
Visit our YouTube channel to learn step-by-step video tutorials
Click to Purchases Warehousing Dashboard in Excel