Managing vacation rental properties has become more competitive than ever. Property owners, Airbnb hosts, and vacation rental managers must track bookings, occupancy, revenue, and guest satisfaction regularly. However, many still rely on scattered spreadsheets and manual tracking. As a result, they miss trends, lose revenue opportunities, and struggle to control performance.
That is exactly why a Vacation Rentals KPI Dashboard in Excel delivers real value.
This ready-to-use Excel dashboard transforms raw rental data into clear, actionable, and performance-driven insights. Moreover, it allows property managers to monitor Month-to-Date (MTD), Year-to-Date (YTD), Target vs Actual, and Previous Year comparisons instantly.
In this detailed guide, you will learn:
- What a Vacation Rentals KPI Dashboard in Excel is
- How it works
- Its worksheet structure
- Key features
- Advantages
- Best practices
- Frequently asked questions
By the end of this article, you will clearly understand how this Excel dashboard can improve rental performance, increase occupancy, and boost profitability.
Click to buy Vacation Rentals KPI Dashboard in Excel
What Is a Vacation Rentals KPI Dashboard in Excel?
A Vacation Rentals KPI Dashboard in Excel is a structured performance tracking system designed to monitor key performance indicators related to short-term rental properties.
Instead of checking multiple files, you can:
- Track occupancy rate
- Monitor average daily rate (ADR)
- Measure revenue performance
- Compare actual vs target numbers
- Analyze previous year performance
- Review MTD and YTD trends
- Identify underperforming properties
Because the dashboard updates automatically based on selected month inputs, it allows managers to make faster decisions.
Why Do Vacation Rental Businesses Need a KPI Dashboard?
Vacation rentals operate in a seasonal and highly competitive market. Therefore, tracking performance manually can cause delays and confusion.
Without a KPI dashboard, you may face:
- Inconsistent reporting
- Poor revenue forecasting
- Low occupancy visibility
- Missed revenue targets
- Difficulty comparing previous year trends
- Slow decision-making
However, when you use a structured Excel KPI dashboard, you gain clarity and control. Moreover, you can quickly detect performance gaps and act immediately.
Structure of the Vacation Rentals KPI Dashboard in Excel
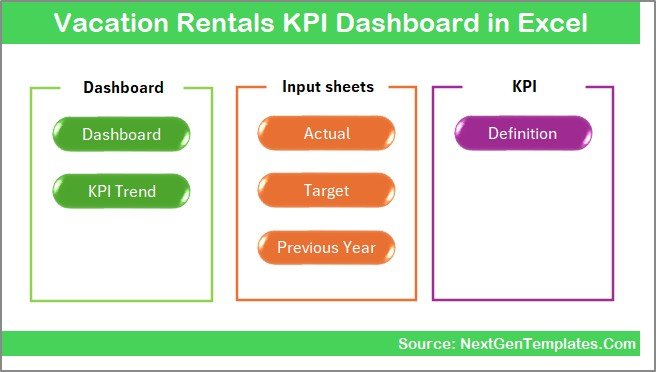
This dashboard contains 7 structured worksheets, each designed to serve a specific purpose. Together, they create a complete performance monitoring system.
Summary Page – Your Navigation Center
The Summary sheet acts as an index page.
Key Highlights:
- 6 navigation buttons
- One-click access to all worksheets
- Clean and structured layout
- Easy movement between sheets
Because of these quick navigation buttons, users save time and avoid confusion.
Click to buy Vacation Rentals KPI Dashboard in Excel
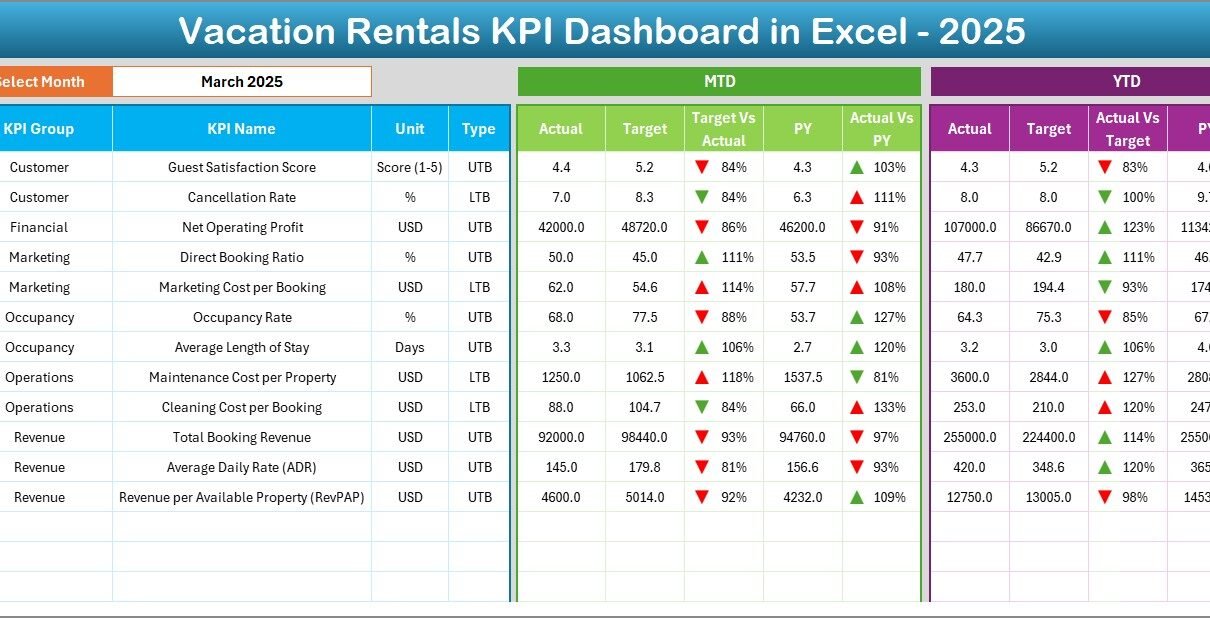
Dashboard Sheet – The Main Performance View
The Dashboard sheet serves as the core of the entire system.
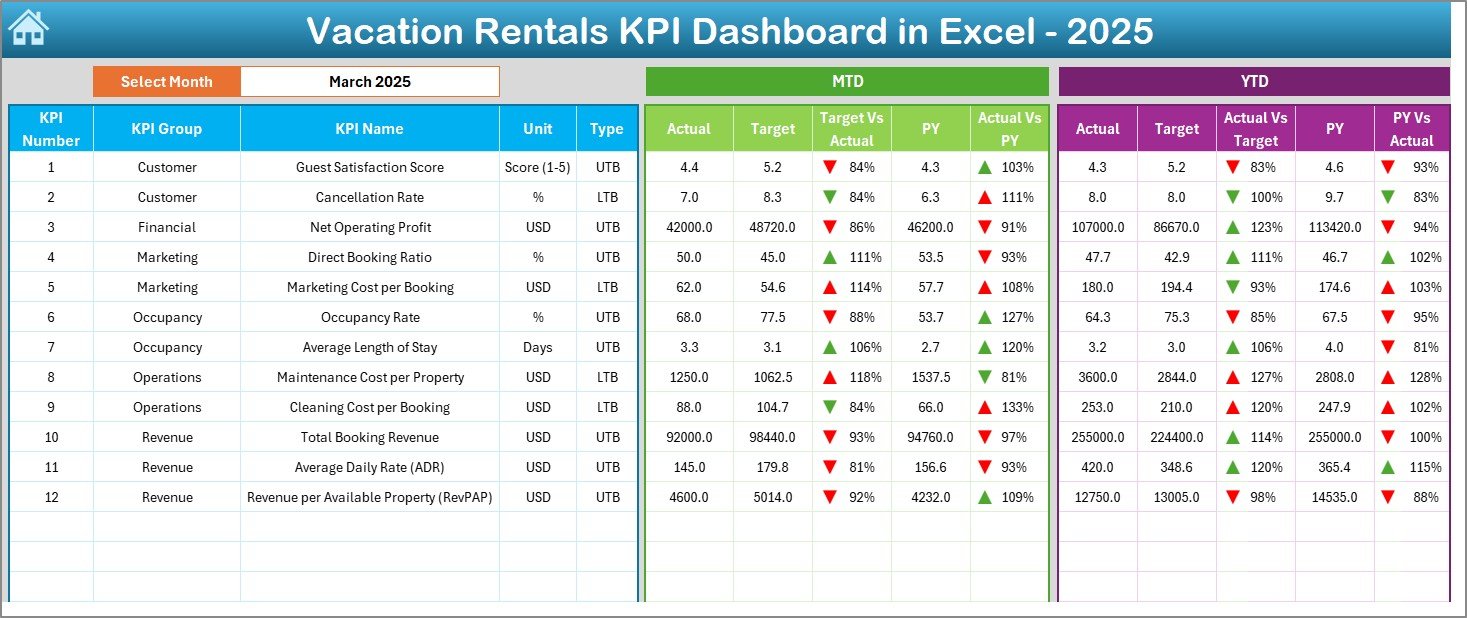
Month Selection Feature
On Range D3, users can select the month from a drop-down menu. As soon as they select a month:
- The entire dashboard updates instantly
- MTD and YTD data refresh automatically
- Target vs Actual comparisons change dynamically
This dynamic feature ensures accurate monthly performance tracking.
What Does the Dashboard Display?
The dashboard shows:
MTD Analysis
- MTD Actual
- MTD Target
- MTD Previous Year
- Target vs Actual %
- PY vs Actual %
- Conditional formatting with up/down arrows
YTD Analysis
- YTD Actual
- YTD Target
- YTD Previous Year
- Target vs Actual %
- PY vs Actual %
- Conditional formatting indicators
Because of conditional formatting arrows, users can quickly identify:
- Performance improvement
- Performance decline
- Target achievement gaps
As a result, managers can make fast decisions without analyzing raw numbers.
Click to buy Vacation Rentals KPI Dashboard in Excel
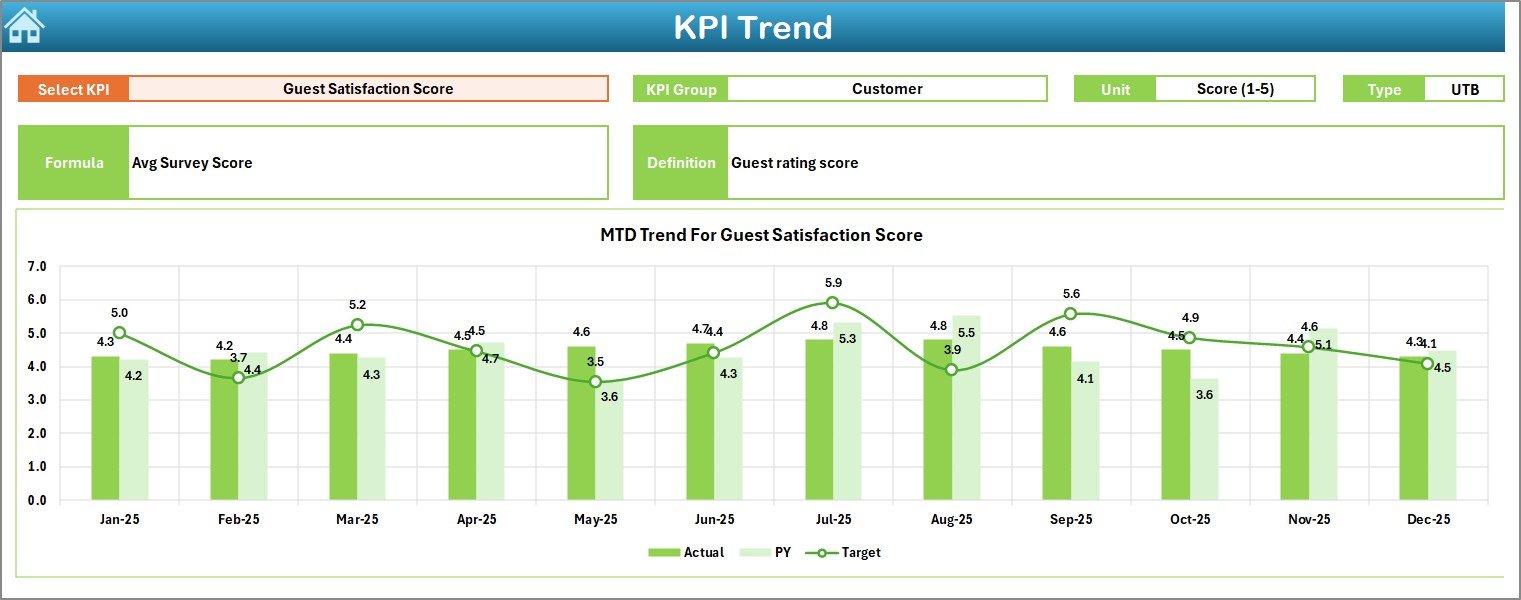
Trend Sheet – Detailed KPI Performance Trends
The Trend sheet provides deep KPI-level analysis.
KPI Selection
Users can select a KPI from the dropdown available at Range C3.
After selection, the dashboard displays:
- KPI Group
- Unit of KPI
- Type (Lower the Better or Upper the Better)
- Formula
- KPI Definition
This structured layout ensures clarity and understanding.
Trend Charts Display
The sheet also shows:
- MTD Trend Chart (Actual, Target, PY)
- YTD Trend Chart (Actual, Target, PY)
Therefore, managers can analyze patterns and seasonal trends easily.
For example:
- Occupancy Rate may rise during holiday seasons.
- Cancellation Rate may increase during off-season months.
- ADR may fluctuate based on demand.
Because of visual trend charts, decision-making becomes proactive rather than reactive.
Click to buy Vacation Rentals KPI Dashboard in Excel
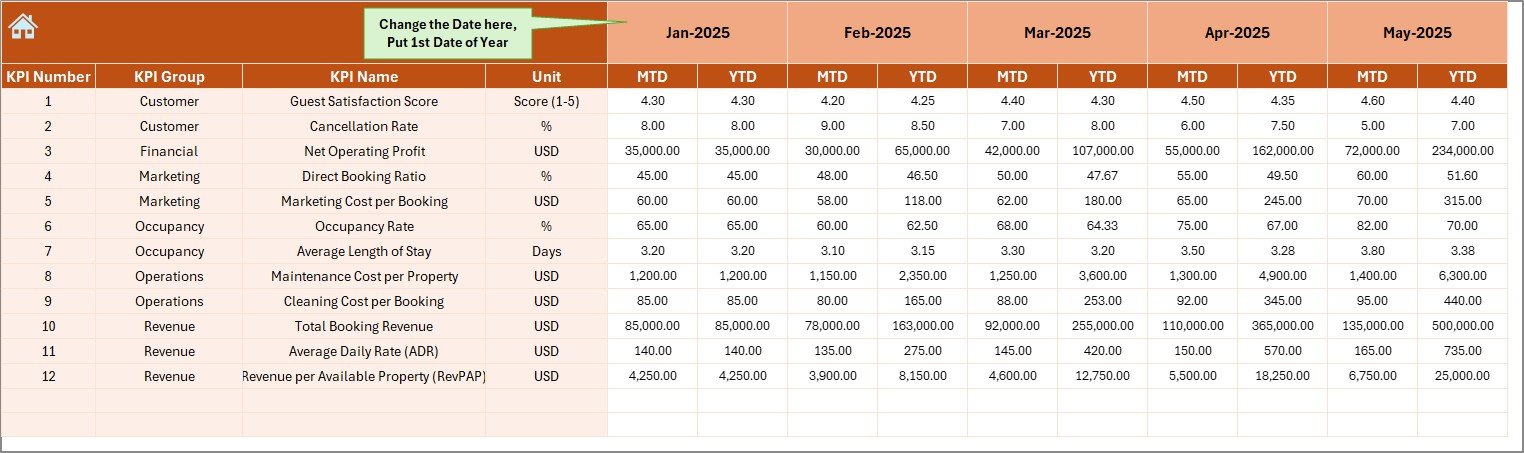
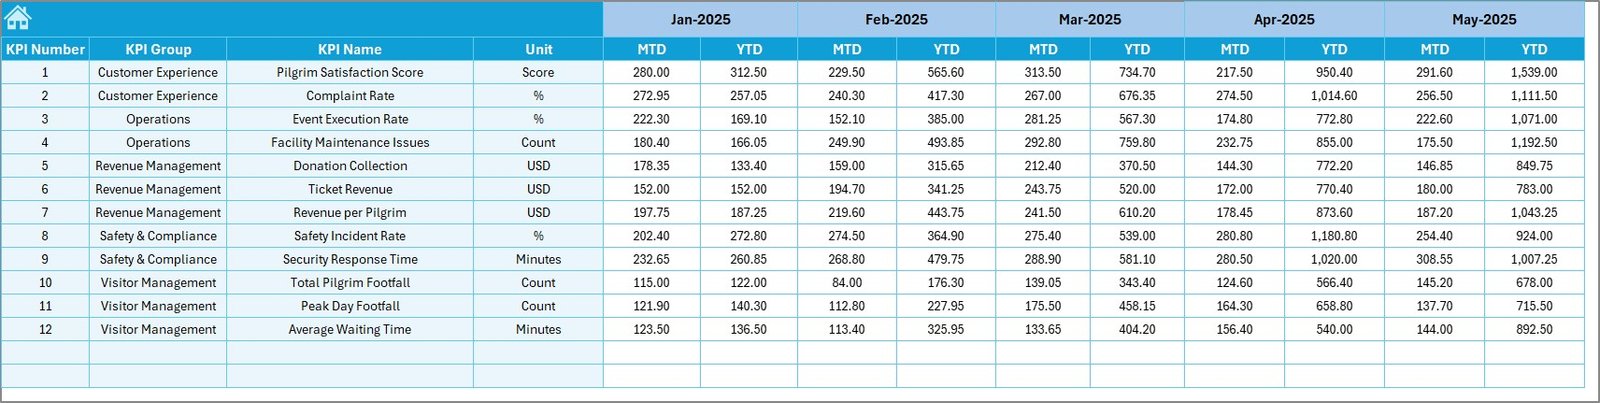
Actual Numbers Input Sheet – Data Entry Section
This sheet allows users to input actual performance data.
How It Works:
- Set the first month of the year in Range E1
- Enter MTD and YTD actual numbers
- Data automatically connects to dashboard
This structured input method ensures accuracy and consistency.
Click to buy Vacation Rentals KPI Dashboard in Excel
Target Sheet – Monthly and Yearly Targets
In this sheet, users enter:
- Monthly MTD target values
- YTD target values for each KPI
Because targets drive performance, this sheet plays a critical role in performance monitoring.
Click to buy Vacation Rentals KPI Dashboard in Excel
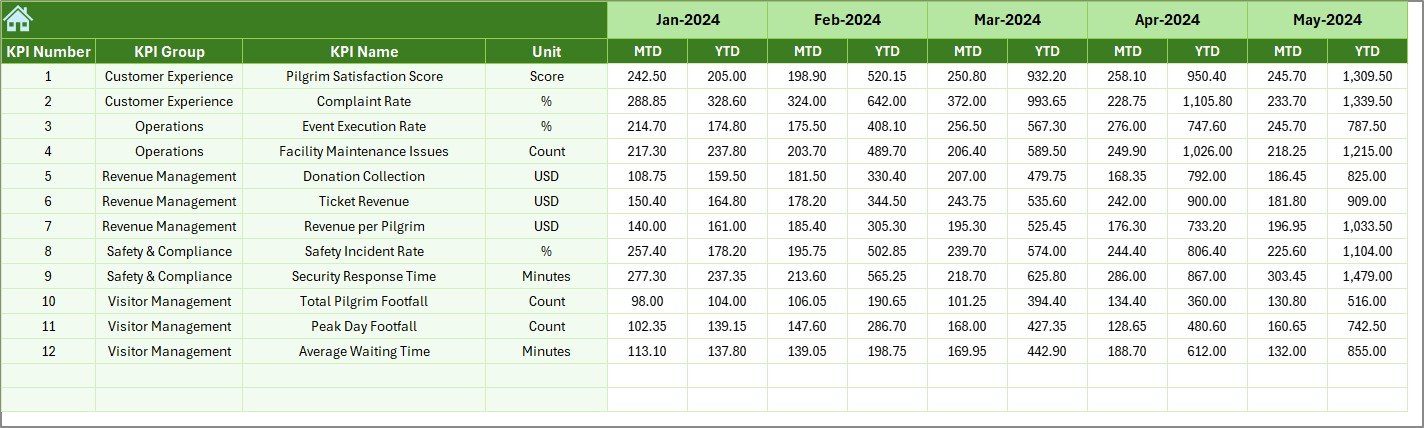
Previous Year Number Sheet – Historical Comparison
Here, users enter last year’s data.
The dashboard then compares:
- Current year vs Previous year
- Growth %
- Decline %
As a result, businesses understand whether they are improving or declining.
Click to buy Vacation Rentals KPI Dashboard in Excel
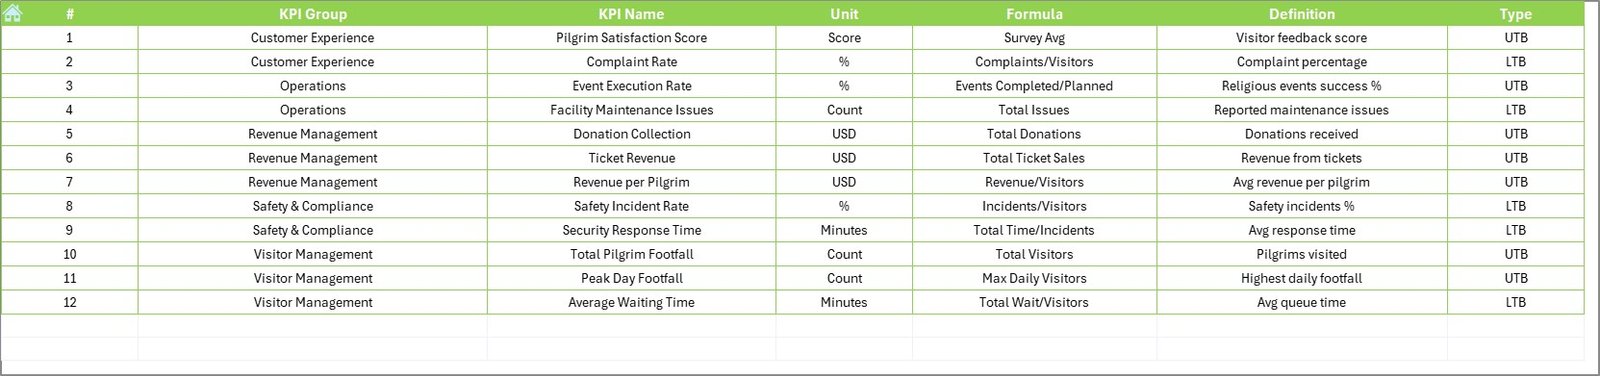
KPI Definition Sheet – Structured KPI Library
This sheet stores:
- KPI Name
- KPI Group
- Unit
- Formula
- Definition
This sheet ensures clarity and standardization.
Click to buy Vacation Rentals KPI Dashboard in Excel
Key KPIs for Vacation Rentals KPI Dashboard
A powerful vacation rental dashboard should track:
- Occupancy Rate
- Average Daily Rate (ADR)
- Revenue
- RevPAR
- Booking Conversion Rate
- Cancellation Rate
- Guest Satisfaction Score
- Cleaning Cost per Booking
- Maintenance Cost
- Average Length of Stay
- Revenue Growth %
- Cost per Acquisition
These KPIs allow full performance visibility.
Advantages of Vacation Rentals KPI Dashboard in Excel
A structured Excel KPI dashboard provides multiple benefits.
Improved Revenue Control
You can monitor revenue daily, monthly, and yearly. Moreover, you can quickly compare actual vs target performance.
Better Occupancy Management
You can identify low occupancy months and adjust pricing strategies.
Quick Performance Comparison
Because the dashboard compares previous year data, you instantly see growth or decline.
Clear Target Tracking
Conditional formatting arrows highlight whether you meet or miss targets.
Easy Data Entry
Separate input sheets ensure clean and structured data management.
Strong Decision-Making Support
Instead of guessing, managers rely on numbers and trends.
Professional Reporting
The dashboard creates ready-to-present performance reports.
How Does the Month Selection Feature Improve Analysis?
The month dropdown in D3 drives dynamic analysis.
Once you select a month:
- All KPI numbers update
- MTD and YTD values refresh
- Performance arrows adjust
- Trends align with selected month
Therefore, you eliminate manual filtering.
How Does Conditional Formatting Improve Clarity?
The dashboard uses up and down arrows.
- Green Arrow → Performance improvement
- Red Arrow → Performance decline
Because visual indicators stand out, managers identify issues instantly.
How to Use Vacation Rentals KPI Dashboard Effectively?
To get maximum value:
- Enter accurate monthly data
- Update targets regularly
- Review trend sheet weekly
- Compare performance with previous year
- Monitor underperforming KPIs
Consistency drives success.
Best Practices for the Vacation Rentals KPI Dashboard in Excel
To ensure accurate performance monitoring, follow these best practices:
Standardize KPI Definitions
Keep KPI formulas consistent across all properties.
Update Data Monthly
Enter data at month-end without delay.
Use Realistic Targets
Avoid unrealistic targets. Instead, base them on past performance.
Monitor Seasonal Trends
Vacation rentals depend on seasonality. Therefore, review YTD trends regularly.
Train Your Team
Ensure that property managers understand KPI meaning and dashboard usage.
Validate Data Accuracy
Double-check actual and previous year entries before analysis.
Review Performance Meetings Monthly
Discuss dashboard insights with stakeholders.
Who Should Use This Dashboard?
This Excel dashboard suits:
- Airbnb Hosts
- Property Managers
- Vacation Rental Agencies
- Resort Operators
- Hospitality Consultants
- Short-Term Rental Investors
If you manage rental properties, this dashboard supports data-driven decisions.
How Does This Dashboard Improve Profitability?
The dashboard increases profitability in several ways:
- Identifies low occupancy periods
- Highlights high cancellation trends
- Tracks revenue leakage
- Controls cleaning and maintenance costs
- Improves pricing strategy
- Encourages data-driven decisions
As a result, rental managers maximize income and reduce waste.
Why Choose Excel for Vacation Rental KPI Tracking?
Excel remains powerful because:
- It offers flexibility
- It supports dynamic formulas
- It allows conditional formatting
- It provides trend charts
- It enables easy customization
- It requires no advanced technical skills
Therefore, businesses of all sizes can use it confidently.
Conclusion
Vacation rental businesses must operate efficiently in a competitive market. However, manual tracking limits growth and hides performance gaps.
The Vacation Rentals KPI Dashboard in Excel solves this challenge by offering:
- Structured worksheets
- Dynamic month selection
- MTD and YTD tracking
- Target vs Actual comparison
- Previous Year analysis
- Conditional formatting indicators
- Clear KPI definitions
- Easy data input structure
Because this dashboard organizes performance data professionally, it empowers managers to increase revenue, improve occupancy, and optimize costs.
If you want better visibility, stronger control, and improved profitability, this Excel KPI dashboard provides the perfect solution.
Frequently Asked Questions (FAQs)
What is a Vacation Rentals KPI Dashboard in Excel?
It is a structured Excel tool that tracks occupancy, revenue, targets, and previous year comparisons for vacation rental businesses.
Can I customize the KPIs in this dashboard?
Yes. You can modify KPI names, formulas, and definitions in the KPI Definition sheet.
Does the dashboard update automatically?
Yes. Once you select a month from the dropdown and enter data correctly, the dashboard updates automatically.
Can I track multiple properties?
Yes. You can add property-level KPIs and expand the dashboard structure.
Do I need advanced Excel skills?
No. Basic Excel knowledge allows you to use this dashboard effectively.
How often should I update the dashboard?
You should update it monthly. However, you can update it weekly if needed.
Is this dashboard suitable for Airbnb hosts?
Yes. Airbnb hosts can track occupancy, revenue, and booking trends easily.
How does it help improve revenue?
It highlights performance gaps, target misses, and seasonal trends. Therefore, you can adjust pricing and marketing strategies accordingly.
Visit our YouTube channel to learn step-by-step video tutorials
Watch the step-by-step video tutorial:
Click to buy Vacation Rentals KPI Dashboard in Excel