Event planning demands precision. Deadlines move fast. Budgets shift quickly. Client expectations remain high. Moreover, vendors, venues, sponsors, and attendees all depend on smooth coordination.
However, many event planners still track performance using scattered spreadsheets. As a result, they miss budget gaps. They overlook attendance trends. They struggle to compare targets with actual performance.
So, how can you monitor event revenue, cost control, attendee satisfaction, vendor performance, and marketing effectiveness in one organized system?
The answer is simple.
You need an Event Planning KPI Scorecard in Excel.
In this complete guide, you will learn:
-
What an Event Planning KPI Scorecard in Excel is
-
Why event organizers need it
-
Detailed explanation of all 4 worksheets
-
Important KPIs for event management
-
Advantages of Event Planning KPI Scorecard in Excel
-
Best Practices for the Event Planning KPI Scorecard
-
Frequently Asked Questions with Answers
Let us explore everything step by step.
Click to Purchases Event Planning KPI Scorecard in Excel
What Is an Event Planning KPI Scorecard in Excel?
An Event Planning KPI Scorecard in Excel is a ready-to-use performance tracking tool designed specifically for event management businesses.
It allows you to:
-
Track financial performance
-
Monitor operational efficiency
-
Measure attendee satisfaction
-
Compare actual vs target values
-
Analyze Month-to-Date (MTD) and Year-to-Date (YTD) trends
Instead of relying on manual reports, you can use one structured dashboard to evaluate event performance clearly.
Moreover, Excel offers flexibility and automation. Therefore, you can customize the scorecard for corporate events, weddings, conferences, exhibitions, and festivals.
Why Do Event Planners Need a KPI Scorecard?
Event planning involves multiple moving parts. Budgets, marketing campaigns, registrations, vendor payments, and logistics must align perfectly.
If you do not track performance metrics, you may face:
-
Budget overruns
-
Low attendance
-
Vendor delays
-
Poor customer satisfaction
-
Revenue loss
Additionally, clients expect measurable results. Therefore, you must provide structured performance reports.
A KPI Scorecard helps you:
-
Identify financial gaps early
-
Improve attendee experience
-
Control event costs
-
Increase marketing ROI
-
Strengthen decision-making
In short, it transforms raw event data into meaningful insights.
Click to Purchases Event Planning KPI Scorecard in Excel
What Are the Key Features of the Event Planning KPI Scorecard in Excel?
This ready-to-use template includes 4 powerful worksheets:
-
Scorecard Sheet
-
KPI Trend Sheet
-
Input Data Sheet
-
KPI Definition Sheet
Let us understand each worksheet in detail.
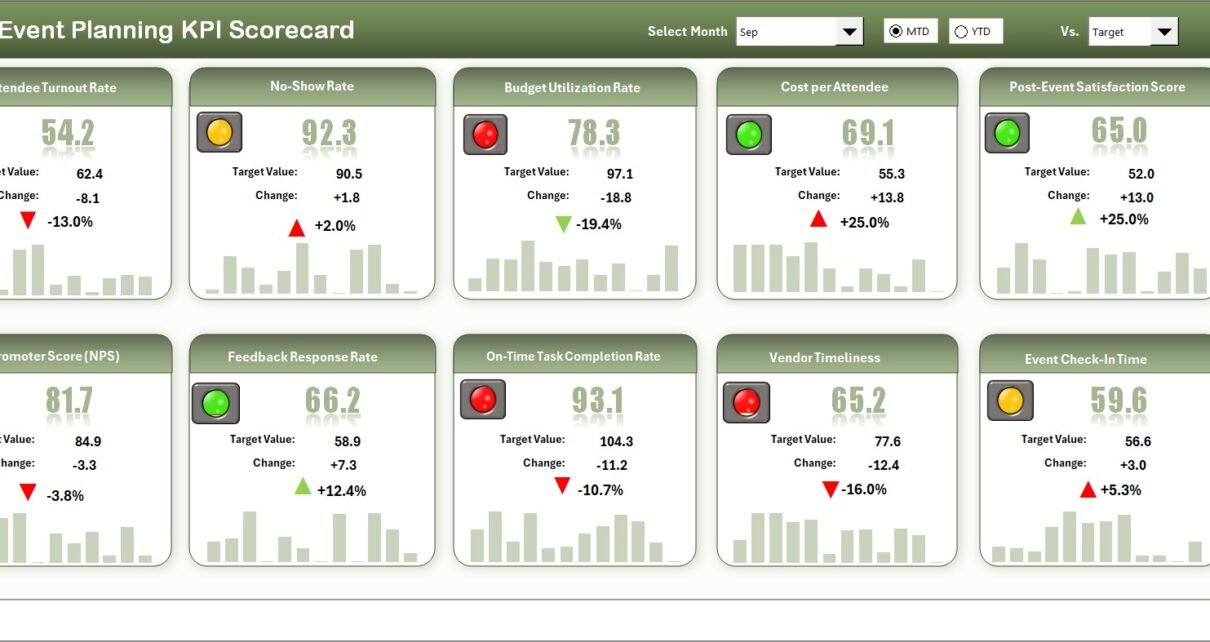
1️⃣ Scorecard Sheet – Main Event Performance Dashboard
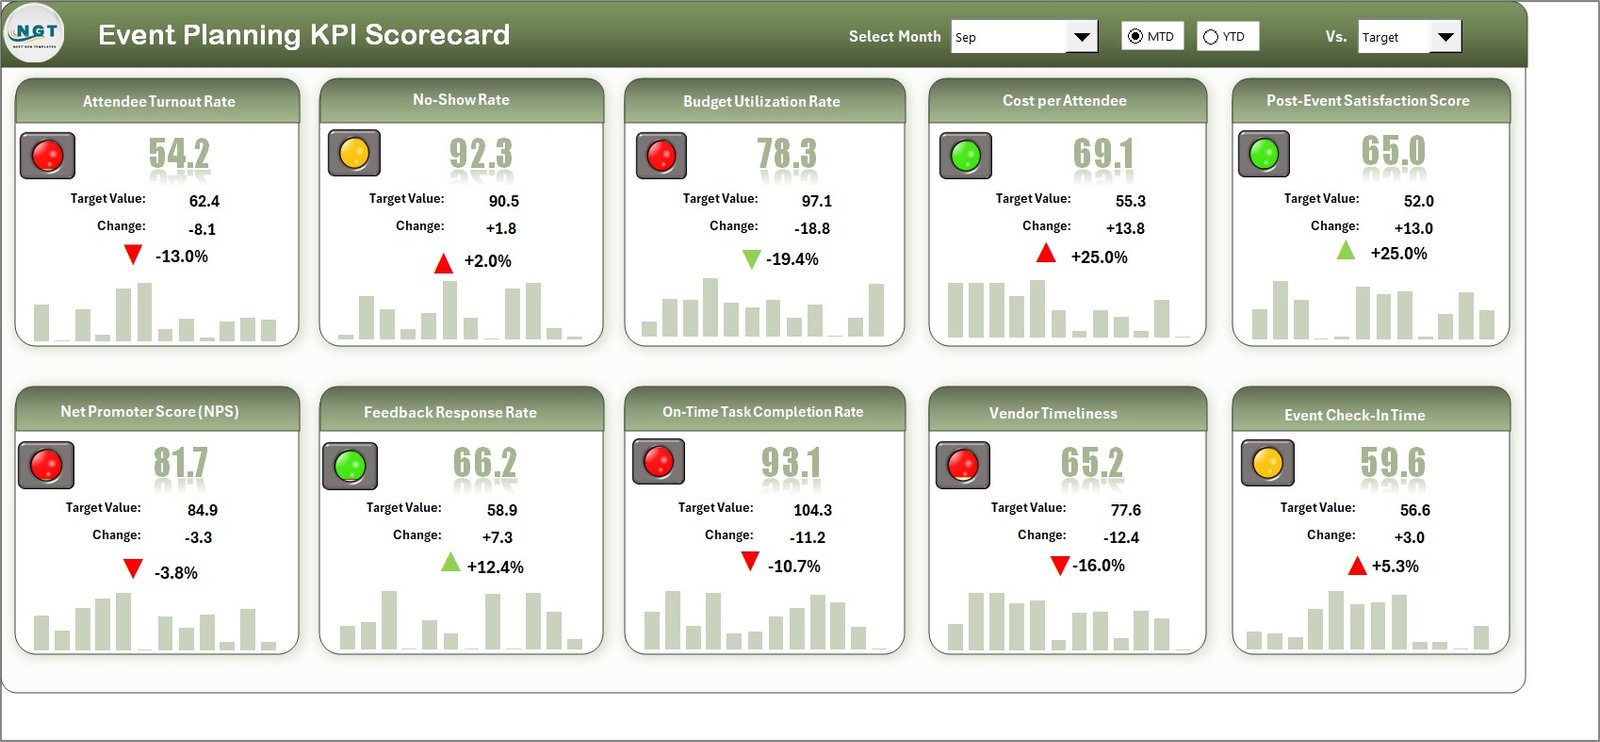
The Scorecard Sheet serves as the central interface where you can view all KPIs at once.
Key Features
✔ Dropdown Menus
You can select:
-
Month
-
MTD (Month-to-Date)
-
YTD (Year-to-Date)
Once you make a selection, the dashboard updates automatically.
✔ Actual vs Target Values
You can compare:
-
Actual event performance
-
Planned targets
-
Previous Year (PY) results
Therefore, you can identify performance gaps instantly.
✔ Visual Indicators
The template uses:
-
Color-coded status indicators
-
Conditional formatting
-
Up and down arrows
As a result, managers can quickly understand whether KPIs improve or decline.
✔ Comprehensive KPI Overview
The dashboard displays:
-
KPI Name
-
KPI Group
-
Unit
-
MTD results
-
YTD results
-
Variance
Thus, you gain full performance visibility.
Click to Purchases Event Planning KPI Scorecard in Excel
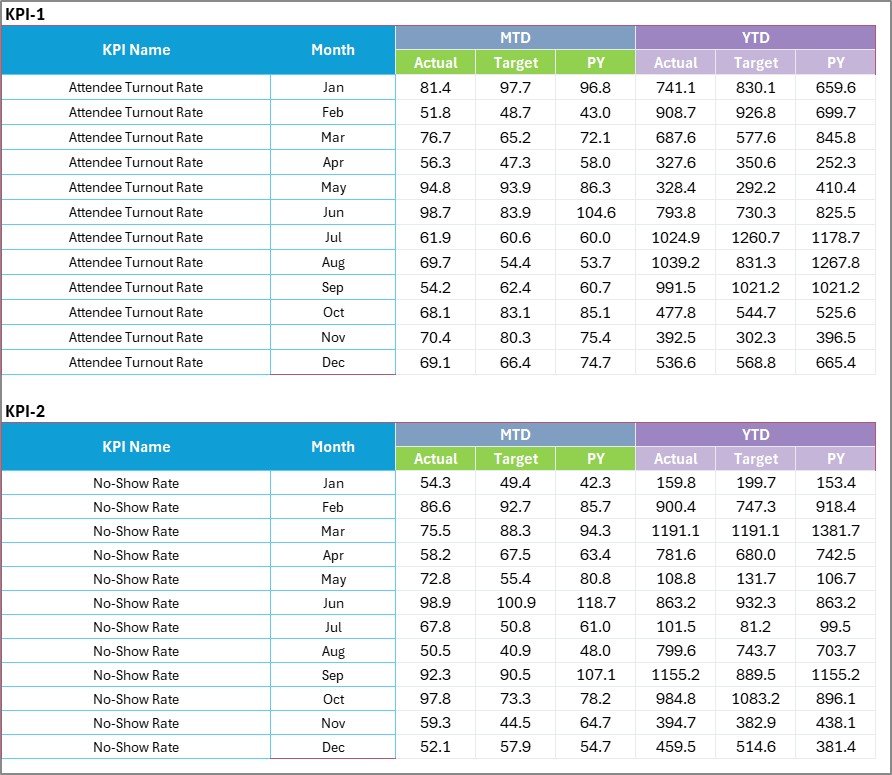
2️⃣ KPI Trend Sheet – Detailed KPI Analysis
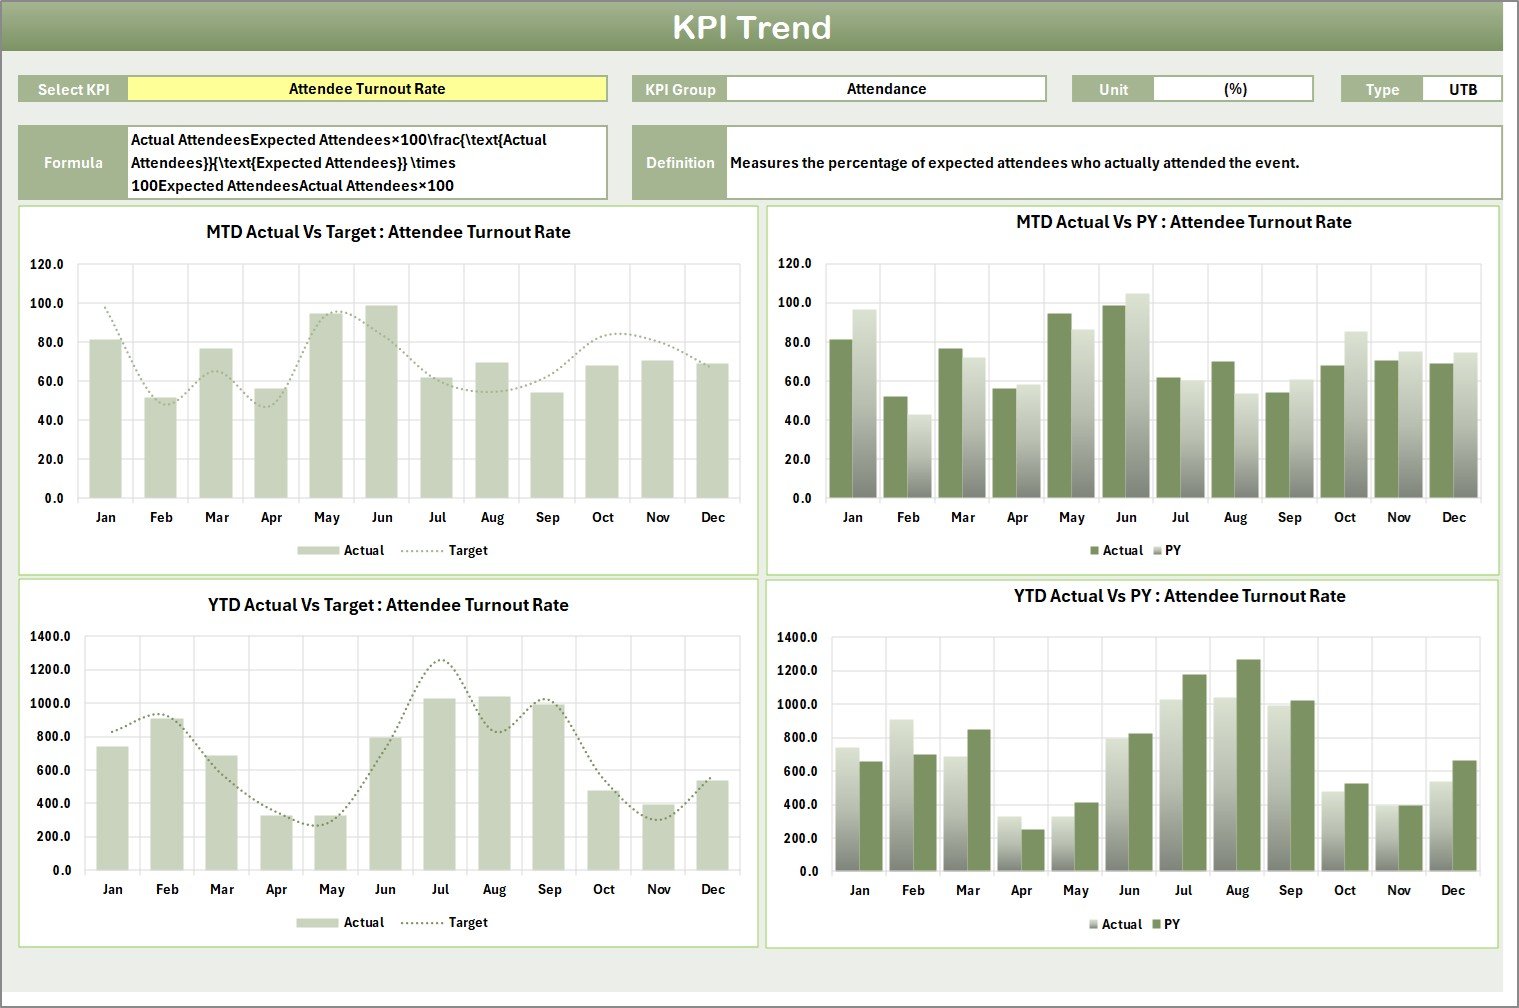
While the Scorecard Sheet shows summary results, the KPI Trend Sheet provides deeper analysis.
How Does It Work?
You can select the KPI name from the dropdown menu available in cell C3.
Once selected, the sheet displays:
-
KPI Group
-
Unit of KPI
-
KPI Type (Lower the Better or Upper the Better)
-
Formula
-
Definition
Additionally, you can view:
-
MTD Trend Chart
-
YTD Trend Chart
-
Actual vs Target vs Previous Year comparison
Therefore, you can analyze event performance trends over time.
For example, if attendee satisfaction declines for two consecutive months, you can review service quality immediately.
3️⃣ Input Data Sheet – Central Data Entry Area
The Input Data Sheet acts as the backbone of the scorecard.
What Can You Do Here?
-
Enter actual revenue
-
Record marketing expenses
-
Update attendee numbers
-
Track vendor costs
-
Set targets
Once you enter the data, the scorecard updates automatically.
Therefore, you always maintain current event performance insights.
Click to Purchases Event Planning KPI Scorecard in Excel
4️⃣ KPI Definition Sheet – Standardize Event Metrics
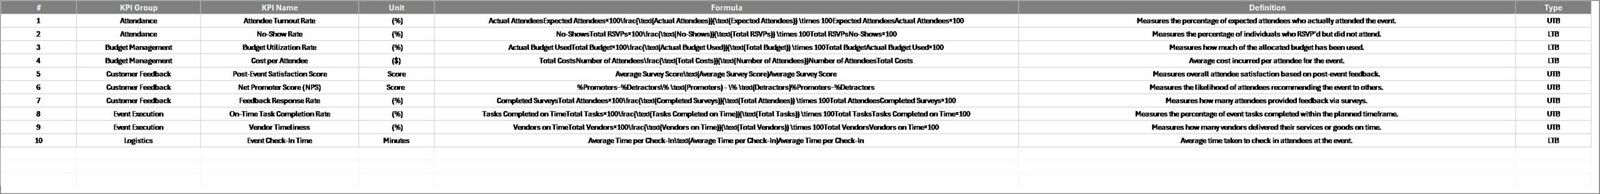
Clear KPI definitions prevent confusion.
In this sheet, you enter:
-
KPI Name
-
KPI Group
-
Unit
-
Formula
-
KPI Definition
For example:
-
Event ROI = (Net Profit / Total Event Cost) × 100
-
Registration Conversion Rate = (Confirmed Registrations / Total Leads) × 100
When you define KPIs clearly, your team works with consistent standards.
What Are the Most Important Event Planning KPIs?
Event management requires monitoring across financial, operational, marketing, and customer categories.
🔹 Financial KPIs
-
Total Event Revenue
-
Total Event Cost
-
Net Profit
-
Event ROI
-
Budget Variance
🔹 Marketing KPIs
-
Lead Conversion Rate
-
Cost per Lead
-
Social Media Engagement Rate
-
Email Open Rate
🔹 Operational KPIs
-
Vendor Performance Score
-
On-Time Setup Rate
-
Task Completion Rate
-
Registration Processing Time
🔹 Attendee KPIs
-
Total Registrations
-
Attendance Rate
-
Customer Satisfaction Score
-
Net Promoter Score (NPS)
Tracking these KPIs ensures event success and profitability.
Click to Purchases Event Planning KPI Scorecard in Excel
Advantages of Event Planning KPI Scorecard in Excel
Using a structured KPI scorecard provides multiple benefits.
1️⃣ Centralized Performance Monitoring
You can monitor all event metrics in one place.
2️⃣ Better Budget Control
You can track cost variance and prevent overspending.
3️⃣ Improved Decision Making
Real-time comparisons help you adjust strategies quickly.
4️⃣ Enhanced Client Reporting
You can present professional KPI reports to clients.
5️⃣ Increased Profitability
When you monitor revenue and cost carefully, profits improve.
6️⃣ Flexible Customization
You can add new KPIs based on event type.
Best Practices for the Event Planning KPI Scorecard
To achieve maximum value, follow these best practices.
✔ Define Clear KPIs Before the Event
Set measurable targets for revenue, attendance, and satisfaction.
✔ Update Data Regularly
Enter data weekly or monthly to maintain accuracy.
✔ Review Trends After Every Event
Analyze performance trends to improve future events.
✔ Align KPIs With Client Goals
Ensure that KPIs reflect client expectations.
✔ Use Visual Insights During Meetings
Present dashboard visuals in team discussions.
✔ Take Immediate Action on Negative Trends
If performance declines, implement corrective measures immediately.
Click to Purchases Event Planning KPI Scorecard in Excel
How Does This Scorecard Improve Event Success?
When you track event KPIs consistently:
-
You control budgets effectively
-
You improve attendee satisfaction
-
You enhance vendor coordination
-
You increase marketing efficiency
-
You strengthen overall event performance
Consequently, your events become more profitable and organized.
Conclusion
Event planning requires strategic monitoring. Without structured tracking, performance gaps remain hidden.
The Event Planning KPI Scorecard in Excel provides:
-
Centralized KPI monitoring
-
MTD and YTD comparison
-
Trend analysis
-
Visual performance indicators
-
Customizable structure
Instead of managing scattered spreadsheets, you can use one organized and efficient system.
If you want to deliver successful events consistently, this scorecard offers a practical and powerful solution.
Click to Purchases Event Planning KPI Scorecard in Excel
Frequently Asked Questions with Answers
1. What is an Event Planning KPI Scorecard?
It is an Excel-based tool that tracks financial, operational, and marketing performance metrics for events.
2. Can small event planners use this template?
Yes. Freelancers, agencies, and large companies can use it easily.
3. Does it support MTD and YTD analysis?
Yes. The template allows both Month-to-Date and Year-to-Date tracking.
4. Can I customize KPIs for different event types?
Yes. You can modify or add KPIs according to your event model.
5. Do I need advanced Excel skills?
No. Basic Excel knowledge is enough to operate the scorecard.
Click to Purchases Event Planning KPI Scorecard in Excel
Visit our YouTube channel to learn step-by-step video tutorials