Ceramic manufacturing requires precision. Production lines must run smoothly. Raw materials must meet quality standards. Kilns must operate efficiently. Moreover, inventory, cost control, and delivery schedules must align perfectly.
However, many ceramic manufacturers still track production, quality, and financial data using scattered spreadsheets. As a result, they struggle to compare monthly performance. They miss efficiency gaps. They fail to monitor trends properly.
So, how can you track production volume, rejection rate, fuel cost, revenue, machine utilization, and profit margin in one structured system?
The answer is simple.
You need a Ceramic Manufacturing KPI Dashboard in Excel.
In this complete guide, you will learn:
-
What a Ceramic Manufacturing KPI Dashboard in Excel is
-
Why ceramic factories need it
-
Detailed explanation of all 7 worksheets
-
Important KPIs for ceramic manufacturing
-
Advantages of Ceramic Manufacturing KPI Dashboard in Excel
-
Best Practices for the Ceramic Manufacturing KPI Dashboard
-
Frequently Asked Questions with Answers
Let us explore everything step by step.
Click to Purchases Ceramic Manufacturing KPI Dashboard in Excel
What Is a Ceramic Manufacturing KPI Dashboard in Excel?
A Ceramic Manufacturing KPI Dashboard in Excel is a ready-to-use performance monitoring system designed for ceramic production businesses.
It allows you to:
-
Track production performance
-
Compare Actual vs Target results
-
Analyze Month-to-Date (MTD) and Year-to-Date (YTD) numbers
-
Monitor Previous Year comparisons
-
View KPI trends visually
-
Maintain standardized KPI definitions
Instead of using multiple reports, you can manage all key metrics in one interactive Excel dashboard.
Moreover, Excel provides flexibility and automation. Therefore, plant managers and operations teams can easily customize the dashboard.
Why Do Ceramic Manufacturing Companies Need a KPI Dashboard?
Ceramic production involves multiple processes:
-
Raw material preparation
-
Mixing and shaping
-
Drying and glazing
-
Kiln firing
-
Quality inspection
-
Packaging and dispatch
If you do not track performance closely, you may face:
-
High rejection rates
-
Increased fuel consumption
-
Production delays
-
Inventory imbalance
-
Rising operational costs
Additionally, competition in the ceramic industry continues to grow. Therefore, manufacturers must control cost, improve efficiency, and maintain quality standards.
A KPI dashboard helps you:
-
Identify production bottlenecks
-
Monitor cost trends
-
Improve machine utilization
-
Reduce waste
-
Increase profitability
In short, it transforms production data into actionable insights.
Click to Purchases Ceramic Manufacturing KPI Dashboard in Excel
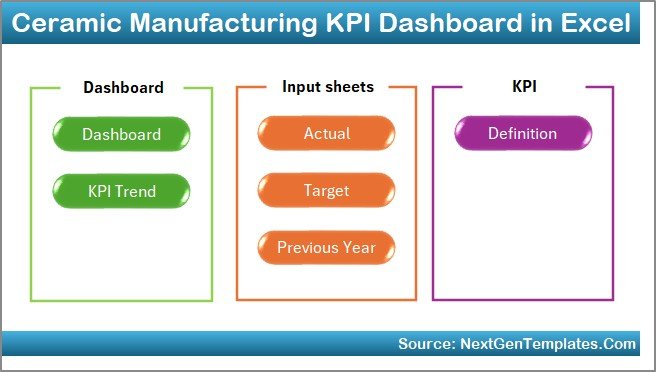
What Are the Key Features of the Ceramic Manufacturing KPI Dashboard in Excel?
This ready-to-use dashboard includes 7 structured worksheets:
-
Home Sheet
-
Dashboard Sheet
-
KPI Trend Sheet
-
Actual Numbers Input Sheet
-
Target Sheet
-
Previous Year Numbers Sheet
-
KPI Definition Sheet
Let us understand each sheet in detail.
1️⃣ Home Sheet – Central Navigation Hub
The Home sheet acts as an index page.
Here, you will find 6 navigation buttons that allow you to jump directly to the required worksheet.
Therefore, users can access reports quickly without scrolling through tabs.
Click to Purchases Ceramic Manufacturing KPI Dashboard in Excel
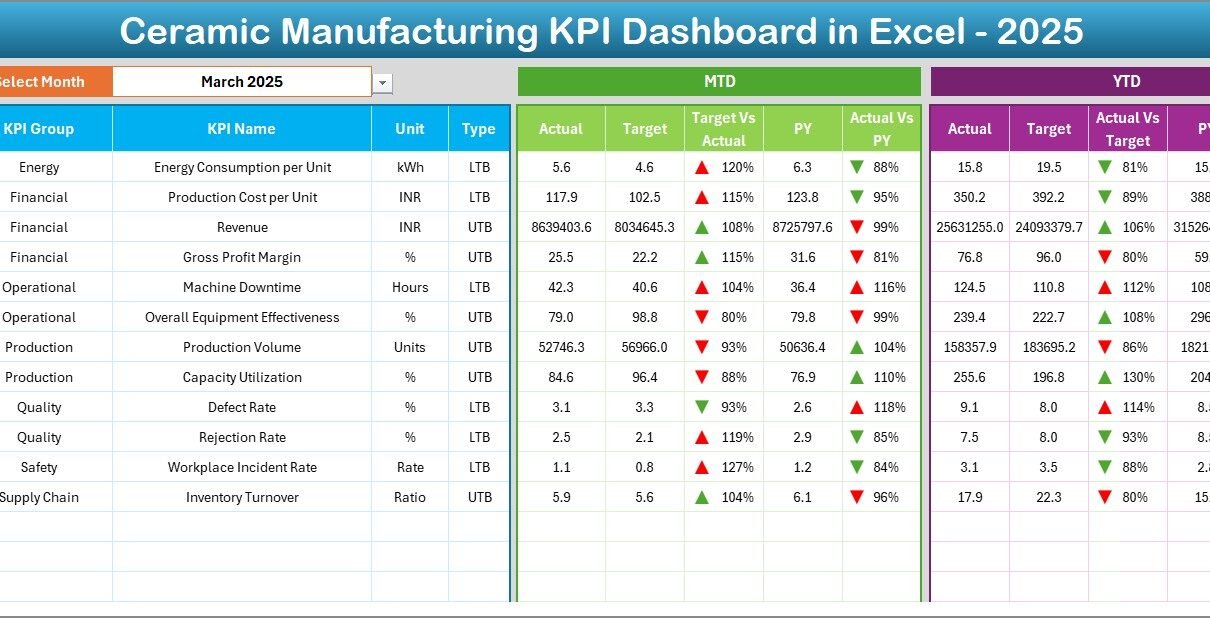
2️⃣ Dashboard Sheet – Main KPI Overview
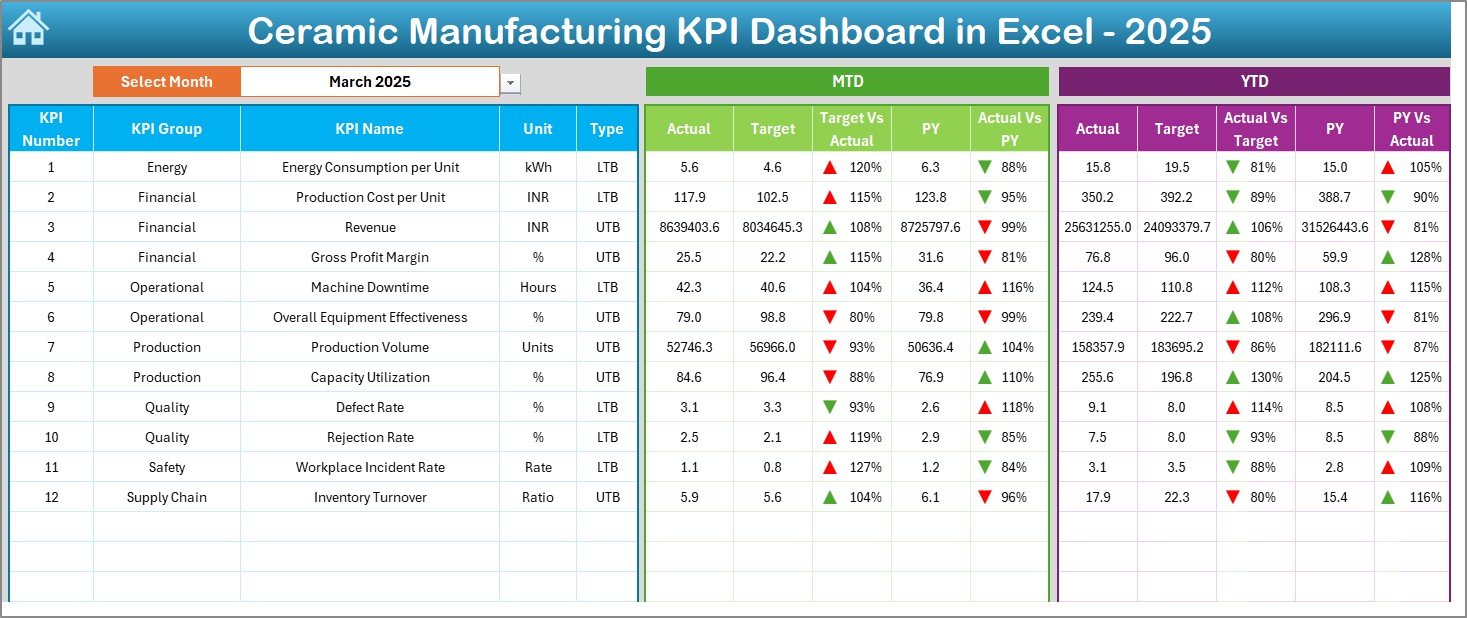
The Dashboard sheet serves as the main performance interface.
Month Selection
On range D3, you can select the month from a drop-down list. Once you select a month, the entire dashboard updates automatically.
MTD Analysis
The dashboard displays:
-
MTD Actual
-
MTD Target
-
MTD Previous Year
-
Target vs Actual
-
Previous Year vs Actual
Conditional formatting with up and down arrows highlights performance status.
YTD Analysis
Similarly, the dashboard shows:
-
YTD Actual
-
YTD Target
-
YTD Previous Year
-
Target vs Actual
-
Previous Year vs Actual
Therefore, management can monitor both short-term and long-term performance.
Click to Purchases Ceramic Manufacturing KPI Dashboard in Excel
3️⃣ KPI Trend Sheet – Detailed KPI Analysis
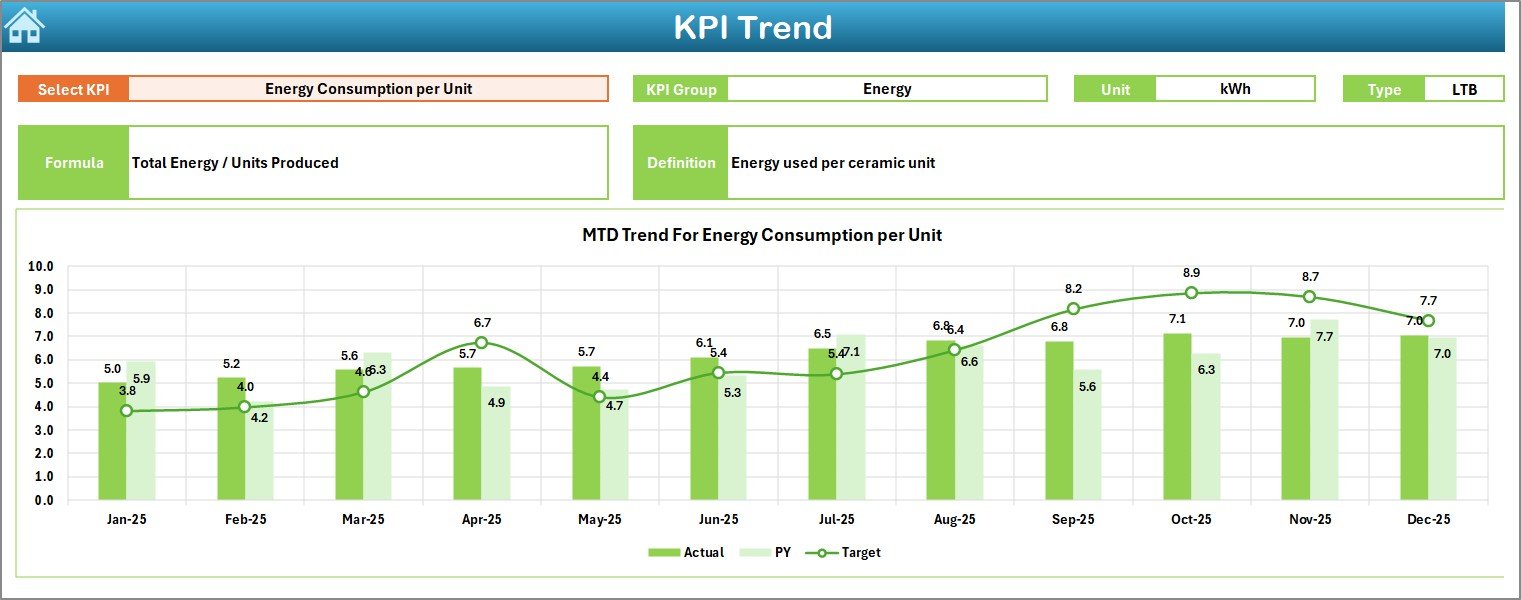
The KPI Trend sheet provides deep insights into individual KPIs.
You can select the KPI name from the drop-down available in cell C3.
Once selected, the sheet displays:
-
KPI Group
-
Unit of KPI
-
KPI Type (Lower the Better or Upper the Better)
-
Formula
-
Definition
Additionally, the sheet shows:
-
MTD Trend Chart
-
YTD Trend Chart
-
Actual vs Target vs Previous Year comparison
Therefore, you can analyze performance patterns across months.
For example, if fuel consumption increases gradually, you can investigate kiln efficiency.
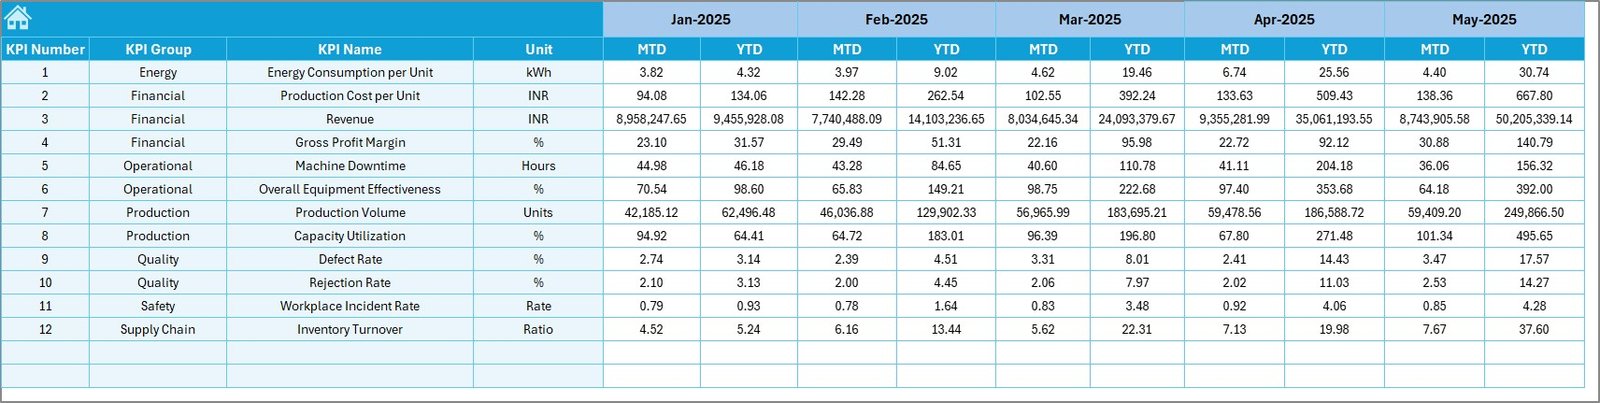
4️⃣ Actual Numbers Input Sheet – Current Data Entry
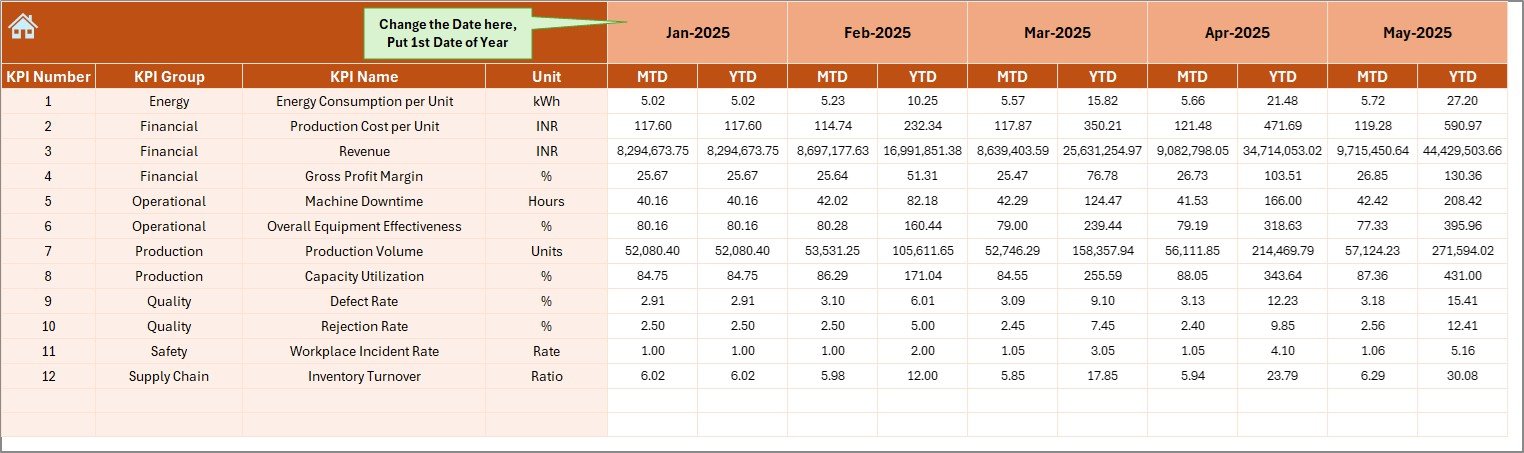
In this sheet, you enter actual performance numbers.
You can change the month from range E1. Simply enter the first month of the year in E1.
Then, input:
-
MTD actual numbers
-
YTD actual numbers
Once entered, the dashboard updates automatically.
Click to Purchases Ceramic Manufacturing KPI Dashboard in Excel
5️⃣ Target Sheet – Planned Performance Entry
In the Target sheet, you enter:
-
Monthly MTD targets
-
YTD targets
These targets help compare actual performance against planned goals.
Therefore, you can measure production efficiency and cost control accurately.
6️⃣ Previous Year Numbers Sheet – Historical Comparison
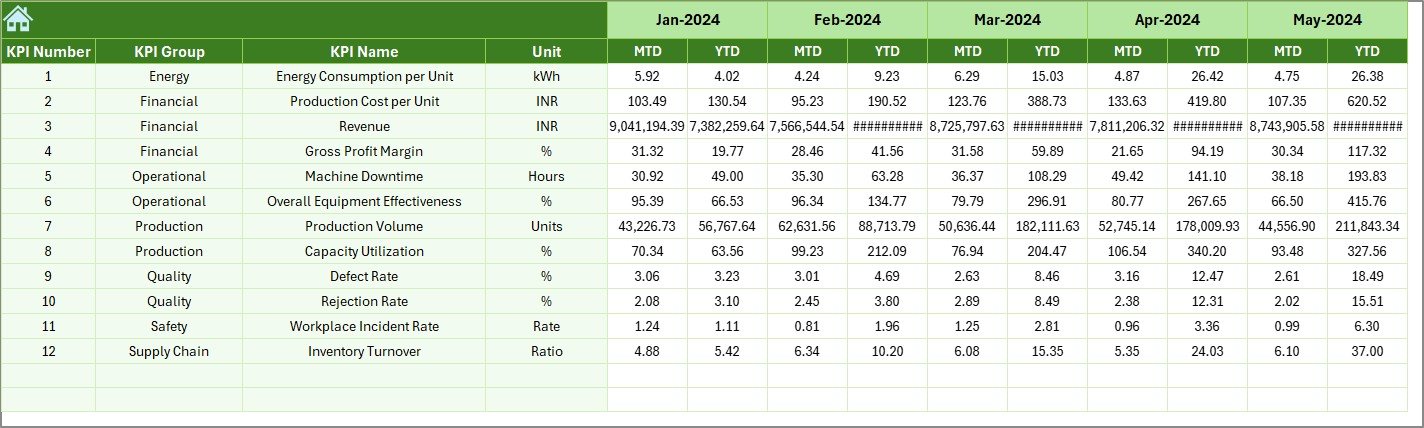
In this sheet, you enter last year’s performance data.
This allows you to:
-
Compare year-over-year growth
-
Analyze production improvement
-
Measure cost optimization
Historical comparison strengthens decision-making.
7️⃣ KPI Definition Sheet – Standardized Metrics
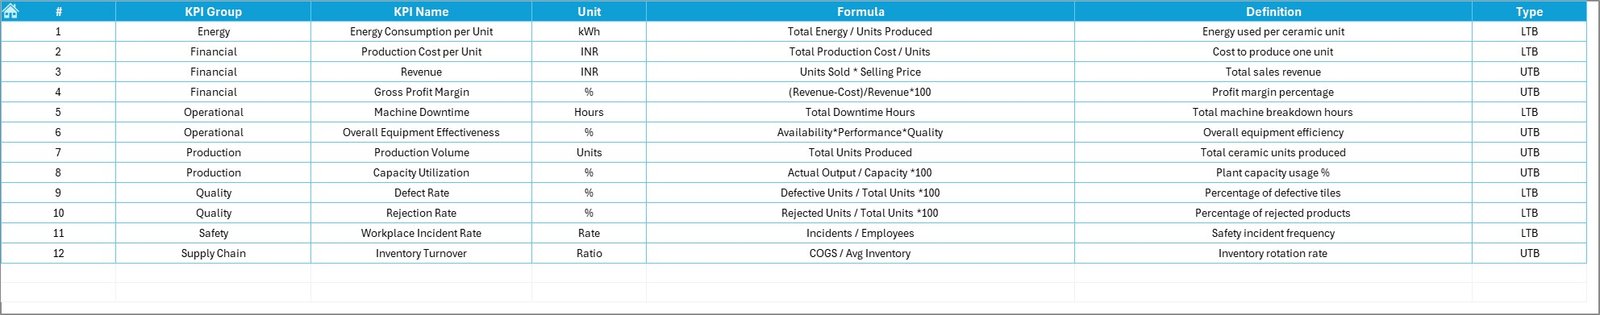
This sheet ensures clarity and consistency.
Here, you enter:
-
KPI Name
-
KPI Group
-
Unit
-
Formula
-
KPI Definition
For example:
-
Rejection Rate = (Rejected Units / Total Production) × 100
-
Machine Utilization = (Actual Running Time / Available Time) × 100
Clear definitions reduce confusion across departments.
Click to Purchases Ceramic Manufacturing KPI Dashboard in Excel
What Are the Important KPIs in Ceramic Manufacturing?
A ceramic plant must track KPIs across financial, operational, and quality categories.
🔹 Production KPIs
-
Total Production Volume
-
Production Efficiency
-
Machine Utilization Rate
-
Downtime Percentage
🔹 Quality KPIs
-
Rejection Rate
-
Defect Percentage
-
Quality Inspection Pass Rate
🔹 Cost KPIs
-
Fuel Cost per Unit
-
Raw Material Cost
-
Production Cost per Unit
-
Maintenance Cost
🔹 Financial KPIs
-
Revenue
-
Gross Profit Margin
-
Inventory Turnover
-
Sales Growth
Tracking these KPIs ensures balanced operational performance.
Advantages of Ceramic Manufacturing KPI Dashboard in Excel
Using a structured dashboard provides multiple benefits.
1️⃣ Centralized Performance Monitoring
You can track all KPIs in one file.
2️⃣ Real-Time Analysis
Once you update numbers, results reflect instantly.
3️⃣ Visual Trend Monitoring
Charts and arrows simplify performance evaluation.
4️⃣ Improved Cost Control
You can identify cost overruns early.
5️⃣ Better Production Planning
Trend analysis supports strategic decision-making.
6️⃣ Customizable Structure
You can add or modify KPIs easily.
Click to Purchases Ceramic Manufacturing KPI Dashboard in Excel
Best Practices for the Ceramic Manufacturing KPI Dashboard
To maximize dashboard effectiveness, follow these best practices.
✔ Update Data Monthly
Enter actual, target, and previous year numbers consistently.
✔ Review KPIs During Management Meetings
Discuss MTD and YTD performance regularly.
✔ Focus on Trend Analysis
Do not rely on single-month data. Analyze patterns.
✔ Set Realistic Targets
Base targets on historical performance and production capacity.
✔ Maintain Accurate Data Entry
Ensure error-free input to avoid incorrect insights.
✔ Train Team Members
Educate staff about KPI definitions and usage.
How Does This Dashboard Improve Manufacturing Performance?
When you monitor KPIs regularly:
-
You reduce waste
-
You improve machine efficiency
-
You control fuel consumption
-
You increase profit margins
-
You strengthen operational discipline
Consequently, your ceramic manufacturing process becomes more efficient and competitive.
Conclusion
Ceramic manufacturing demands precision and control. Without structured monitoring, inefficiencies grow silently.
The Ceramic Manufacturing KPI Dashboard in Excel provides:
-
MTD and YTD tracking
-
Target vs Actual comparison
-
Previous Year analysis
-
Visual trend charts
-
Standardized KPI definitions
Instead of managing scattered reports, you can rely on one organized Excel dashboard.
If you want to improve productivity, control costs, and enhance quality, this ready-to-use KPI dashboard offers a powerful solution.
Click to Purchases Ceramic Manufacturing KPI Dashboard in Excel
Frequently Asked Questions with Answers
1. What is a Ceramic Manufacturing KPI Dashboard in Excel?
It is an Excel-based performance tracking system designed to monitor production, cost, quality, and financial KPIs.
2. Can small ceramic factories use this dashboard?
Yes. Small and large manufacturers can use it effectively.
3. Does it support MTD and YTD analysis?
Yes. The dashboard allows both Month-to-Date and Year-to-Date performance tracking.
4. Can I customize KPIs?
Yes. You can add or modify KPIs based on business requirements.
5. Do I need advanced Excel skills?
No. Basic Excel knowledge is enough to use this dashboard efficiently.
Click to Purchases Ceramic Manufacturing KPI Dashboard in Excel
Visit our YouTube channel to learn step-by-step video tutorials