The medical devices industry demands precision, compliance, and performance control. Companies must monitor production efficiency, quality metrics, regulatory standards, and delivery timelines every single month. However, many organizations still rely on scattered spreadsheets. As a result, managers struggle to analyze trends. Moreover, leadership teams miss early warning signals.So, how can you track Monthly (MTD) and Year-to-Date (YTD) performance, compare targets with actual results, and evaluate previous year numbers in one structured system?Medical Devices KPI Dashboard in Excel .You need a Medical Devices KPI Dashboard in Excel.
In this complete guide, you will learn:
- What a Medical Devices KPI Dashboard in Excel is
- Why medical device companies need it
- Detailed explanation of all 7 worksheets
- Important KPIs you should track
- Advantages of Medical Devices KPI Dashboard in Excel
- Best Practices for Medical Devices KPI Dashboard in Excel
- Frequently Asked Questions with Answers
Click to buy Medical Devices KPI Dashboard in Excel
What Is a Medical Devices KPI Dashboard in Excel?
A Medical Devices KPI Dashboard in Excel is a ready-to-use performance tracking system designed specifically for medical device manufacturers, distributors, and healthcare suppliers.
It helps organizations:
- Monitor operational performance
- Compare Actual vs Target results
- Evaluate Previous Year performance
- Track MTD and YTD metrics
- Analyze KPI trends using charts
Instead of using multiple files, teams can manage all KPIs in one structured Excel workbook. As a result, decision-makers gain clarity. Furthermore, managers identify performance gaps quickly.
Why Do Medical Device Companies Need a KPI Dashboard?
Medical device companies operate in a highly regulated and competitive environment. Therefore, they must track performance accurately.
Without a proper dashboard:
- Teams lose visibility of monthly targets
- Quality issues remain unnoticed
- Production delays affect delivery timelines
- Compliance risks increase
However, when you implement a structured KPI Dashboard in Excel:
- You improve accountability
- You monitor compliance
- You detect issues early
- You make data-driven decisions
Consequently, your organization improves operational control and profitability.
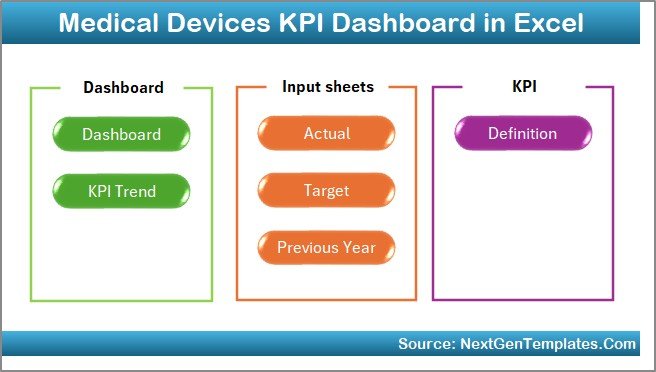
What Are the 7 Worksheets in the Medical Devices KPI Dashboard in Excel?
This ready-to-use dashboard includes 7 structured worksheets. Each worksheet plays a critical role in performance monitoring.
Let us understand each sheet in detail.
Summary Page – How Does It Help in Easy Navigation?
The Summary Page works as an index sheet.
Here, you get:
- 6 navigation buttons
- Quick access to all sheets
- Easy dashboard movement
Instead of scrolling manually, users can click buttons and jump directly to the required sheet. Therefore, the dashboard saves time and improves user experience.
Click to buy Medical Devices KPI Dashboard in Excel
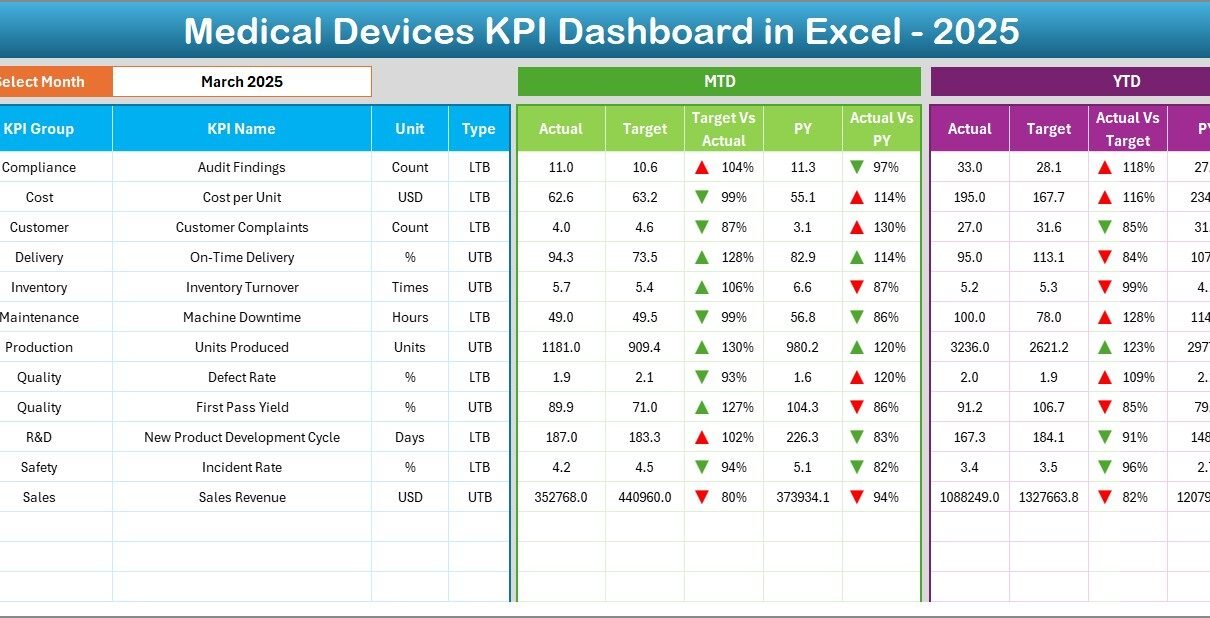
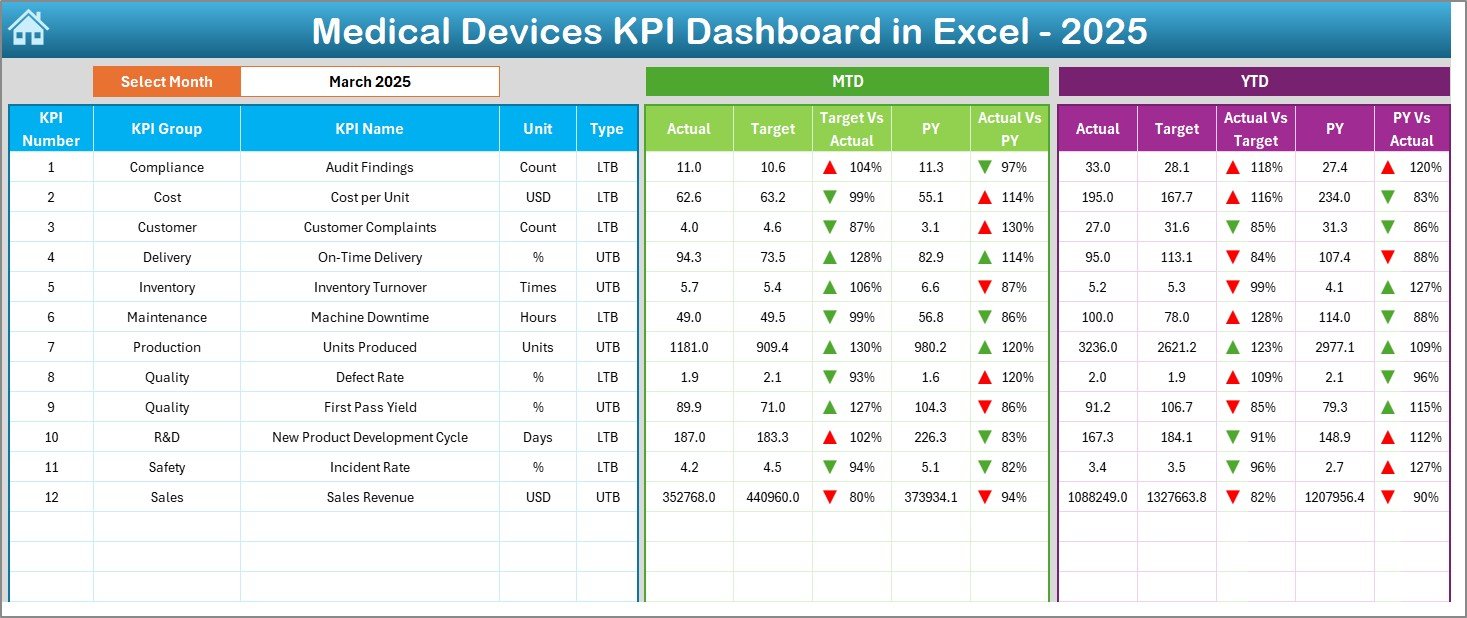
Dashboard Sheet – What Makes It the Core of the System?
The Dashboard Sheet serves as the main analysis page.
On cell D3, you can select the Month from a drop-down list. As soon as you select a month, the entire dashboard updates automatically.
What Does This Sheet Display?
It shows:
- MTD Actual
- MTD Target
- MTD Previous Year
- Target vs Actual comparison
- PY vs Actual comparison
- Conditional formatting arrows (Up/Down indicators)
Moreover, it also displays:
- YTD Actual
- YTD Target
- YTD Previous Year
- YTD Target vs Actual
- YTD PY vs Actual
Because of dynamic formulas and structured data, Excel calculates everything automatically. As a result, managers can analyze performance instantly.
Click to buy Medical Devices KPI Dashboard in Excel
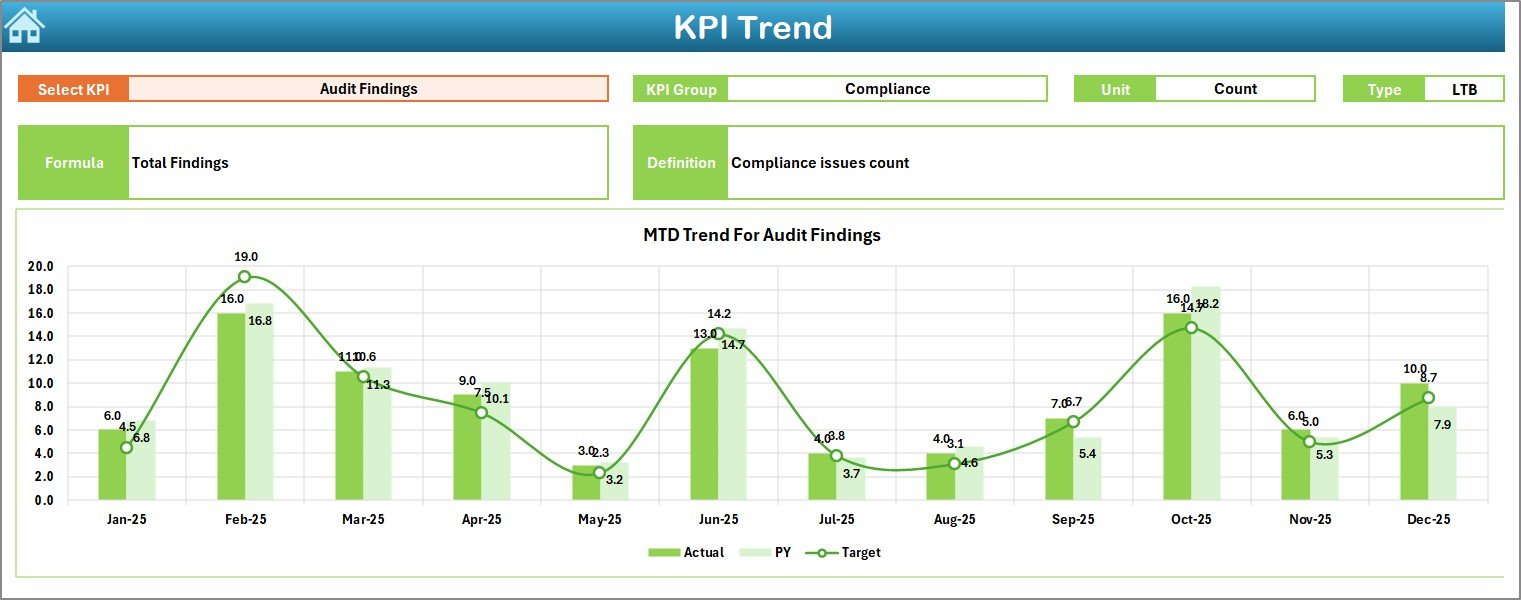
Trend Sheet – How Can You Analyze KPI Trends?
The Trend Sheet allows detailed KPI analysis.
On cell C3, you can select any KPI from the drop-down list. Once you select a KPI, the sheet displays:
- KPI Group
- Unit of KPI
- KPI Type (Lower the Better / Upper the Better)
- KPI Formula
- KPI Definition
Additionally, it shows:
- MTD Trend Chart
- YTD Trend Chart
- Actual vs Target vs Previous Year comparison
Therefore, users can easily visualize performance patterns. Moreover, they can detect improvements or declines over time.
Click to buy Medical Devices KPI Dashboard in Excel
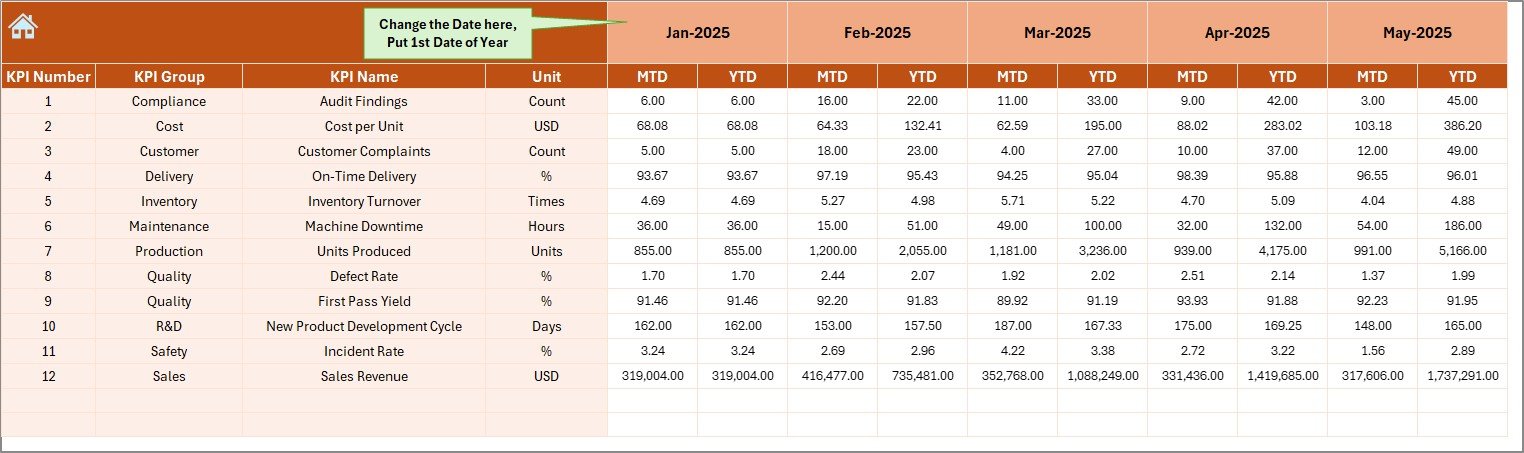
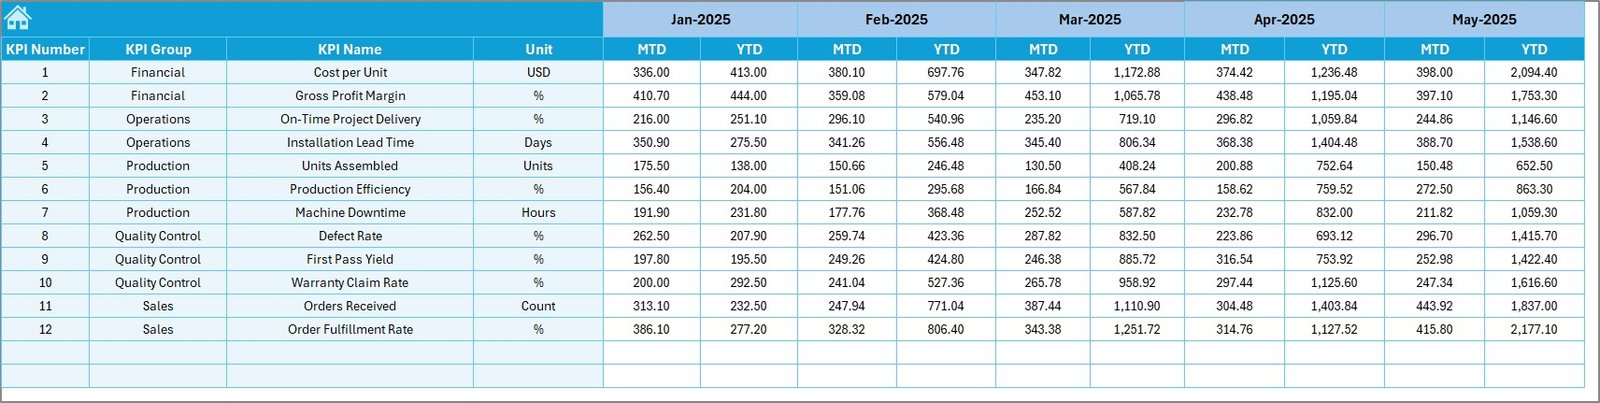
Actual Numbers Input Sheet – Where Do You Enter Performance Data?
This sheet allows you to enter actual performance numbers.
You must:
- Enter MTD values
- Enter YTD values
- Set the first month of the year in cell E1
Once you update the numbers, the dashboard reflects changes automatically. Therefore, you maintain real-time accuracy.
Click to buy Medical Devices KPI Dashboard in Excel
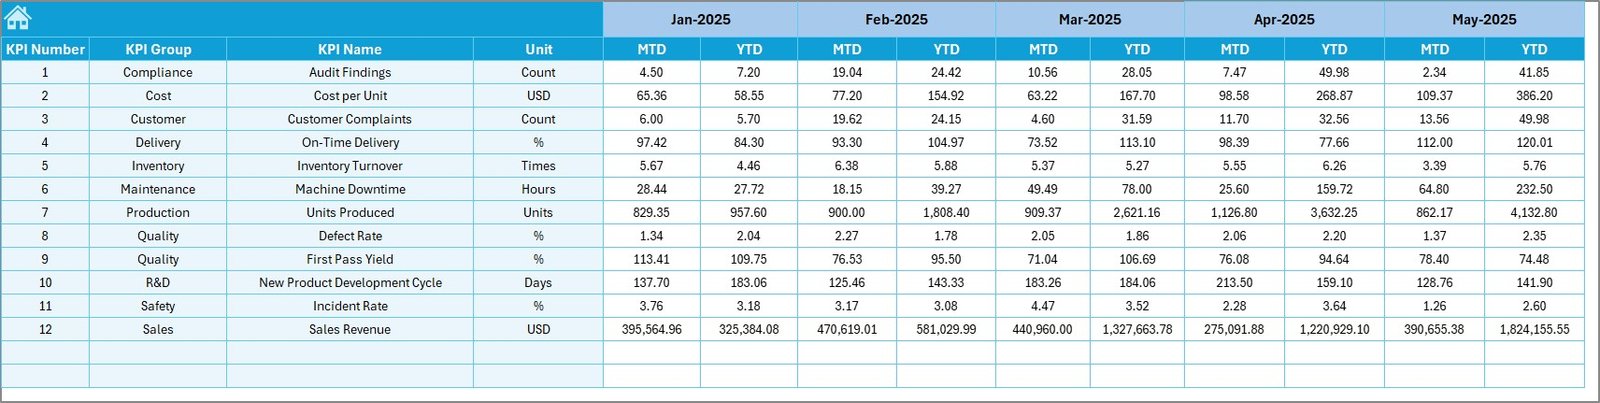
Target Sheet – How Do You Set Monthly and Yearly Goals?
In the Target Sheet, you enter:
- Monthly MTD targets
- Yearly YTD targets
When you update targets, Excel recalculates performance gaps instantly. As a result, managers can evaluate whether teams meet expectations.
Click to buy Medical Devices KPI Dashboard in Excel
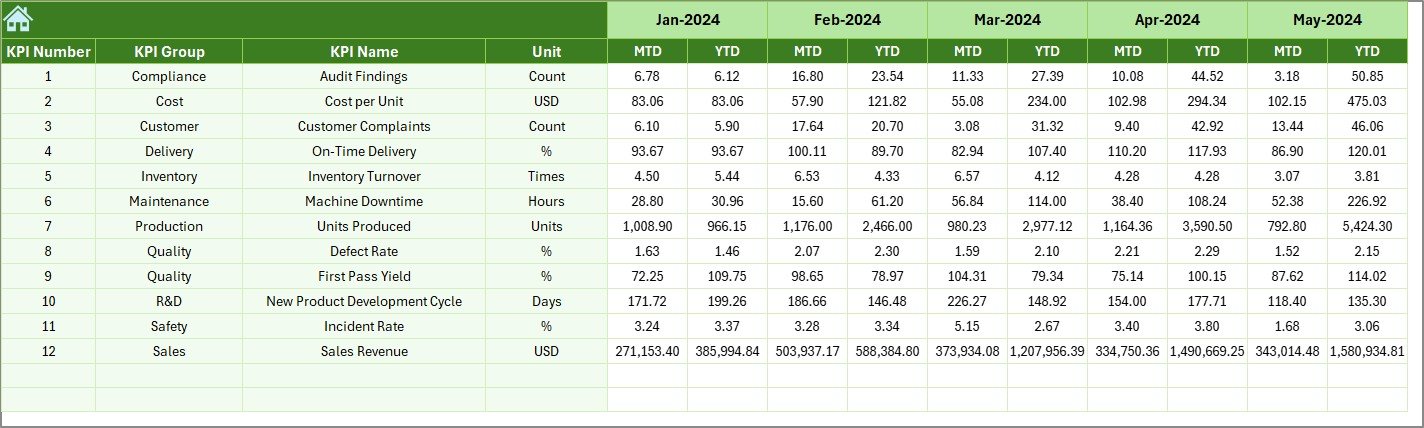
Previous Year Sheet – Why Is Historical Comparison Important?
This sheet stores:
- Previous year MTD numbers
- Previous year YTD numbers
When you compare current performance with previous year data, you understand growth trends clearly. Therefore, you make smarter decisions.
Click to buy Medical Devices KPI Dashboard in Excel
KPI Definition Sheet – Why Is Documentation Important?
This sheet contains:
- KPI Name
- KPI Group
- KPI Unit
- KPI Formula
- KPI Definition
Because clear documentation improves transparency, new team members can understand KPIs quickly. Moreover, audit teams appreciate structured documentation.
Click to buy Medical Devices KPI Dashboard in Excel
Which KPIs Should You Track in a Medical Devices KPI Dashboard?
You should include KPIs that reflect production, quality, compliance, and financial performance.
Here are some important KPIs:
Production KPIs
- Production Volume
- Manufacturing Cycle Time
- Equipment Utilization Rate
- On-Time Production Rate
Quality KPIs
- Defect Rate
- First Pass Yield
- Complaint Rate
- Recall Incidents
Compliance KPIs
- Regulatory Audit Score
- CAPA Closure Rate
- Non-Conformance Reports
Financial KPIs
- Cost per Unit
- Revenue per Product Line
- Inventory Turnover Ratio
By tracking these KPIs, companies improve performance continuously.
How Does Conditional Formatting Improve Decision Making?
The dashboard uses:
- Up arrows for positive growth
- Down arrows for decline
- Color indicators for clarity
Because visual signals provide instant clarity, managers can act faster. Therefore, teams respond quickly to performance gaps.
Advantages of Medical Devices KPI Dashboard in Excel
A well-designed KPI dashboard provides multiple advantages.
Improves Performance Monitoring
Teams can track MTD and YTD performance in real time.
Enhances Decision-Making
Managers can compare Target vs Actual instantly.
Saves Time
Instead of manual reports, Excel calculates automatically.
Increases Accountability
Each department knows its performance status.
Provides Historical Comparison
You can compare current data with previous year results.
Simplifies KPI Documentation
The KPI Definition sheet ensures clarity and transparency.
Best Practices for the Medical Devices KPI Dashboard in Excel
To get the maximum benefit, follow these best practices:
- Define KPIs Clearly
Always document KPI definitions and formulas.
- Update Data Regularly
Enter monthly data without delay.
- Validate Input Data
Check numbers before uploading.
- Keep the Dashboard Clean
Avoid adding unnecessary sheets.
- Use Structured Tables
Convert data ranges into Excel tables for better accuracy.
- Review Performance Monthly
Conduct monthly review meetings using the dashboard.
- Focus on Actionable KPIs
Track KPIs that directly impact performance.
When you follow these practices, your dashboard becomes a powerful decision tool.
How Does This Dashboard Improve Operational Efficiency?
This dashboard improves efficiency in several ways:
- It reduces manual reporting time
- It centralizes performance data
- It provides real-time insights
- It highlights underperforming KPIs
Therefore, teams can take corrective actions faster.
How Can You Customize This Dashboard?
You can easily customize:
- KPI list
- Units
- Formulas
- Target structure
- Month selection
Because Excel allows flexibility, organizations can adjust the dashboard according to their needs.
Conclusion
Medical device companies operate in a complex environment. Therefore, they must track performance with accuracy and clarity. A Medical Devices KPI Dashboard in Excel provides structured monitoring, real-time comparisons, and trend analysis in one powerful file.
Instead of using scattered spreadsheets, companies can manage everything in one centralized system. As a result, managers gain better visibility. Moreover, leadership teams make faster decisions.
If you want to improve operational control, enhance compliance tracking, and monitor financial performance, this dashboard offers a simple yet powerful solution.
Frequently Asked Questions with Answers
- What is the main purpose of the Medical Devices KPI Dashboard in Excel?
It helps organizations track MTD and YTD performance, compare targets, and analyze trends in one structured file.
- Can I customize the KPIs in this dashboard?
Yes, you can easily modify KPI names, formulas, and groups in the KPI Definition sheet.
- Does the dashboard update automatically?
Yes, once you enter data in the Actual, Target, and Previous Year sheets, the dashboard updates automatically.
- Can small medical device companies use this dashboard?
Yes, both small and large companies can use it effectively.
- Do I need advanced Excel skills to use this dashboard?
No, you only need basic Excel knowledge to update numbers and select months.
- How often should I update the dashboard?
You should update it monthly for accurate MTD and YTD tracking.
Visit our YouTube channel to learn step-by-step video tutorials
Watch the step-by-step video tutorial:
Click to buy Medical Devices KPI Dashboard in Excel