Customer experience drives business growth. Companies that focus on customer satisfaction, service quality, and loyalty outperform their competitors. However, many businesses still track customer metrics in scattered sheets. As a result, managers struggle to see trends. Moreover, leadership teams fail to connect KPIs with real results.
So, how can you track customer satisfaction, response time, complaint resolution rate, and loyalty metrics in one structured system?
The answer is simple.
You need a Customer Experience KPI Scorecard in Excel.
In this detailed guide, you will learn:
-
What a Customer Experience KPI Scorecard in Excel is
-
Why businesses need it
-
Detailed explanation of all 4 worksheets
-
Important customer experience KPIs
-
Advantages of the Customer Experience KPI Scorecard in Excel
-
Best Practices for the Customer Experience KPI Scorecard
-
Frequently Asked Questions with Answers
Let us explore everything step by step.
Click to Purchases Customer Experience KPI Scorecard in Excel
What Is a Customer Experience KPI Scorecard in Excel?
A Customer Experience KPI Scorecard in Excel is a ready-to-use performance tracking template that helps organizations measure and monitor customer-related KPIs in one place.
Instead of using multiple files, you can track:
-
Customer Satisfaction Score (CSAT)
-
Net Promoter Score (NPS)
-
First Response Time
-
Complaint Resolution Rate
-
Customer Retention Rate
-
Customer Effort Score
Moreover, you can compare Actual vs Target values, monitor Month-to-Date (MTD) and Year-to-Date (YTD) performance, and analyze previous year comparisons.
Because Excel provides flexibility, businesses of all sizes can use this scorecard without expensive software.
Why Is Customer Experience KPI Tracking Important?
Customer experience directly impacts revenue. If customers feel valued, they return. However, if they face delays or poor service, they leave.
Therefore, tracking CX KPIs helps businesses:
-
Identify weak areas quickly
-
Improve service quality
-
Reduce churn rate
-
Increase loyalty
-
Enhance brand reputation
Furthermore, real-time KPI tracking allows managers to make faster decisions. As a result, teams stay aligned with customer-focused goals.
Click to Purchases Customer Experience KPI Scorecard in Excel
How Does the Customer Experience KPI Scorecard in Excel Work?
This ready-to-use template includes 4 powerful worksheets, each designed for a specific purpose.
Let us break them down one by one.
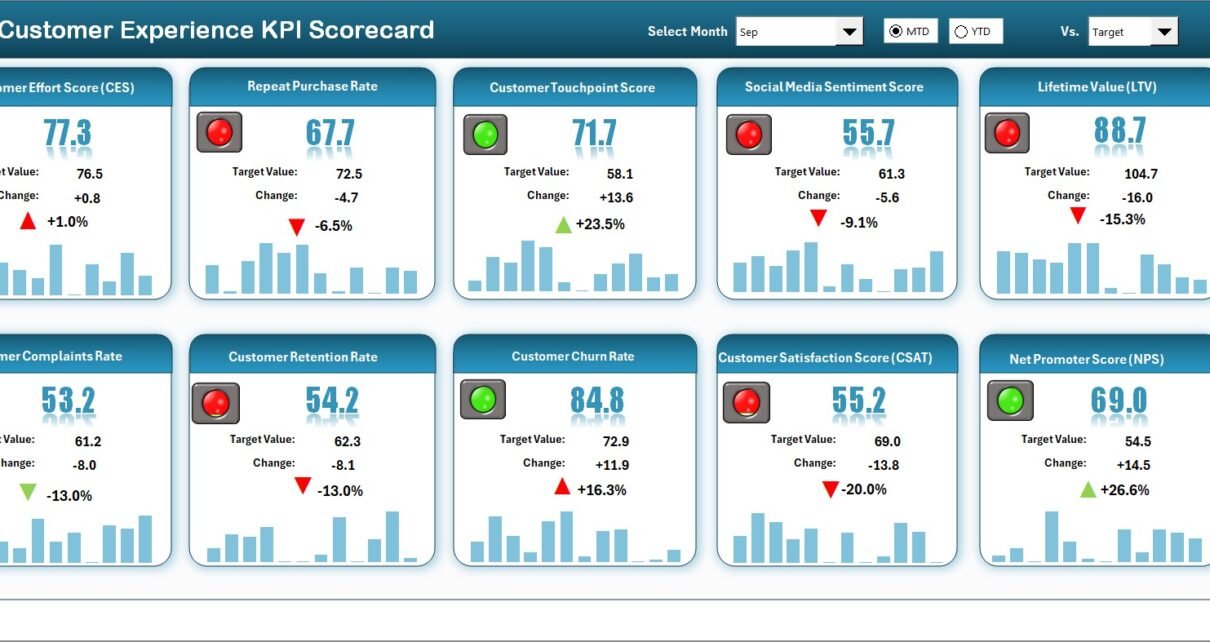
1️⃣ Scorecard Sheet – The Main Dashboard Interface
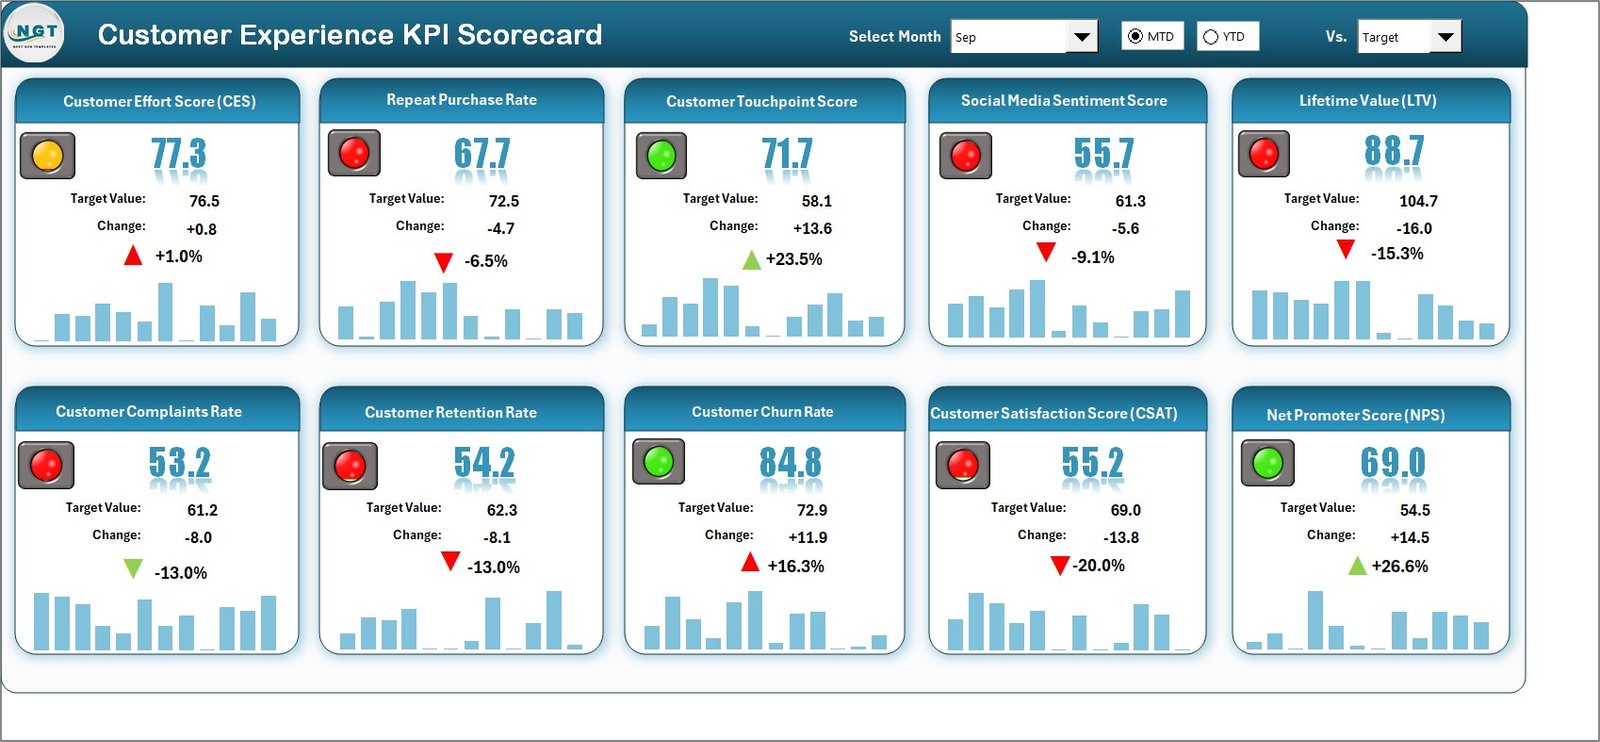
The Scorecard Sheet acts as the central performance view. Here, you can instantly check how your customer KPIs perform.
Key Features of the Scorecard Sheet
✔ Dropdown Menus
You can select:
-
Month
-
MTD (Month-to-Date)
-
YTD (Year-to-Date)
Once you select the month, the entire scorecard updates automatically. Therefore, you can analyze performance quickly without manual calculations.
✔ Actual vs Target Comparison
Each KPI shows:
-
Actual Value
-
Target Value
-
Variance
This comparison helps you see whether performance meets expectations.
✔ Visual Indicators
The template uses:
-
Color-coded signals
-
Conditional formatting
-
Performance indicators
For example:
-
Green indicates strong performance
-
Yellow indicates moderate performance
-
Red indicates attention required
As a result, managers can identify problems instantly.
✔ Comprehensive KPI Overview
The scorecard displays:
-
MTD performance
-
YTD performance
-
Target vs Actual
-
Previous Year comparison
Therefore, leadership teams can make data-driven decisions without confusion.
Click to Purchases Customer Experience KPI Scorecard in Excel
2️⃣ KPI Trend Sheet – Performance Analysis Over Time
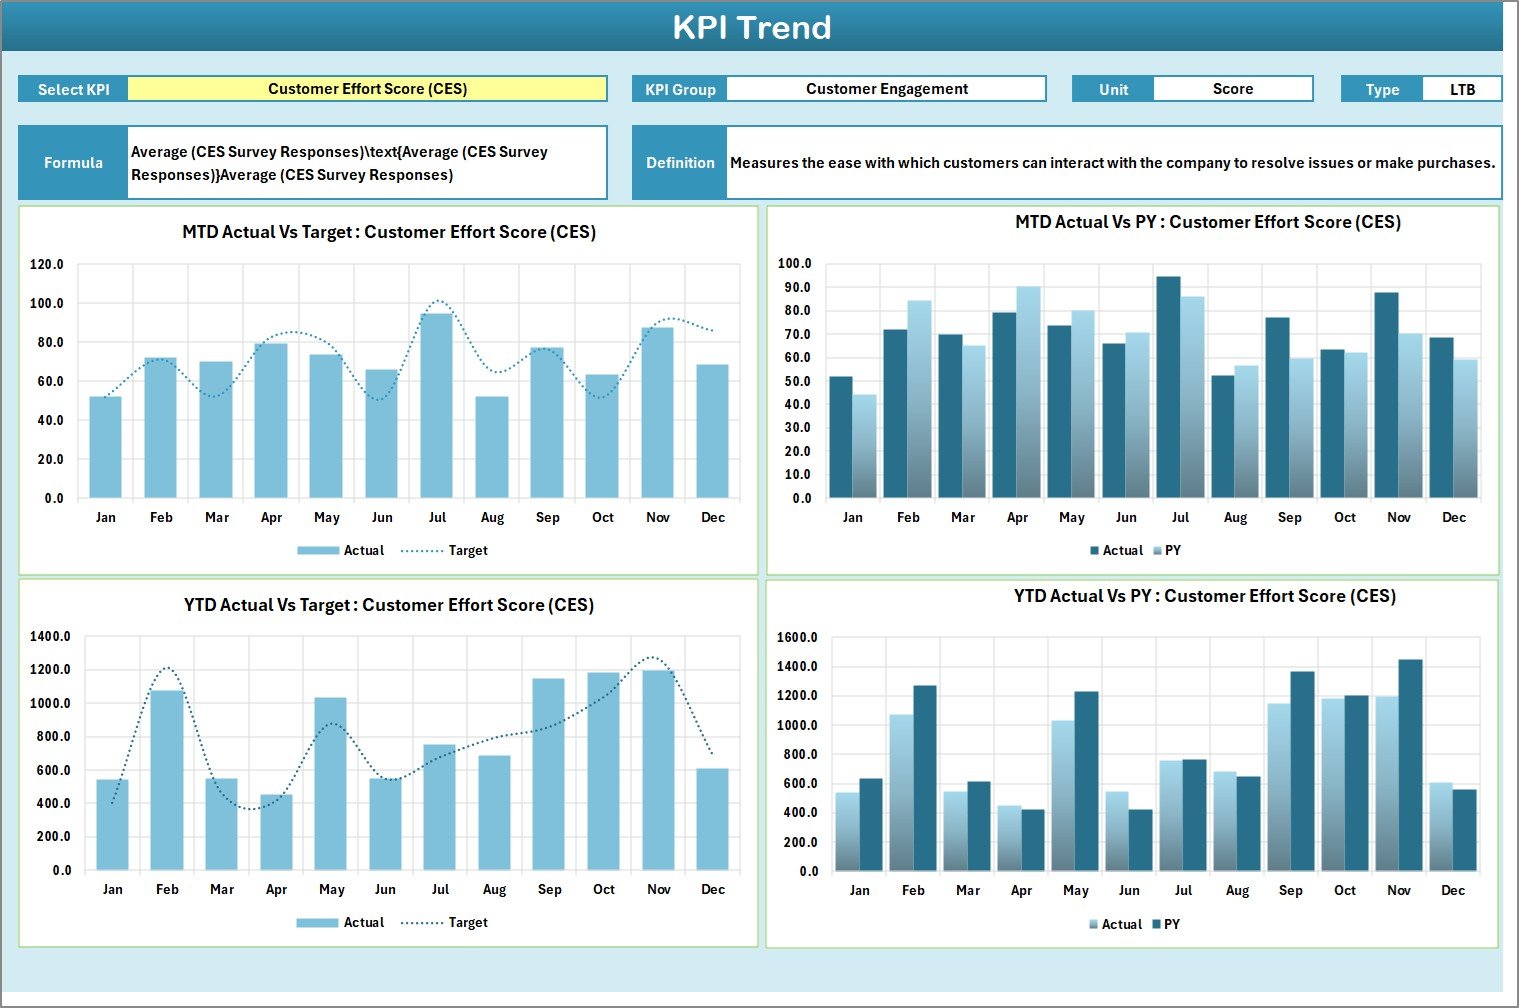
Do you want to analyze a single KPI deeply?
The KPI Trend Sheet provides detailed trend analysis.
What Can You Do in the KPI Trend Sheet?
✔ Select KPI from Dropdown (Cell C3)
You can choose any KPI from the dropdown list. Once selected, the sheet updates automatically.
✔ View KPI Details
The sheet displays:
-
KPI Group
-
Unit of KPI
-
Type of KPI (Lower the Better or Upper the Better)
-
Formula
-
Definition
Therefore, team members understand the KPI clearly.
✔ Trend Charts for MTD and YTD
The sheet includes trend charts for:
-
Actual values
-
Target values
-
Previous Year values
Because of visual charts, you can easily spot:
-
Performance improvements
-
Declines
-
Seasonal patterns
Consequently, managers can take corrective actions quickly.
Click to Purchases Customer Experience KPI Scorecard in Excel
3️⃣ Input Data Sheet – Central Data Entry Area
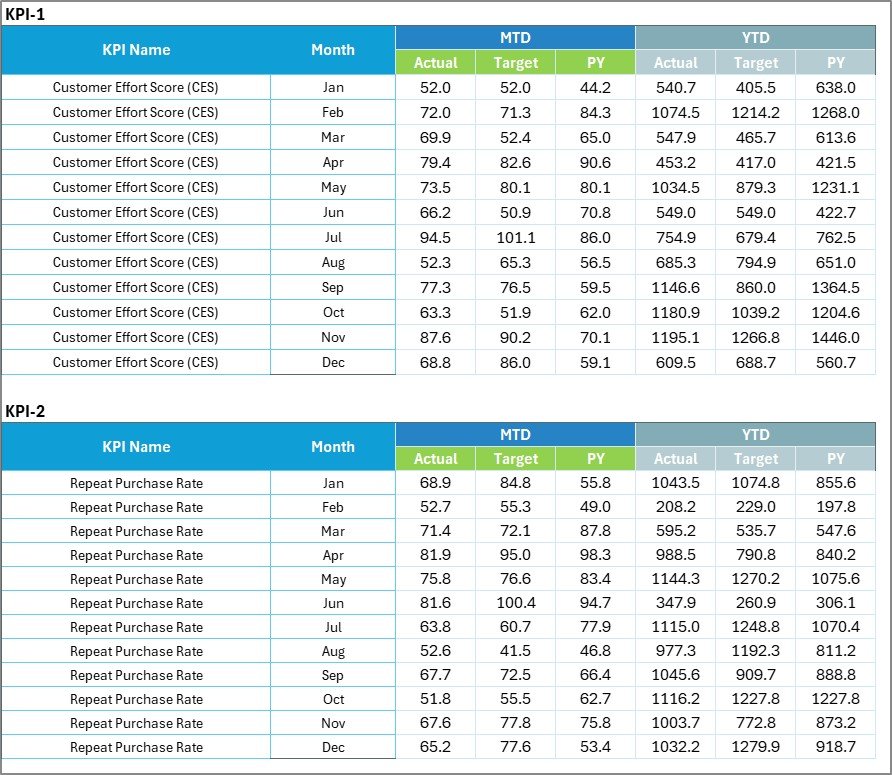
The Input Data Sheet works as the backbone of the entire scorecard.
Why Is the Input Data Sheet Important?
Because accurate data drives accurate results.
Key Features:
-
Enter actual KPI values
-
Enter target values
-
Update data monthly
-
Maintain historical records
Moreover, you can update the sheet easily whenever new data becomes available. Therefore, the scorecard always stays current.
4️⃣ KPI Definition Sheet – Standardization and Clarity
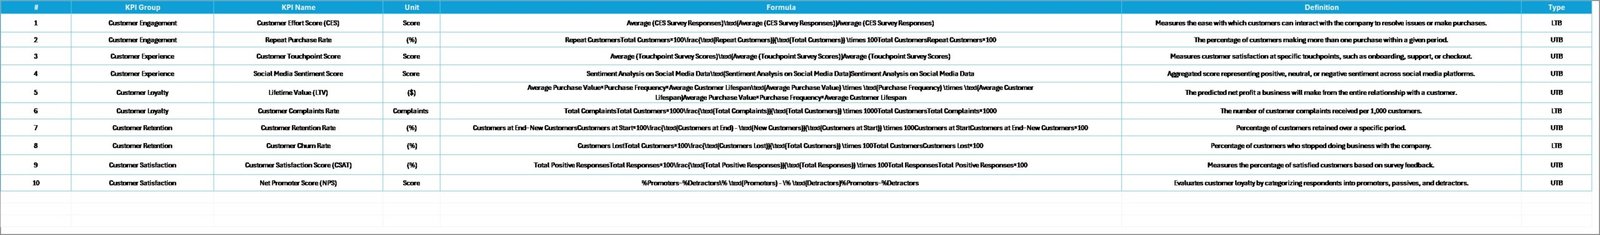
Many organizations fail to define KPIs clearly. As a result, teams interpret metrics differently.
However, the KPI Definition Sheet solves this problem.
In This Sheet, You Can Define:
-
KPI Name
-
KPI Group
-
Unit
-
Formula
-
KPI Definition
Therefore, everyone understands how each KPI works. Moreover, this sheet ensures consistency across departments.
Click to Purchases Customer Experience KPI Scorecard in Excel
What Are the Most Important Customer Experience KPIs to Track?
Tracking the right KPIs ensures better performance.
Here are some essential customer experience KPIs:
📌 1. Customer Satisfaction Score (CSAT)
Measures customer happiness after interaction.
📌 2. Net Promoter Score (NPS)
Measures customer loyalty and likelihood to recommend.
📌 3. First Response Time
Measures how quickly your team responds.
📌 4. Average Resolution Time
Measures time taken to solve customer issues.
📌 5. Complaint Resolution Rate
Measures percentage of resolved complaints.
📌 6. Customer Retention Rate
Measures how many customers stay over time.
📌 7. Customer Effort Score
Measures how easy customers find your service.
📌 8. Churn Rate
Measures customer loss percentage.
When you track these KPIs in Excel, you gain full visibility into your customer journey.
Advantages of Customer Experience KPI Scorecard in Excel
Let us explore the major benefits.
✔ 1. Easy to Use
Anyone familiar with Excel can use this template. Therefore, you do not need technical expertise.
✔ 2. Cost-Effective
Excel eliminates expensive software subscriptions. As a result, small businesses can also track KPIs efficiently.
✔ 3. Real-Time Performance Monitoring
Once you update data, dashboards update instantly. Therefore, decision-making becomes faster.
✔ 4. Visual Performance Indicators
Color codes and charts simplify analysis. Consequently, managers understand data quickly.
✔ 5. Structured KPI Documentation
The KPI definition sheet ensures clarity. Therefore, teams align with the same performance standards.
✔ 6. Scalable and Customizable
You can add new KPIs anytime. Moreover, you can modify targets easily.
✔ 7. Improved Accountability
When teams see clear performance metrics, they take ownership. As a result, customer service improves significantly.
Click to Purchases Customer Experience KPI Scorecard in Excel
Best Practices for the Customer Experience KPI Scorecard
To maximize results, follow these best practices.
✅ 1. Define Clear Targets
Set realistic and measurable targets. Otherwise, teams may lose focus.
✅ 2. Update Data Regularly
Update KPI data monthly. Consistency ensures reliable insights.
✅ 3. Focus on Actionable KPIs
Track KPIs that drive decisions. Avoid vanity metrics.
✅ 4. Train Your Team
Explain KPI definitions clearly. Therefore, everyone understands performance expectations.
✅ 5. Review Trends Monthly
Analyze trend charts regularly. Consequently, you can fix issues before they escalate.
✅ 6. Align KPIs with Business Goals
Ensure that customer KPIs support revenue and growth objectives.
✅ 7. Use Data for Decision-Making
Do not just collect data. Instead, take action based on insights.
How Can This Scorecard Improve Customer Experience?
When businesses track KPIs consistently:
-
They reduce response times
-
They improve resolution speed
-
They increase satisfaction levels
-
They build customer loyalty
-
They reduce churn
Moreover, managers gain transparency across departments. Therefore, leadership teams make confident decisions.
Conclusion
Customer experience determines business success. However, without structured tracking, companies miss valuable insights.
The Customer Experience KPI Scorecard in Excel provides a simple yet powerful solution. It combines:
-
Scorecard dashboard
-
KPI trend analysis
-
Centralized data input
-
KPI definition documentation
Therefore, businesses can monitor performance, compare actual vs target values, and analyze trends effectively.
If you want better customer satisfaction, improved loyalty, and measurable growth, this Excel scorecard offers the perfect starting point.
Click to Purchases Customer Experience KPI Scorecard in Excel
Frequently Asked Questions with Answers
1. What is a Customer Experience KPI Scorecard in Excel?
It is an Excel-based template that tracks customer service performance using KPIs like CSAT, NPS, and response time.
2. Can small businesses use this scorecard?
Yes. Small and medium businesses can use this cost-effective Excel solution easily.
3. How often should I update the scorecard?
You should update the scorecard monthly. However, weekly updates provide better insights.
4. What does MTD and YTD mean?
MTD means Month-to-Date. YTD means Year-to-Date.
5. Can I customize KPIs in the scorecard?
Yes. You can add, remove, or modify KPIs according to your business needs.
6. Do I need advanced Excel skills?
No. Basic Excel knowledge allows you to use this template efficiently.
7. Why should I compare Actual vs Target values?
Because comparison helps identify performance gaps quickly.
8. How does trend analysis help?
Trend analysis shows performance direction over time. Therefore, you can plan corrective actions.
Click to Purchases Customer Experience KPI Scorecard in Excel
Visit our YouTube channel to learn step-by-step video tutorials