The AR-VR industry moves fast. New hardware launches every quarter. Software updates roll out every week. Meanwhile, investors demand growth. Customers expect innovation. Teams need clarity.However, many AR-VR companies still track performance in scattered sheets. As a result, leaders waste time consolidating data. Moreover, teams struggle to understand which KPIs truly matter. Therefore, businesses lose focus.So, how can AR-VR companies track performance in one structured and simple system?You need an AR-VR Industry KPI Scorecard in Excel.This ready-to-use Excel template helps immersive technology companies monitor performance using MTD and YTD comparisons, actual vs target tracking, visual indicators, and dynamic trend analysis.
In this complete guide, you will learn:
- What an AR-VR Industry KPI Scorecard in Excel is
- Why AR-VR companies need it
- Detailed explanation of all 4 worksheets
- Key KPIs used in the AR-VR industry
- Advantages of using this scorecard
- Best practices for implementation
- Frequently Asked Questions with answers
Click to buy AR-VR Industry KPI Scorecard in Excel
What Is an AR-VR Industry KPI Scorecard in Excel?
An AR-VR Industry KPI Scorecard in Excel is a structured performance tracking tool designed specifically for augmented reality and virtual reality businesses.
It allows companies to:
- Track revenue growth
- Monitor user engagement
- Evaluate product performance
- Measure development efficiency
- Compare actual vs target results
- Analyze MTD and YTD trends
Instead of managing multiple spreadsheets, teams can centralize all KPI data in one professional scorecard.
Moreover, Excel provides flexibility. Therefore, companies can customize the template according to their business model.
Why Does the AR-VR Industry Need a KPI Scorecard?
The AR-VR industry operates in a high-investment and high-innovation environment. Consequently, companies must track performance carefully.
Without a structured KPI system:
- Teams rely on assumptions
- Managers react late
- Investors lose confidence
- Projects exceed budgets
- Deadlines slip
However, when companies implement a KPI scorecard:
- Leaders make data-driven decisions
- Teams stay aligned with targets
- Investors gain transparency
- Performance improves consistently
Therefore, a KPI scorecard does not just track numbers. It drives accountability and growth.
How Is the AR-VR Industry KPI Scorecard in Excel Structured?
This ready-to-use template includes 4 worksheets, each designed for a specific purpose.
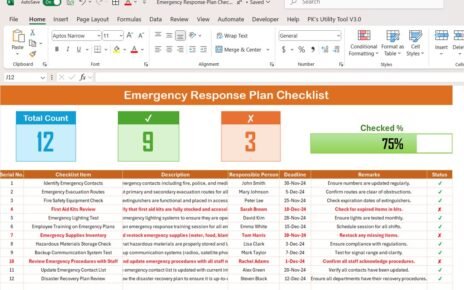
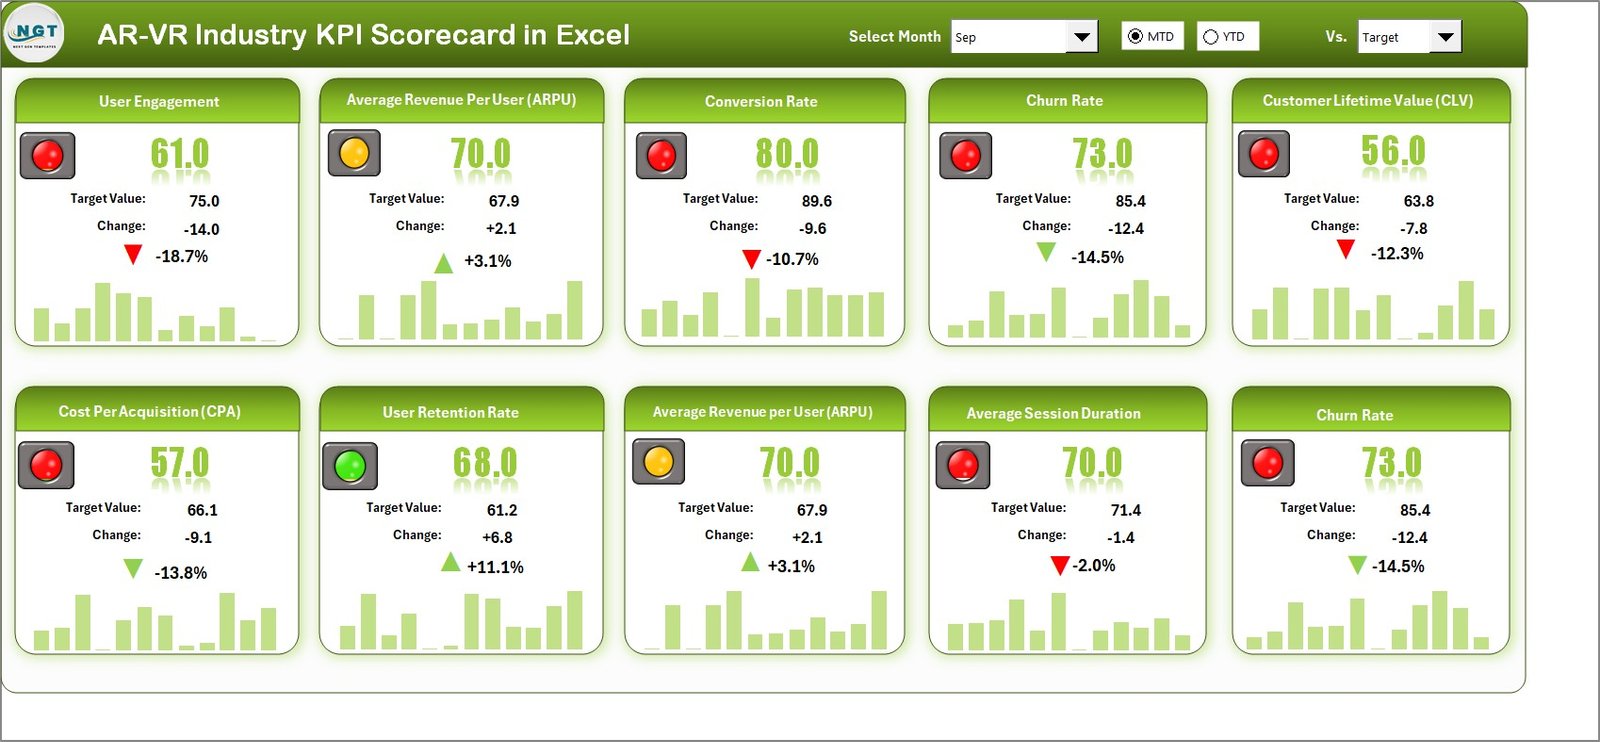
Scorecard Sheet – The Main Performance Dashboard
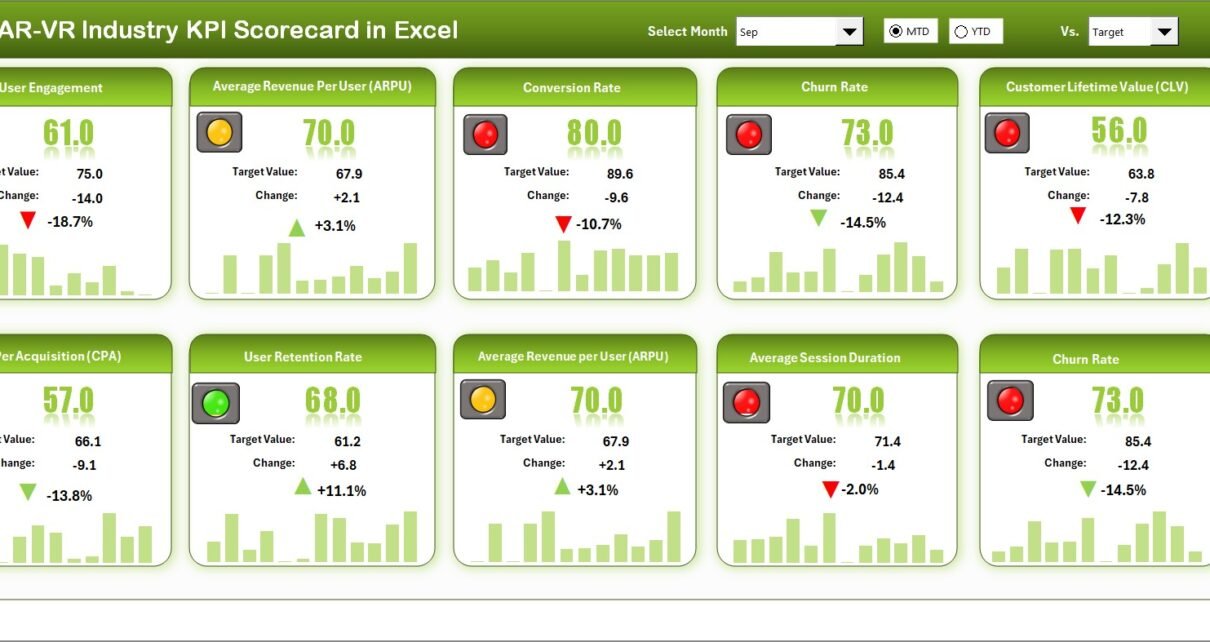
The Scorecard Sheet serves as the primary interface. Here, users view all KPIs in one place.
Key Features of the Scorecard Sheet
Dropdown Menus
You can select:
- Month
- MTD (Month-to-Date)
- YTD (Year-to-Date)
As soon as you select a different period, the numbers update automatically. Therefore, you can switch between monthly and yearly views instantly.
Actual vs Target Values
The sheet compares:
- Actual MTD
- Target MTD
- Actual YTD
- Target YTD
As a result, managers quickly identify gaps.
Visual Indicators
The template uses:
- Conditional formatting
- Color indicators
- Performance signals
For example:
- Green indicates target achieved
- Yellow indicates moderate performance
- Red indicates target missed
Therefore, users understand performance at a glance.
Comprehensive KPI Overview
The sheet displays:
- KPI Name
- KPI Group
- Unit
- Type (Lower the Better / Upper the Better)
- MTD values
- YTD values
Moreover, the template shows 10 KPIs in one view, which allows leaders to review performance quickly.
Click to buy AR-VR Industry KPI Scorecard in Excel
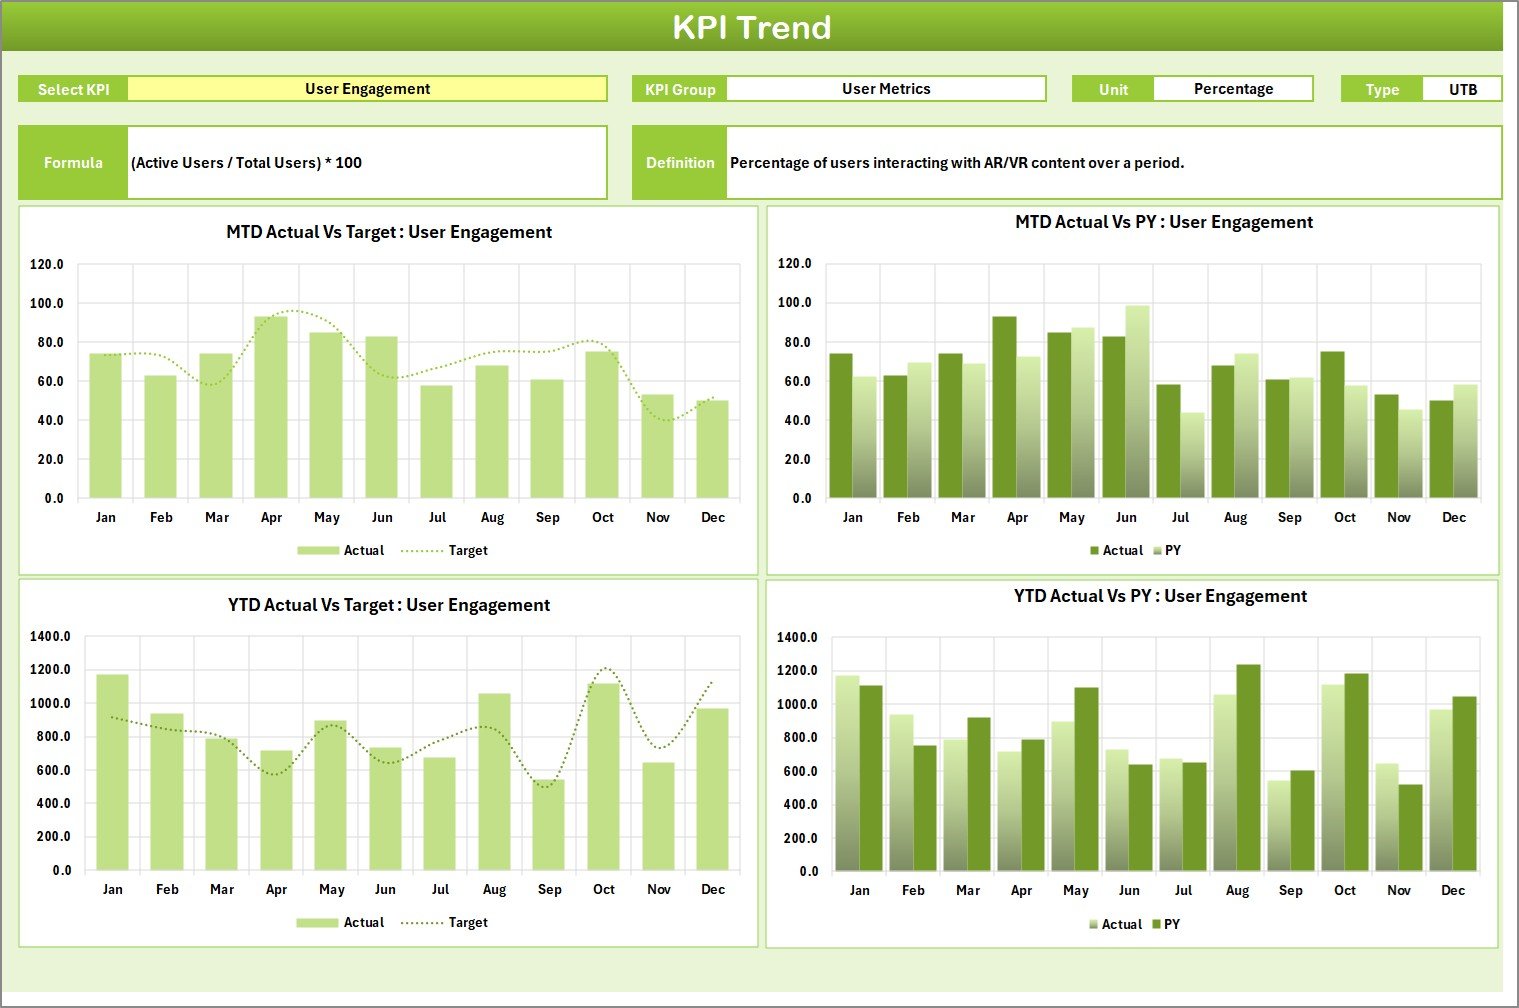
KPI Trend Sheet – Deep Performance Analysis
The KPI Trend Sheet helps users analyze individual KPI performance in detail.
How It Works
- You select a KPI from the dropdown in cell C3.
- The sheet displays:
- KPI Group
- Unit
- Type (Lower the Better or Upper the Better)
- Formula
- Definition
Trend Charts Included
The sheet shows:
- MTD trend chart
- YTD trend chart
- Actual vs Target comparison
- Previous Year (PY) comparison
Click to buy AR-VR Industry KPI Scorecard in Excel
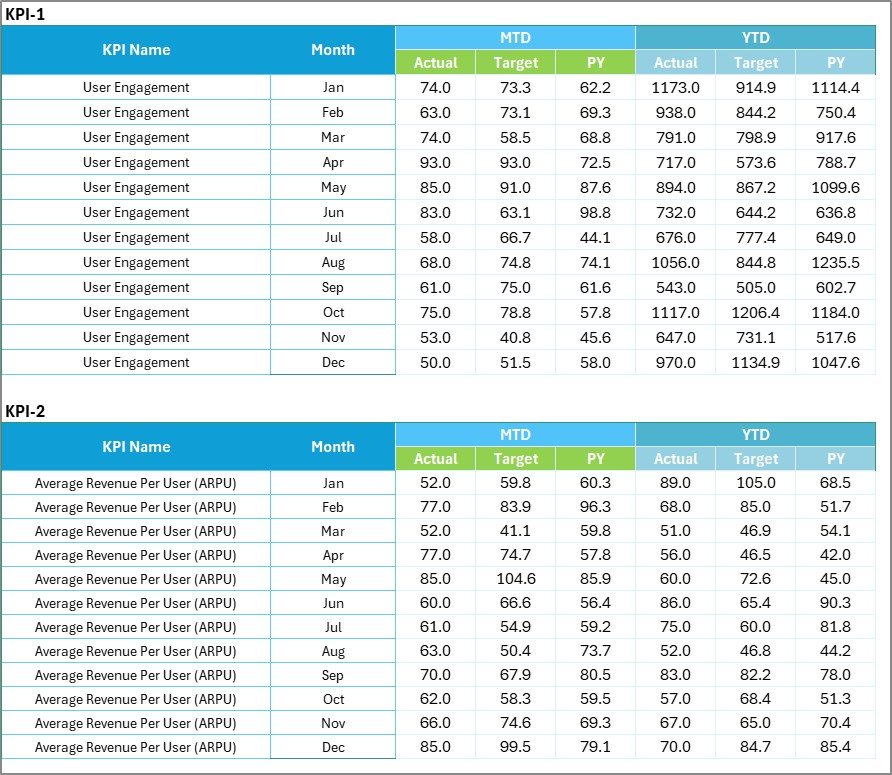
Input Data Sheet – The Data Entry Center
The Input Data Sheet acts as the foundation of the scorecard.
Key Functions
- Enter Actual values
- Enter Target values
- Record monthly data
- Update numbers easily
Because Excel automatically connects formulas to the scorecard, any change in the input sheet reflects instantly in the dashboard.
Therefore, you maintain accuracy without manual recalculations.
Click to buy AR-VR Industry KPI Scorecard in Excel
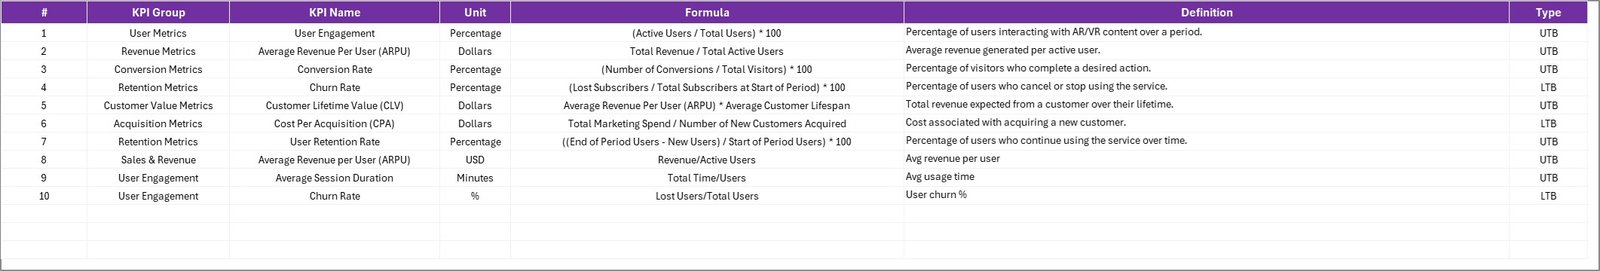
KPI Definition Sheet – KPI Documentation Hub
The KPI Definition Sheet stores structured KPI information.
You must enter:
- KPI Name
- KPI Group
- Unit
- Formula
- KPI Definition
This sheet ensures clarity. Moreover, it prevents confusion among team members.
For example:
If two teams interpret “User Engagement Rate” differently, this sheet defines the exact calculation method.
Click to buy AR-VR Industry KPI Scorecard in Excel
What Are the Key KPIs for the AR-VR Industry?
Now let us explore important KPIs that AR-VR companies commonly track.
Revenue & Growth KPIs
- Monthly Recurring Revenue (MRR)
- Average Revenue per User (ARPU)
- Customer Lifetime Value (CLV)
- Revenue Growth Rate
User Performance KPIs
- Active Users
- Daily Active Users (DAU)
- Session Duration
- User Retention Rate
Product Development KPIs
- Feature Release Time
- Bug Resolution Time
- Deployment Frequency
- Crash Rate
Operational KPIs
- Customer Acquisition Cost (CAC)
- Marketing ROI
- Support Ticket Resolution Time
By tracking these KPIs, AR-VR companies gain a 360-degree performance view.
Advantages of AR-VR Industry KPI Scorecard in Excel
Implementing this scorecard offers several strong benefits.
Centralized Data Management
Instead of multiple sheets, you manage everything in one structured file.
Real-Time Performance Visibility
Because the template updates automatically, managers monitor performance instantly.
Clear Visual Insights
Color indicators simplify complex data. Therefore, leadership understands results quickly.
Improved Decision-Making
When teams see actual vs target comparisons, they take faster action.
Easy Customization
Excel allows full flexibility. You can add new KPIs, update formulas, or modify layouts easily.
Cost-Effective Solution
Unlike expensive BI tools, Excel offers a practical and affordable option.
How to Implement the AR-VR KPI Scorecard Successfully?
Implementation plays a critical role. Therefore, follow these structured steps.
Step 1: Define Clear Objectives
First, identify your company goals:
- Increase revenue?
- Improve retention?
- Reduce development time?
Step 2: Select Relevant KPIs
Choose 8-12 KPIs aligned with strategy.
Step 3: Set Realistic Targets
Base targets on historical data and market benchmarks.
Step 4: Train Your Team
Ensure all team members understand KPI definitions.
Step 5: Review Monthly Performance
Conduct regular review meetings.
Best Practices for the AR-VR Industry KPI Scorecard in Excel
To maximize results, follow these best practices.
Keep KPIs Focused
Do not overload the scorecard with too many metrics.
Update Data Consistently
Enter data monthly without delay.
Validate Input Data
Check for errors before finalizing reports.
Use Clear Naming Conventions
Maintain consistent KPI names across sheets.
Compare with Previous Year
Always analyze trends against PY data.
Share Insights with Teams
Discuss findings openly to encourage accountability.
How Does the KPI Scorecard Improve Investor Reporting?
AR-VR companies often rely on investor funding. Therefore, transparent reporting becomes essential.
With this scorecard:
- You present structured KPI summaries
- You show trend charts clearly
- You justify performance gaps
- You demonstrate growth trajectory
Consequently, investors gain confidence in management decisions.
Can Startups Use the AR-VR KPI Scorecard?
Yes, absolutely.
Startups benefit even more because:
- They need funding transparency
- They track burn rate carefully
- They must prove product-market fit
Moreover, Excel remains accessible and simple. Therefore, even small teams can implement it quickly.
How Does MTD and YTD Comparison Help AR-VR Businesses?
MTD shows short-term performance.
YTD shows long-term progress.
When you combine both:
- You detect monthly spikes
- You identify seasonal patterns
- You monitor annual growth
As a result, strategy becomes more data-driven.
Conclusion
The AR-VR industry evolves rapidly. Therefore, companies must track performance precisely.
An AR-VR Industry KPI Scorecard in Excel provides:
- Structured performance tracking
- Clear actual vs target comparisons
- MTD and YTD analysis
- Visual performance indicators
- Trend insights with PY comparisons
Instead of guessing performance, you monitor it clearly.
Instead of reacting late, you act proactively.
Therefore, if your AR-VR company wants clarity, accountability, and growth, implementing this KPI scorecard becomes a smart decision.
Frequently Asked Questions (FAQs)
- What is an AR-VR Industry KPI Scorecard in Excel?
It is a structured Excel template that tracks key performance indicators for AR and VR companies using actual vs target comparisons and trend analysis.
- How many worksheets does the scorecard include?
The template includes four worksheets:
- Scorecard Sheet
- KPI Trend Sheet
- Input Data Sheet
- KPI Definition Sheet
- How many KPIs does the scorecard display?
The main scorecard sheet displays 10 KPIs in one view. However, you can customize it easily.
- Can I modify KPI formulas?
Yes. Because the template runs in Excel, you can edit formulas anytime.
- What type of KPIs can I track?
You can track revenue, user engagement, product development, marketing, and operational KPIs.
- Is this template suitable for AR-VR startups?
Yes. Startups benefit from structured tracking and investor reporting.
- Does the template support MTD and YTD analysis?
Yes. You can switch between MTD and YTD using dropdown menus.
- How often should I update the scorecard?
You should update it monthly. However, some companies update it weekly for better control.
Visit our YouTube channel to learn step-by-step video tutorials
Watch the step-by-step video tutorial:
Click to buy AR-VR Industry KPI Scorecard in Excel