Running a SaaS business feels exciting. However, it also feels overwhelming. You track subscriptions, churn, customer acquisition, revenue growth, and product engagement every single month. Meanwhile, your investors expect clear numbers. Your team wants clarity. And you need fast decisions.So how do you track everything without confusion?You need a SaaS Business KPI Scorecard In Excel.This ready-to-use Excel template helps you monitor key SaaS metrics in one structured, interactive, and easy-to-understand scorecard. Instead of juggling multiple sheets and reports, you get a centralized KPI tracking system.
In this complete guide, you will learn:
- What a SaaS Business KPI Scorecard In Excel is
- Why SaaS companies need KPI tracking
- Detailed explanation of all 4 worksheets
- Advantages of SaaS Business KPI Scorecard In Excel
- Best practices for implementation
- Frequently Asked Questions with answers
Click to buy SaaS Business KPI Scorecard In Excel
What Is a SaaS Business KPI Scorecard In Excel?
A SaaS Business KPI Scorecard In Excel is a structured performance tracking template designed specifically for Software-as-a-Service companies.
It allows you to:
- Monitor key performance indicators (KPIs)
- Compare Actual vs Target values
- Analyze Month-to-Date (MTD) and Year-to-Date (YTD) performance
- Identify growth gaps quickly
- Make data-driven decisions
Instead of relying on scattered spreadsheets, you can use this scorecard to organize everything in one place. Moreover, Excel gives you flexibility, customization, and control without expensive tools.
Why Does Every SaaS Business Need a KPI Scorecard?
SaaS businesses operate on metrics. Without KPIs, you operate blindly.
For example:
- If churn increases by 2%, your revenue drops significantly.
- If customer acquisition cost rises, profit margins shrink.
- If monthly recurring revenue slows down, growth stops.
Therefore, you must track performance consistently.
A KPI scorecard helps you:
- Measure progress clearly
- Align teams around goals
- Detect risks early
- Improve forecasting accuracy
- Present professional reports to stakeholders
Most importantly, it turns raw numbers into meaningful insights.
What Are the Key Features of the SaaS Business KPI Scorecard In Excel?
This ready-to-use template includes 4 powerful worksheets. Each sheet plays a specific role in performance tracking.
Let us explore them in detail.
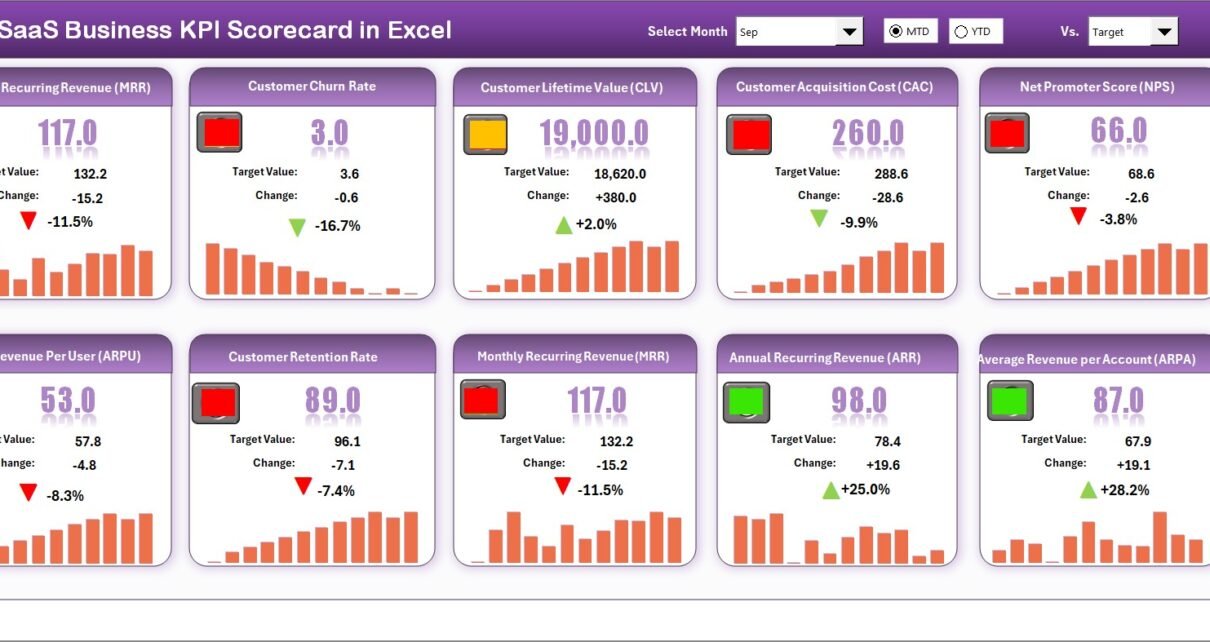
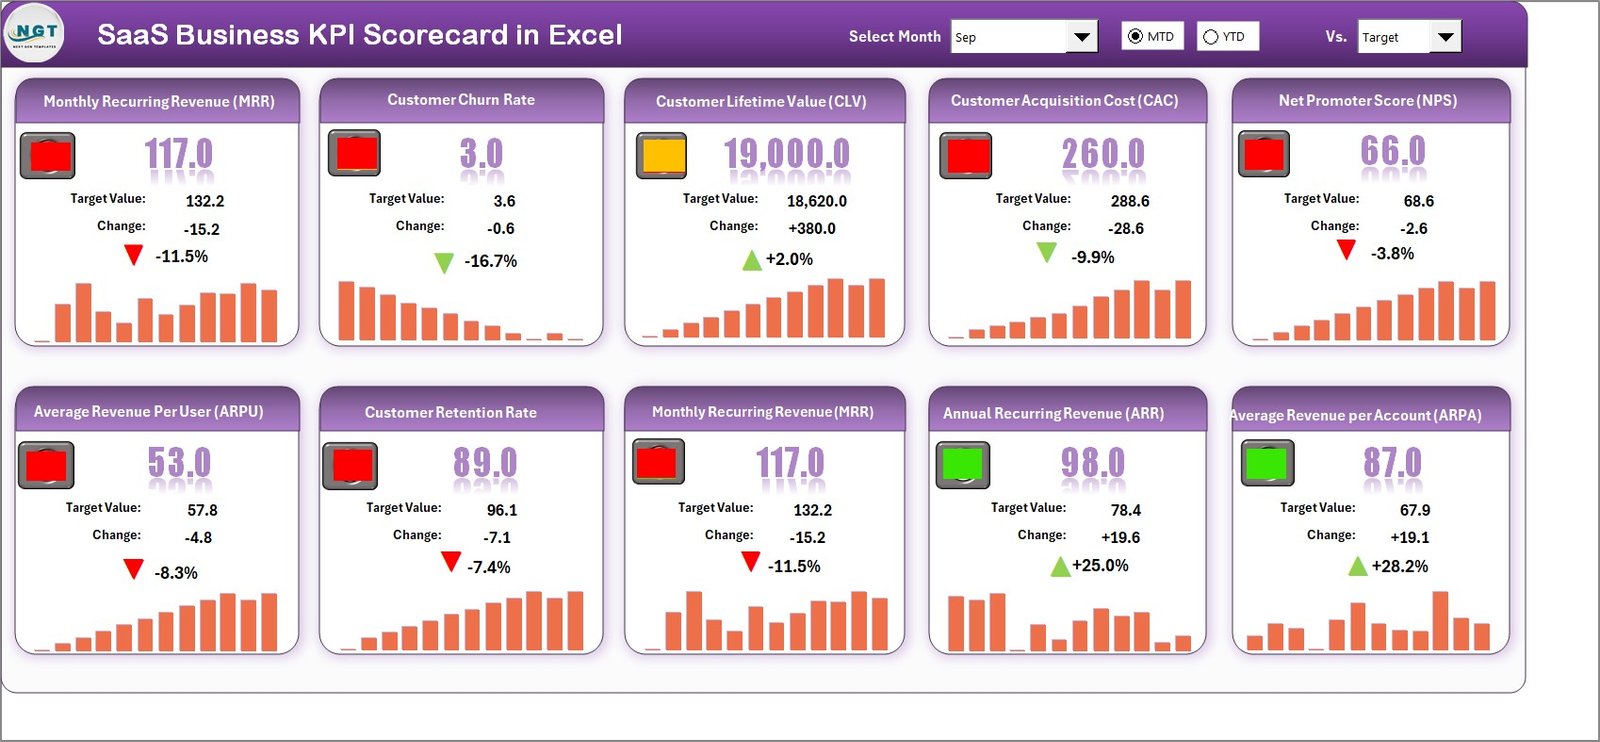
Scorecard Sheet
The Scorecard Sheet acts as the main dashboard interface. It displays performance of 10 KPIs in one consolidated view.
Key Features of the Scorecard Sheet
Dropdown Menus for Dynamic Analysis
You can select:
- Month
- MTD (Month-to-Date)
- YTD (Year-to-Date)
As soon as you change the selection, the entire scorecard updates automatically. Therefore, you can analyze performance instantly.
Actual vs Target Comparison
Each KPI shows:
- Actual value
- Target value
- Variance
This comparison allows you to see performance gaps quickly.
Visual Indicators
The scorecard uses:
- Color-coded indicators
- Conditional formatting
- Traffic light signals
As a result, you identify underperforming KPIs in seconds.
Comprehensive KPI Overview
You see:
- KPI Name
- KPI Group
- Unit
- MTD value
- YTD value
- Performance status
Because the sheet shows 10 KPIs in one view, you get complete clarity.
Click to buy SaaS Business KPI Scorecard In Excel
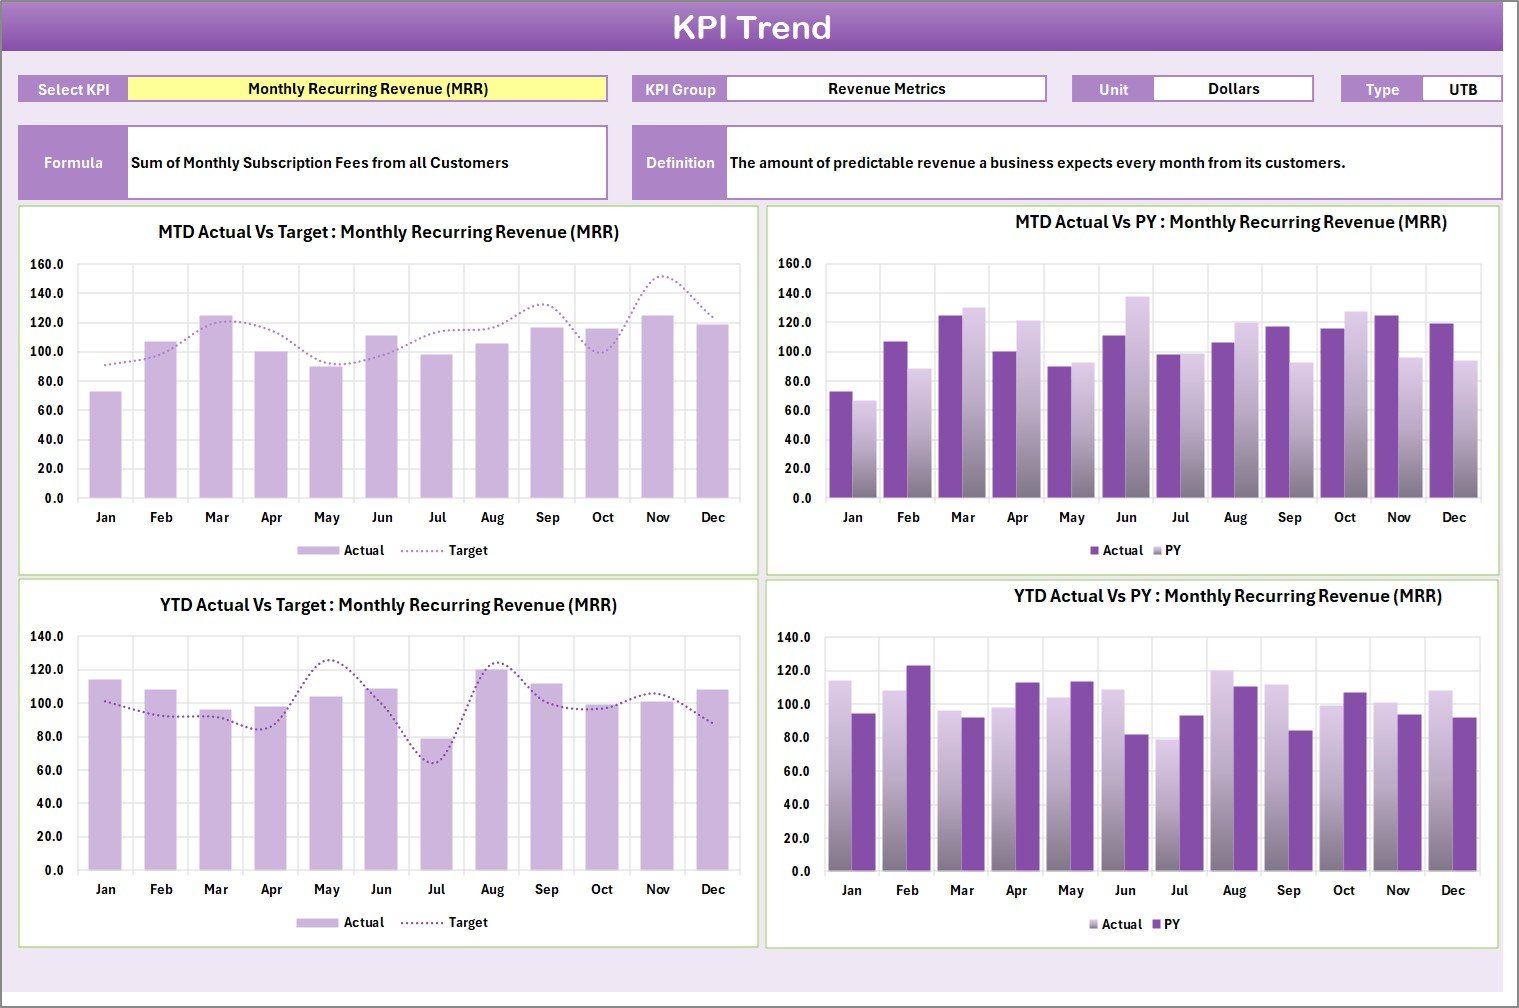
KPI Trend Sheet
The KPI Trend Sheet provides deeper analysis for individual KPIs.
How It Works
You select a KPI name from the dropdown in cell C3. Immediately, the sheet updates to display detailed information.
Information Displayed
- KPI Group
- Unit of KPI
- Type (Lower the Better or Upper the Better)
- Formula
- KPI Definition
Therefore, you understand not only the number but also the logic behind it.
Trend Charts Included
The sheet shows:
- MTD Trend Chart
- YTD Trend Chart
- Actual vs Target vs Previous Year comparison
Because of this visual trend analysis, you can:
- Detect seasonal patterns
- Compare growth trends
- Analyze improvement over time
For example, if Monthly Recurring Revenue increases steadily but churn also increases, you can take corrective action immediately.
Click to buy SaaS Business KPI Scorecard In Excel
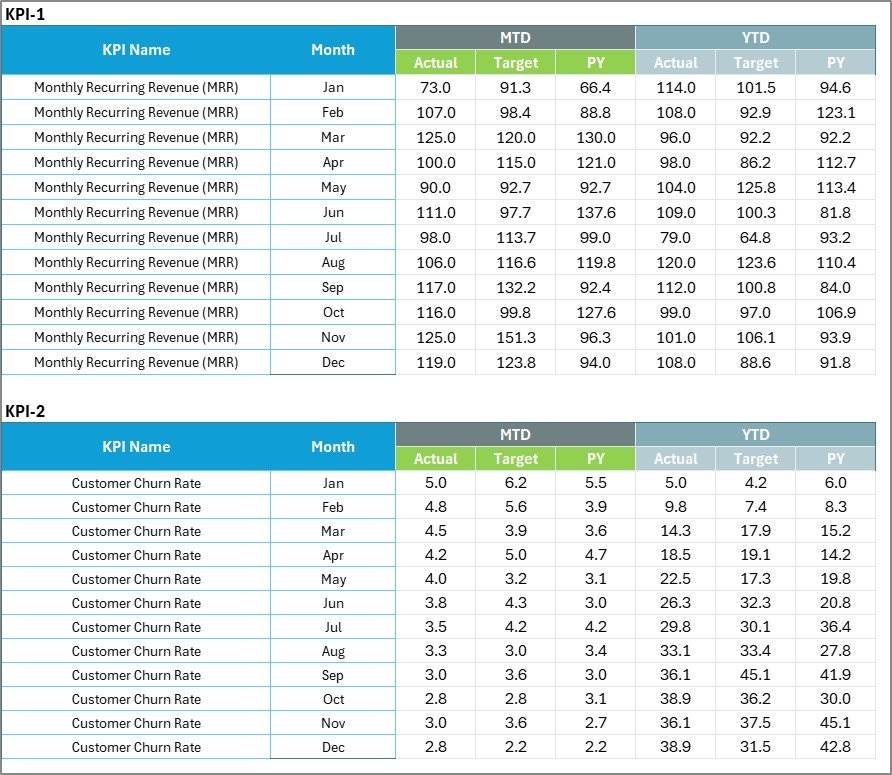
Input Data Sheet
The Input Data Sheet acts as the backbone of the entire scorecard.
Data Entry Section
You enter:
- Actual values
- Target values
- Monthly numbers
Once you update data, the scorecard refreshes automatically.
Flexibility and Control
You can:
- Add new months
- Update targets
- Modify KPI values
Therefore, the scorecard always stays current.
Moreover, Excel formulas ensure calculations remain accurate.
Click to buy SaaS Business KPI Scorecard In Excel
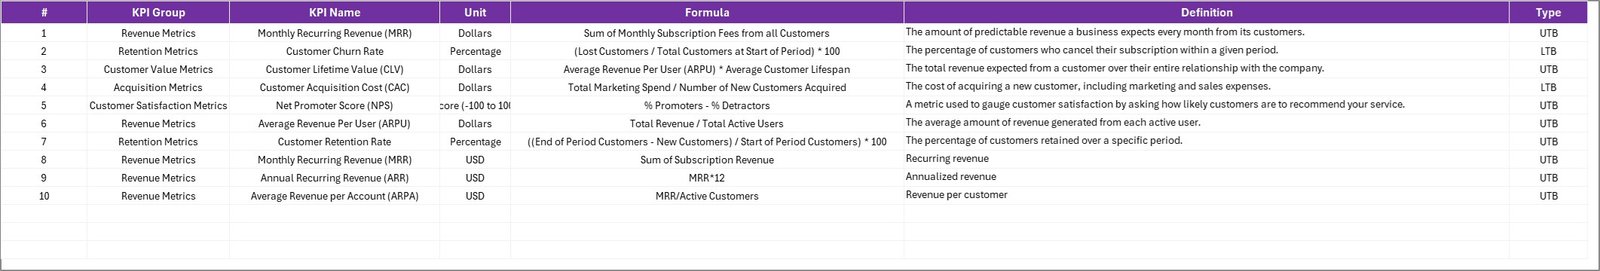
KPI Definition Sheet
Many businesses track KPIs without defining them properly. That creates confusion.
The KPI Definition Sheet solves that problem.
What You Enter Here
- KPI Name
- KPI Group
- Unit
- Formula
- KPI Definition
For example:
- KPI Name: Customer Churn Rate
- Unit: %
- Formula: (Customers Lost ÷ Total Customers) × 100
- Type: Lower the Better
Because of this structured definition, everyone in your team understands the KPI clearly.
Click to buy SaaS Business KPI Scorecard In Excel
Which KPIs Should You Track in a SaaS Business?
Although the template supports customization, most SaaS companies track these 10 core KPIs:
- Monthly Recurring Revenue (MRR)
- Annual Recurring Revenue (ARR)
- Customer Acquisition Cost (CAC)
- Customer Lifetime Value (CLV)
- Churn Rate
- Net Revenue Retention
- Average Revenue Per User (ARPU)
- Conversion Rate
- Active Users
- Gross Margin
When you monitor these metrics consistently, you gain full visibility into growth and profitability.
Advantages of SaaS Business KPI Scorecard In Excel
Now let us explore why this tool adds massive value.
Centralized Performance Tracking
You see all KPIs in one place. Therefore, you avoid scattered data.
Easy Customization
Excel allows you to:
- Add new KPIs
- Modify formulas
- Change layouts
So, the template adapts to your business model.
Clear Visual Indicators
Color coding helps you identify performance gaps instantly.
Better Decision-Making
Because you compare Actual vs Target regularly, you act faster.
Budget-Friendly Solution
Excel eliminates the need for expensive analytics tools.
Improved Accountability
When you assign KPIs to teams, performance tracking becomes transparent.
Professional Reporting
You can present structured KPI reports to investors confidently.
How Does This Scorecard Improve SaaS Growth?
Let us break it down practically.
If MRR grows consistently
You know your subscription strategy works.
If CAC increases
You adjust marketing campaigns.
If churn rises
You improve customer experience.
Therefore, instead of reacting late, you respond early.
Best Practices for the SaaS Business KPI Scorecard In Excel
To maximize results, follow these best practices.
Define KPIs Clearly
Use the KPI Definition Sheet properly. Always define formula and unit clearly.
Update Data Monthly
Set a fixed date every month for data entry. Consistency ensures accuracy.
Review MTD and YTD Regularly
MTD helps short-term monitoring. YTD shows long-term trends.
Focus on Actionable Metrics
Track KPIs that directly impact revenue and retention.
Avoid Tracking Too Many KPIs
Stick to 10–15 meaningful metrics. Otherwise, you lose focus.
Use Visual Indicators Smartly
Keep color coding simple:
- Green for good
- Red for underperformance
- Yellow for warning
Share Scorecard with Leadership Team
Discuss KPI trends in monthly review meetings.
How to Implement SaaS KPI Scorecard Successfully?
Implementation requires discipline.
Step 1: Define business objectives
Step 2: Select relevant KPIs
Step 3: Enter baseline targets
Step 4: Update monthly data
Step 5: Analyze trends
Step 6: Take corrective actions
If you follow this process consistently, your scorecard becomes a powerful growth tool.
Who Can Benefit from SaaS Business KPI Scorecard In Excel?
This template works perfectly for:
- SaaS founders
- Startup teams
- Finance managers
- Growth marketers
- Operations managers
- Product managers
Even small SaaS startups can use it effectively.
Conclusion: Why Should You Start Using SaaS KPI Scorecard Today?
SaaS businesses depend on numbers. However, numbers without structure create chaos.
A SaaS Business KPI Scorecard In Excel gives you:
- Structure
- Clarity
- Control
- Insight
It transforms raw data into meaningful performance analysis. Moreover, it helps you detect risks early and accelerate growth.
If you want consistent SaaS growth, start tracking KPIs in a disciplined way. This scorecard provides the perfect foundation.
Frequently Asked Questions with Answers
What is the purpose of a SaaS KPI Scorecard?
A SaaS KPI Scorecard tracks performance metrics like MRR, churn, and CAC. It helps businesses monitor growth and profitability.
Can I customize the KPI list?
Yes. You can easily add, remove, or modify KPIs based on your business needs.
What is the difference between MTD and YTD?
MTD shows performance for the current month until today. YTD shows performance from the beginning of the year until today.
How often should I update the scorecard?
You should update it monthly. However, you can also review weekly if needed.
Does this template require advanced Excel skills?
No. Basic Excel knowledge is enough to operate the scorecard.
Why should I track churn rate carefully?
Churn directly impacts revenue. Even a small increase reduces long-term profitability significantly.
Can startups use this KPI scorecard?
Yes. Startups benefit greatly because it brings structure to early-stage growth.
Visit our YouTube channel to learn step-by-step video tutorials
Watch the step-by-step video tutorial:
Click to buy SaaS Business KPI Scorecard In Excel