Managing corporate cash, loans, interest rates, and counterparty exposure requires precision. However, many finance teams still rely on scattered spreadsheets. As a result, they lose visibility. Moreover, decision-makers struggle to track liquidity, monitor risk, and control interest costs.
So, how can treasury teams monitor balances, inflows, outflows, risk ratings, and interest exposure in one structured system?
The answer is simple.
You need a Treasury Management Dashboard in Excel.
Click to Purchases Treasury Management Dashboard in Excel
This ready-to-use dashboard helps treasury professionals track cash flow, loan exposure, bank performance, counterparty risk, and interest trends in one centralized Excel framework. Furthermore, it enables fast monthly analysis. Therefore, you gain clarity, control, and confidence in your financial decisions.
In this detailed guide, you will learn:
-
What a Treasury Management Dashboard in Excel is
-
Why treasury teams need it
-
Detailed explanation of all 5 analytical pages
-
Advantages of Treasury Management Dashboard in Excel
-
Best practices for using the dashboard
-
Frequently Asked Questions with Answers
Let us explore everything step by step.
What Is a Treasury Management Dashboard in Excel?
A Treasury Management Dashboard in Excel is a structured financial reporting tool built inside Microsoft Excel. It allows finance teams to monitor:
-
Cash inflows and outflows
-
Opening and closing balances
-
Loan amounts
-
Interest rate exposure
-
Interest expense
-
Bank-wise transactions
-
Counterparty risk rating
-
Account type performance
Instead of using multiple files, you manage everything inside one interactive Excel dashboard. Moreover, you can analyze performance by bank name, counterparty, account type, and month.
As a result, you reduce manual errors and improve financial visibility.
Why Do Treasury Teams Need a Dashboard in Excel?
Treasury departments handle large transaction volumes daily. However, without structured reporting, issues grow quickly.
For example:
-
Cash shortages appear unexpectedly
-
Interest costs increase without warning
-
Counterparty risk goes unnoticed
-
Liquidity planning becomes reactive
Therefore, treasury leaders need a system that shows:
-
Real-time financial exposure
-
Risk concentration
-
Bank dependency
-
Monthly liquidity trends
A Treasury Management Dashboard in Excel solves these challenges. In addition, it helps CFOs and finance managers make faster decisions.
Key Features of Treasury Management Dashboard in Excel
This dashboard includes a Page Navigator located on the left side. This feature allows smooth navigation across all analytical pages. Consequently, users move between analysis pages instantly without confusion.
The dashboard contains 5 analytical pages plus support and data sheets.
Let us explore each page in detail.
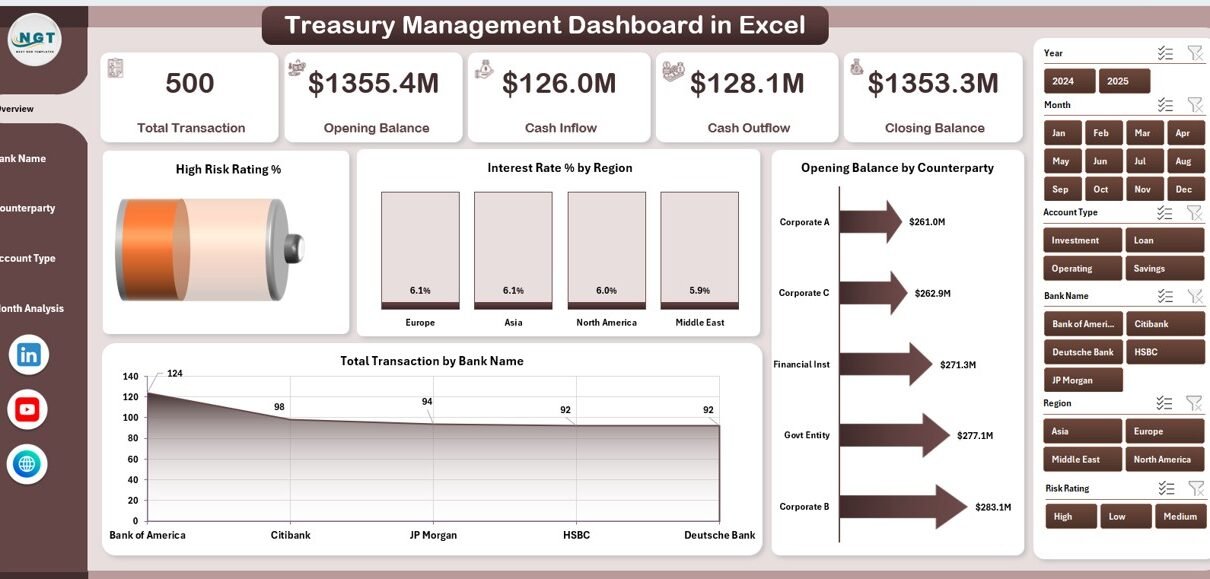
1️⃣ Overview Page – What Does the Main Treasury Summary Show?
The Overview Page acts as the command center. On the right side, you find a slicer that filters data dynamically.
In addition, this page includes 4 KPI cards and 4 powerful charts.
KPI Cards Display:
-
High Risk Rating %
-
Interest Rate %
-
Opening Balance
-
Total Transactions
Charts Included:
-
High Risk Rating %
This chart shows the percentage of high-risk counterparties. Therefore, treasury managers quickly identify exposure concentration. -
Interest Rate % by Region
This visual highlights regional interest rate trends. As a result, teams understand geographic borrowing costs. -
Opening Balance by Counterparty
This chart shows how much cash or loan exposure exists with each counterparty. -
Total Transactions by Bank Name
This visual reveals bank activity levels. Consequently, finance teams identify dependency risk.
Because this page summarizes all key metrics, executives gain instant financial visibility.
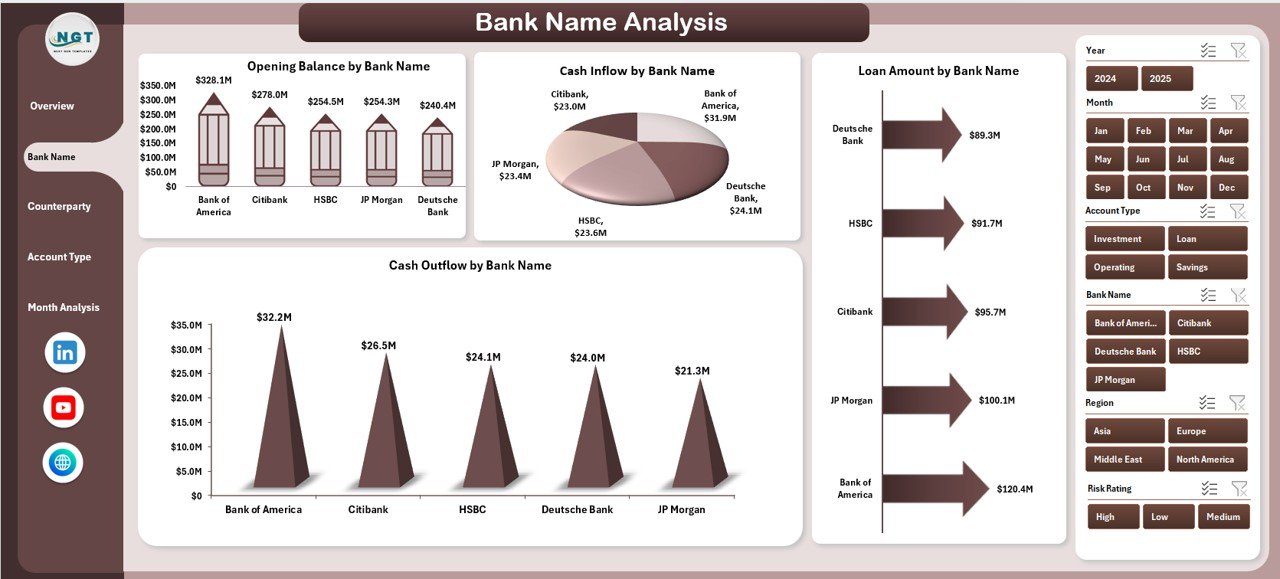
2️⃣ Bank Name Analysis – How Does Each Bank Perform?
Treasury teams work with multiple banks. However, dependency on one bank increases operational risk.
Click to Purchases Treasury Management Dashboard in Excel
The Bank Name Analysis page solves this issue.
It includes a right-side slicer and 4 detailed charts:
Charts:
-
Opening Balance by Bank Name
-
Cash Inflow by Bank Name
-
Loan Amount by Bank Name
-
Cash Outflow by Bank Name
This page helps answer critical questions:
-
Which bank holds the highest balance?
-
Which bank processes the most inflows?
-
Where do we borrow the most?
-
Which bank handles the largest outflows?
Therefore, treasury teams diversify risk and optimize banking relationships.
3️⃣ Counterparty Analysis – Where Is the Risk Concentration?
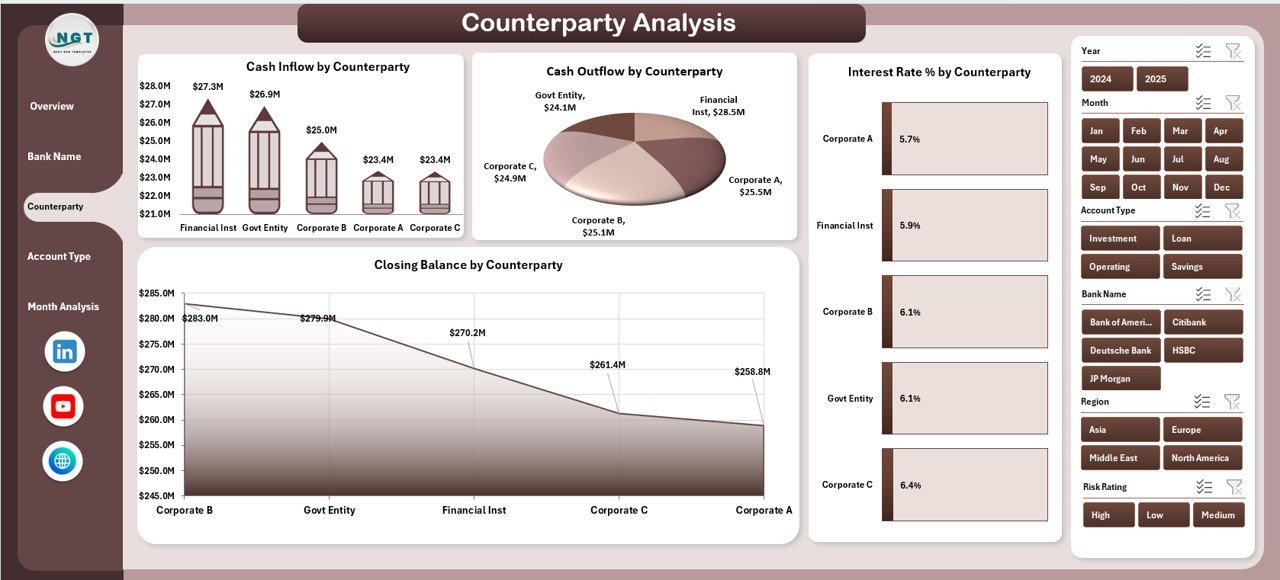
Counterparty exposure affects treasury stability. Therefore, monitoring it becomes essential.
The Counterparty Analysis page includes:
-
Cash Inflow by Counterparty
-
Cash Outflow by Counterparty
-
Interest Rate % by Counterparty
-
Closing Balance by Counterparty
This analysis helps finance teams:
-
Monitor exposure concentration
-
Identify high-cost counterparties
-
Reduce dependency risk
-
Improve credit risk monitoring
As a result, organizations protect liquidity and financial stability.
4️⃣ Account Type Analysis – Which Accounts Drive Performance?
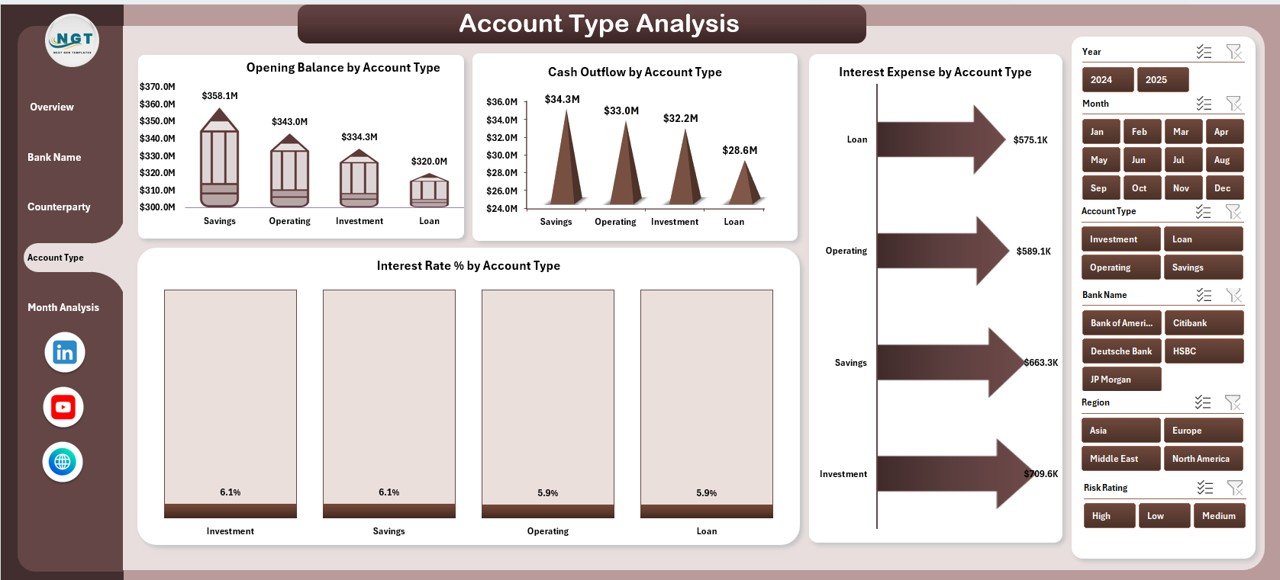
Treasury operations include different account types such as:
-
Savings Accounts
-
Current Accounts
-
Loan Accounts
-
Investment Accounts
The Account Type Analysis page provides:
-
Opening Balance by Account Type
-
Cash Outflow by Account Type
-
Interest Expense by Account Type
-
Interest Rate % by Account Type
Therefore, finance leaders identify which account type drives cost or returns.
In addition, they adjust strategy accordingly.
5️⃣ Month Analysis – How Do Cash Flows Change Over Time?

Liquidity planning requires monthly visibility.
The Month Analysis page includes:
-
Cash Inflow by Month
-
Interest Rate % by Month
-
Cash Outflow by Month
Because of this time-based analysis:
-
Treasury teams forecast liquidity gaps
-
CFOs plan borrowing in advance
-
Finance managers optimize working capital
Thus, the organization avoids financial surprises.
Support Sheet – What Does It Do?
Click to Purchases Treasury Management Dashboard in Excel
The Support Sheet manages structured calculations and intermediate formulas. It organizes backend logic. Therefore, the dashboard remains clean and user-friendly.
Data Sheet – Where Is the Data Stored?
The Data Sheet captures raw treasury transactions such as:
-
Transaction Date
-
Bank Name
-
Counterparty
-
Account Type
-
Opening Balance
-
Cash Inflow
-
Cash Outflow
-
Loan Amount
-
Interest Rate
-
Risk Rating
Because this sheet follows structured table format, Excel formulas and PivotTables update automatically.
Advantages of Treasury Management Dashboard in Excel
Using this dashboard provides strong benefits.
1️⃣ Improved Financial Visibility
You see balances, loans, and interest rates instantly. Therefore, you reduce uncertainty.
2️⃣ Better Risk Monitoring
You monitor high-risk counterparties clearly. As a result, you reduce credit exposure.
3️⃣ Faster Decision Making
Executives analyze financial performance in seconds. Consequently, they act quickly.
4️⃣ Reduced Manual Errors
Excel automation minimizes repetitive work. Therefore, reporting becomes accurate.
5️⃣ Centralized Data Control
You manage all treasury data in one structured system. In addition, you avoid scattered files.
6️⃣ Cost Control
Interest expense tracking helps reduce borrowing costs. Thus, profitability improves.
Best Practices for the Treasury Management Dashboard in Excel
To maximize dashboard effectiveness, follow these best practices:
✅ Use Structured Excel Tables
Convert raw data into Excel Tables. Therefore, PivotTables update automatically.
✅ Update Data Regularly
Enter transactions daily or weekly. Consequently, reports remain accurate.
✅ Validate Data Entries
Check interest rates, balances, and risk ratings before updating.
✅ Use Consistent Naming
Maintain standardized bank and counterparty names. As a result, analysis stays clean.
✅ Protect Formula Cells
Lock formula cells to avoid accidental changes.
✅ Review Risk Monthly
Analyze high-risk exposure every month. Therefore, you prevent financial shocks.
✅ Monitor Liquidity Trends
Track monthly inflow vs outflow patterns consistently.
How Does This Dashboard Help CFOs and Finance Managers?
CFOs need clarity. Finance managers need control.
This dashboard provides:
-
Real-time liquidity monitoring
-
Counterparty exposure tracking
-
Interest rate analysis
-
Loan performance visibility
-
Bank concentration monitoring
Therefore, leadership makes proactive financial decisions.
Who Should Use Treasury Management Dashboard in Excel?
Click to Purchases Treasury Management Dashboard in Excel
This dashboard suits:
-
Corporate Treasury Teams
-
CFOs
-
Finance Managers
-
Banking Professionals
-
Investment Managers
-
Financial Controllers
Moreover, small and mid-sized companies benefit greatly because they can manage treasury without expensive software.
How to Implement Treasury Management Dashboard in Excel?
Follow these steps:
-
Collect historical treasury data
-
Standardize account and bank names
-
Upload data into the Data Sheet
-
Refresh PivotTables
-
Review Overview page
-
Analyze Bank, Counterparty, and Account Type pages
-
Monitor monthly trends
Because Excel allows flexibility, you can customize KPIs easily.
Conclusion – Why Should You Use Treasury Management Dashboard in Excel?
Treasury management requires clarity, speed, and accuracy. However, traditional spreadsheets create confusion.
A Treasury Management Dashboard in Excel brings structure. It centralizes data. Moreover, it improves visibility. As a result, treasury teams manage liquidity confidently.
Therefore, if you want better financial control, reduced risk, and improved decision-making, this dashboard becomes an essential tool.
Frequently Asked Questions with Answers
1️⃣ What is a Treasury Management Dashboard in Excel?
It is a structured Excel tool that tracks cash flow, balances, loans, interest rates, and counterparty exposure in one system.
2️⃣ Can small businesses use this dashboard?
Yes. Small and medium businesses can use it easily because Excel provides flexibility and low cost.
3️⃣ Does this dashboard require advanced Excel skills?
No. Users need basic Excel knowledge. However, understanding PivotTables improves usage.
4️⃣ How often should treasury data be updated?
You should update data daily or weekly. Therefore, reports remain accurate.
5️⃣ Can I customize the dashboard?
Yes. You can add new KPIs, banks, counterparties, and account types according to your needs.
6️⃣ How does it help reduce financial risk?
It shows high-risk exposure, interest trends, and bank concentration. Therefore, finance teams act early.
7️⃣ Is this dashboard better than manual reporting?
Yes. It reduces errors, saves time, and improves visibility.
Visit our YouTube channel to learn step-by-step video tutorials