Managing leases across multiple properties, cities, and regions often becomes complicated. Many organizations still rely on scattered spreadsheets. As a result, they struggle to track rent, maintenance costs, escalation percentages, and security deposits effectively. Moreover, decision-makers often lack real-time visibility into lease performance.
So, how can property managers and finance teams monitor lease data in one centralized system?
The answer is simple.
You need a Lease Management Dashboard in Power BI.
Click to Purchases Lease Management Dashboard in Power BI
This powerful and ready-to-use dashboard helps organizations track lease metrics, monitor maintenance expenses, analyze regional performance, and control escalation trends in one interactive environment. Furthermore, it enables fast monthly analysis and better decision-making. Therefore, you gain clarity, control, and confidence in managing your lease portfolio.
In this detailed guide, you will learn:
-
What a Lease Management Dashboard in Power BI is
-
Why organizations need it
-
Detailed explanation of all 5 analytical pages
-
Advantages of the dashboard
-
Best practices for implementation
-
Frequently asked questions
Let us explore everything step by step.
What Is a Lease Management Dashboard in Power BI?
A Lease Management Dashboard in Power BI is a structured and interactive reporting solution that helps organizations monitor lease-related financial and operational metrics. It consolidates lease data into visual reports, so users can quickly understand performance trends.
Instead of manually reviewing multiple files, users can analyze:
-
Monthly rent performance
-
Escalation percentages
-
Maintenance costs
-
Security deposits
-
Lease distribution by city, region, and property type
Because the dashboard updates dynamically, teams can make faster and more accurate decisions. In addition, Power BI enables powerful filtering through slicers (silencers), which improves user experience significantly.
Why Do Businesses Need a Lease Management Dashboard?
Managing lease portfolios without proper analytics creates several challenges. However, a well-designed dashboard solves these problems quickly.
Common Challenges Without a Dashboard
-
Lease data remains scattered across files
-
Maintenance costs become difficult to control
-
Escalation trends remain unclear
-
Regional performance lacks visibility
-
Decision-making becomes slow and reactive
How the Dashboard Solves These Issues
On the other hand, the Lease Management Dashboard provides:
-
Centralized lease visibility
-
Real-time performance monitoring
-
Interactive filtering by city, region, and property type
-
Better cost control
-
Faster financial insights
Therefore, organizations can manage their lease portfolios more efficiently.
Key Features of the Lease Management Dashboard in Power BI
This ready-to-use dashboard contains 5 powerful analytical pages in the Power BI Desktop file. Each page focuses on a specific dimension of lease performance.
Let us review each page in detail.
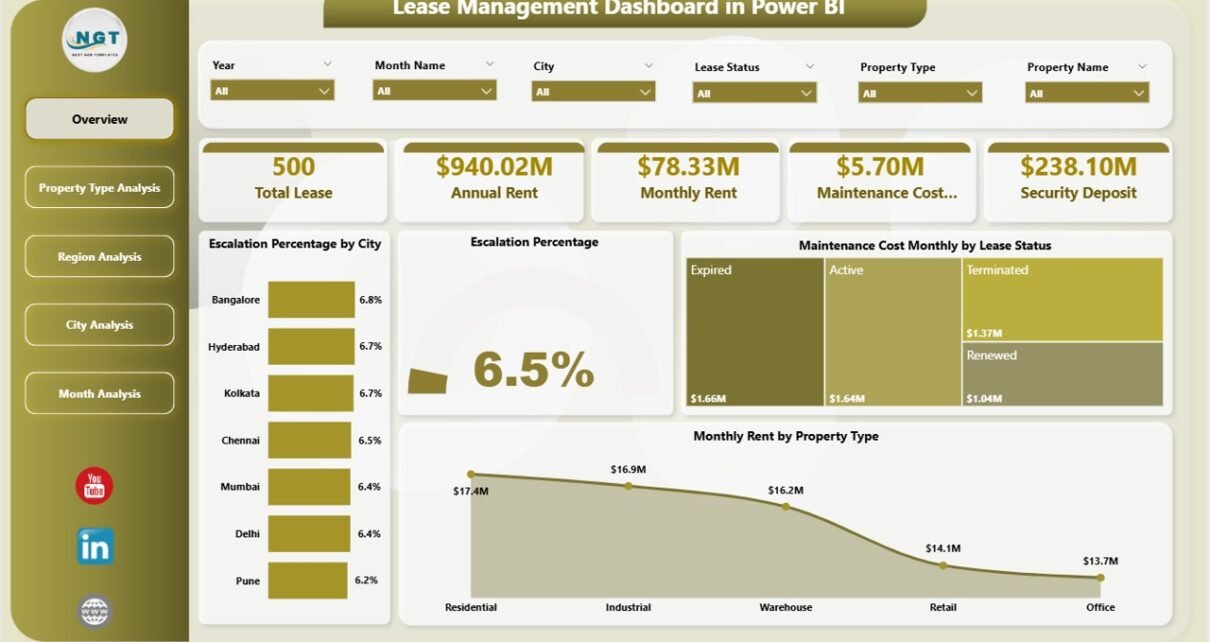
Page 1: Overview Dashboard – Your Command Center
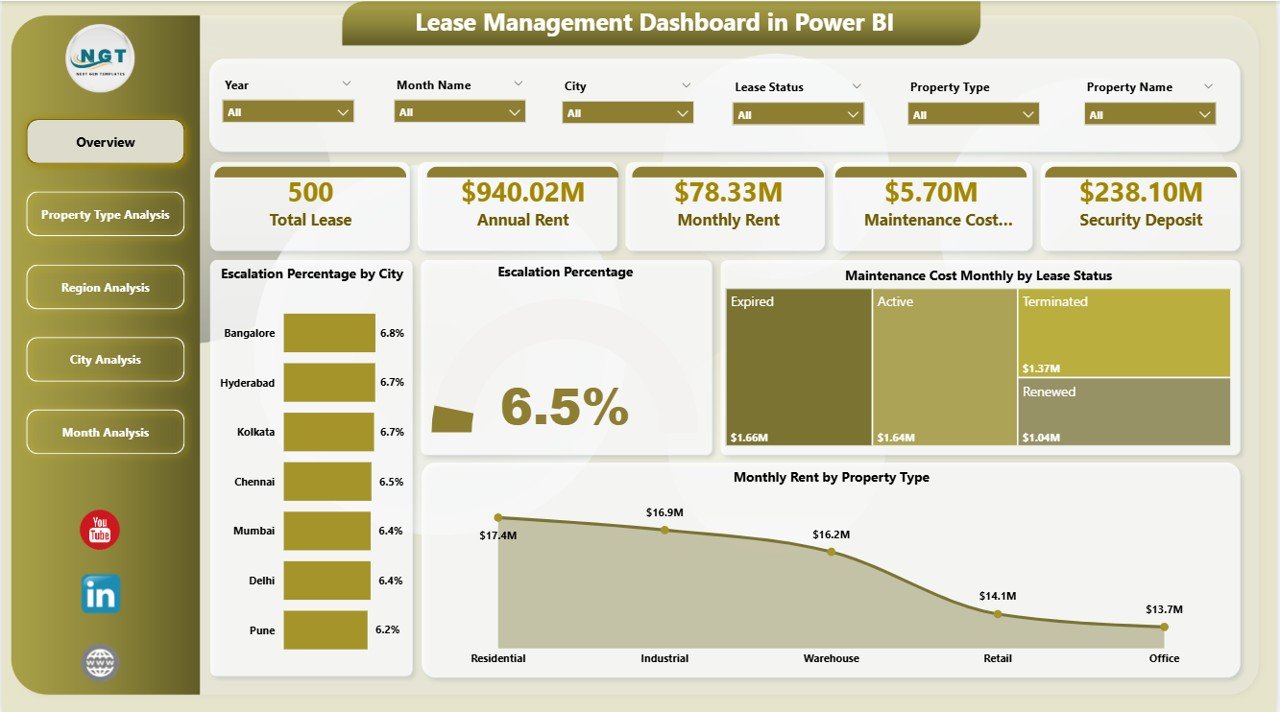
The Overview Page acts as the main control center of the dashboard. Here, users can quickly understand the overall lease performance.
What Makes the Overview Page Important?
Because executives often need quick insights, this page highlights the most critical KPIs and charts in one place. Moreover, slicers allow users to filter the entire dashboard instantly.
Key Elements on the Overview Page
Click to Purchases Lease Management Dashboard in Power BI
✅ Interactive Slicers (Silencers)
Users can filter data dynamically by key dimensions. As a result, the dashboard updates instantly.
✅ KPI Cards
The page displays 5 important cards that summarize lease performance at a glance.
📊 Visual Charts Included
-
Escalation % by City
-
Overall Escalation %
-
Maintenance Cost Monthly by Lease Status
-
Monthly Rent by Property Type
What Insights Can You Get?
Using this page, users can:
-
Identify cities with high escalation
-
Monitor overall escalation trend
-
Compare maintenance cost by lease status
-
Analyze rent distribution by property type
Therefore, this page supports quick executive decision-making.
Page 2: Property Type Analysis – Which Property Performs Best?
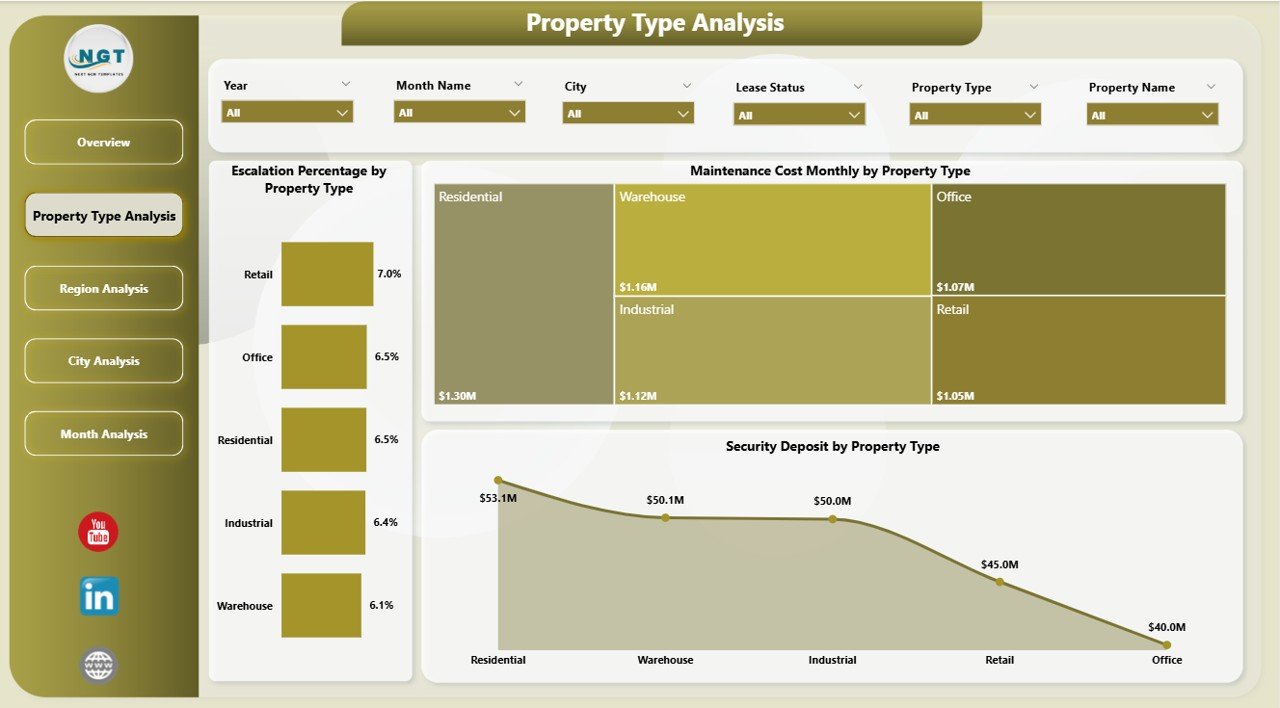
The Property Type Analysis Page helps organizations evaluate lease performance across different property categories.
Because property types behave differently, this analysis becomes extremely valuable.
Charts Available on This Page
-
Escalation % by Property Type
-
Maintenance Cost Monthly by Property Type
-
Security Deposit by Property Type
Why This Page Matters
With this page, users can:
-
Compare commercial vs residential performance
-
Identify property types with high maintenance costs
-
Monitor deposit exposure by property category
-
Optimize leasing strategy
For example, if commercial properties show higher maintenance costs, managers can investigate the root cause quickly.
Click to Purchases Lease Management Dashboard in Power BI
Page 3: Region Analysis – How Do Regions Compare?
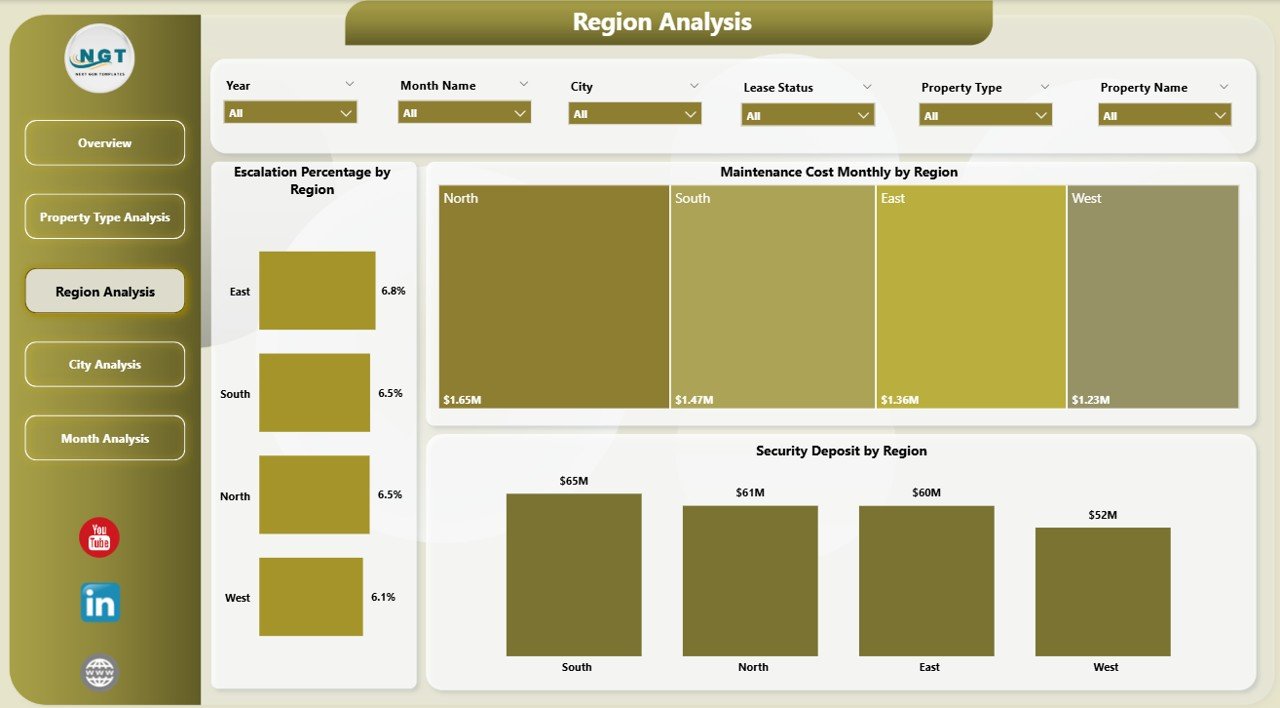
Regional performance often varies significantly. Therefore, the Region Analysis Page provides location-based insights.
Visuals Included
-
Escalation % by Region
-
Maintenance Cost Monthly by Region
-
Security Deposit by Region
Key Benefits of Regional Analysis
This page helps users:
-
Identify high-cost regions
-
Monitor regional escalation trends
-
Compare deposit exposure geographically
-
Support expansion decisions
Because regional insights drive strategic planning, this page becomes essential for large organizations.
Page 4: City Analysis – Deep Dive into City Performance
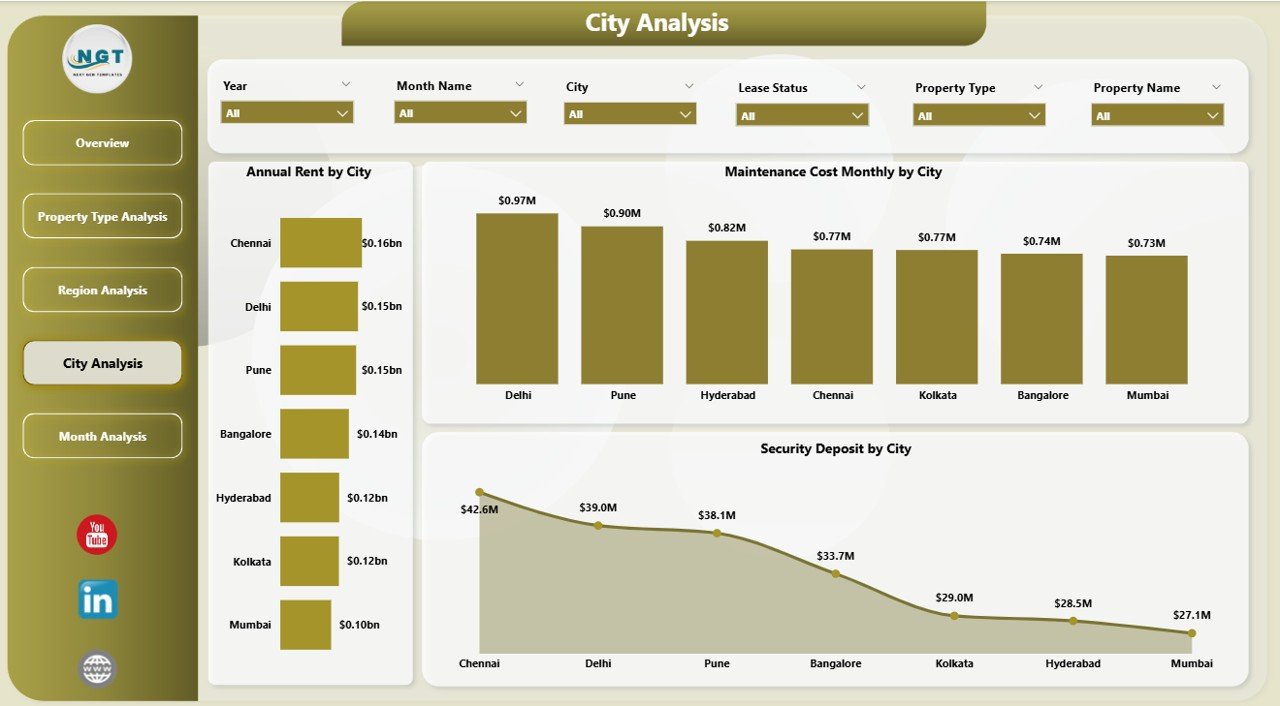
While regional analysis provides a broader view, the City Analysis Page offers a more granular perspective.
As a result, users can pinpoint performance at the city level.
Charts Available
-
Annual Rent by City
-
Maintenance Cost Monthly by City
-
Security Deposit by City
Why City-Level Analysis Is Powerful
With this page, organizations can:
-
Identify top revenue-generating cities
-
Detect cities with rising maintenance costs
-
Monitor deposit concentration
-
Support location-specific decisions
Therefore, property managers can act faster and more precisely.
Page 5: Month Analysis – Track Trends Over Time
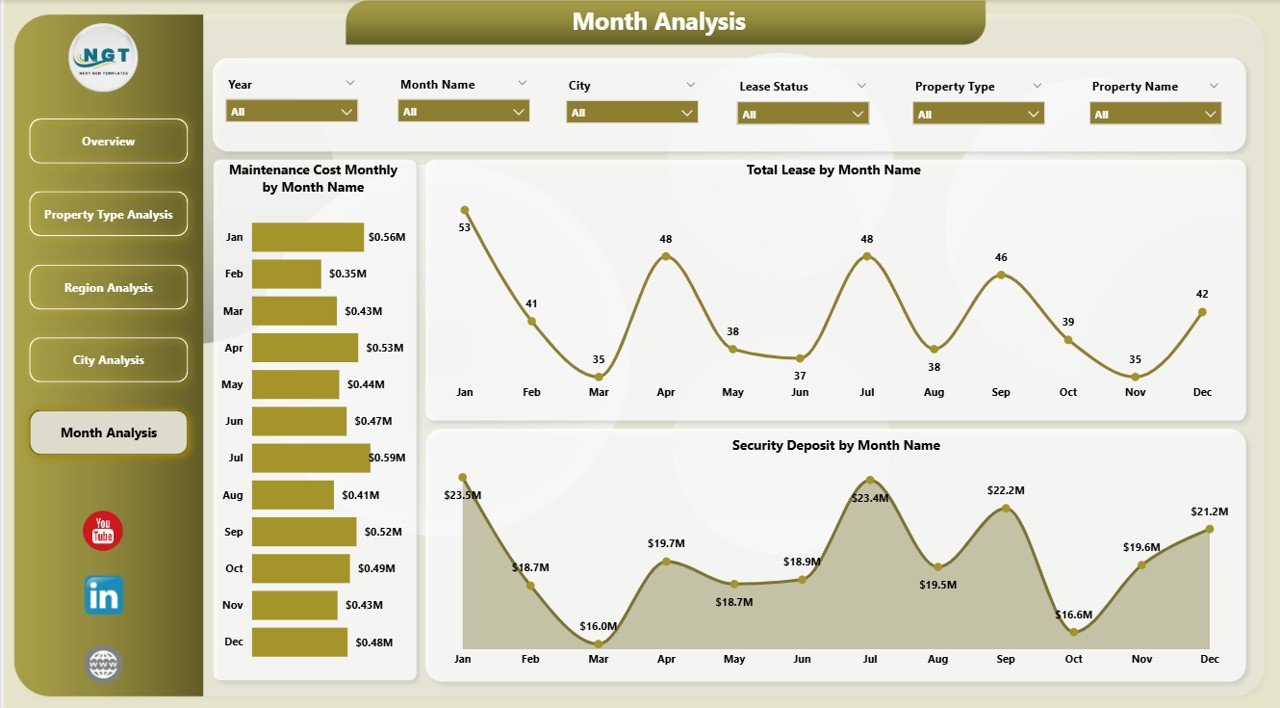
Time-based analysis plays a critical role in lease management. Hence, the Month Analysis Page focuses on monthly trends.
Visuals Included
-
Total Lease by Month
-
Maintenance Cost Monthly by Month
-
Security Deposit by Month
What Can You Discover?
Using this page, teams can:
-
Monitor lease growth trends
-
Track monthly maintenance spikes
-
Analyze deposit movement over time
-
Forecast future lease performance
Because trends drive planning, this page supports proactive management.
Advantages of Lease Management Dashboard in Power BI
Implementing this dashboard delivers significant business value. Let us explore the major advantages.
🚀 Improved Visibility
-
Centralized lease information
-
Real-time performance monitoring
-
Clear visual insights
📊 Better Financial Control
Click to Purchases Lease Management Dashboard in Power BI
-
Track maintenance expenses easily
-
Monitor rent performance
-
Control escalation impact
⚡ Faster Decision-Making
-
Interactive slicers
-
Instant data refresh
-
Executive-ready visuals
🎯 Enhanced Risk Management
-
Monitor security deposits
-
Identify high-risk regions
-
Track cost spikes early
🔍 Deep Analytical Capability
-
Multi-dimensional analysis
-
Time-based trend tracking
-
Property-wise comparison
Therefore, organizations gain a strong competitive advantage.
Who Should Use This Dashboard?
This dashboard suits multiple roles and industries.
Ideal Users
-
Real estate companies
-
Property managers
-
Finance teams
-
Facility management firms
-
Retail chains with leased stores
-
Corporate real estate teams
If your organization manages multiple leases, this dashboard will add immediate value.
Best Practices for the Lease Management Dashboard
To maximize the benefits of this dashboard, follow these proven best practices.
✅ Keep Your Data Clean
-
Standardize city and region names
-
Remove duplicate lease records
-
Validate rent and deposit values
Clean data ensures accurate insights.
✅ Update Data Regularly
-
Refresh data monthly
-
Automate data imports when possible
-
Review anomalies quickly
Regular updates keep insights reliable.
✅ Use Slicers Strategically
-
Avoid too many filters
-
Focus on key business dimensions
-
Train users on slicer usage
Proper slicer usage improves usability.
✅ Monitor Key KPIs Frequently
-
Escalation %
-
Maintenance cost
-
Monthly rent
-
Security deposits
Frequent monitoring prevents surprises.
✅ Customize for Your Business
-
Add company-specific KPIs
-
Adjust visuals if required
-
Align with internal reporting
Customization increases adoption.
How Does This Dashboard Improve Decision-Making?
Click to Purchases Lease Management Dashboard in Power BI
This dashboard transforms raw lease data into actionable intelligence.
Because leaders can see trends instantly, they can:
-
Optimize lease negotiations
-
Reduce maintenance costs
-
Improve location strategy
-
Manage financial exposure
-
Plan future expansions
As a result, organizations move from reactive management to proactive control.
Conclusion: Take Control of Your Lease Portfolio
Managing leases manually wastes time and increases risk. However, the Lease Management Dashboard in Power BI changes the game completely.
It brings all lease metrics into one interactive environment. Moreover, it enables deep analysis across property types, regions, cities, and months. As a result, decision-makers gain full visibility and control.
If your organization wants smarter lease management, faster insights, and better financial control, this dashboard becomes an essential tool.
Now is the perfect time to modernize your lease analytics.
Frequently Asked Questions with Answers
❓ What is a Lease Management Dashboard in Power BI?
A Lease Management Dashboard in Power BI is an interactive reporting tool that tracks lease metrics such as rent, maintenance cost, escalation percentage, and security deposits in one centralized view.
❓ Who can use this dashboard?
Property managers, finance teams, real estate companies, and corporate real estate departments can use this dashboard effectively.
❓ Can I customize the dashboard?
Yes. You can easily add new KPIs, modify visuals, and adjust filters based on your business needs.
❓ How often should I update the data?
You should update the data monthly at minimum. However, weekly updates provide even better visibility.
❓ Does this dashboard support multiple properties?
Yes. The dashboard handles multiple properties, cities, regions, and property types efficiently.
❓ Why should I use Power BI instead of Excel?
Power BI offers:
-
Better interactivity
-
Faster performance with large data
-
Advanced visualizations
-
Easier sharing and publishing
Visit our YouTube channel to learn step-by-step video tutorials