Healthcare providers today handle massive volumes of patient and treatment data. However, many dermatology clinics still rely on scattered spreadsheets and manual reports. As a result, decision-makers often struggle to track appointments, doctor performance, treatment revenue, and regional trends in one place.
Therefore, clinics need a centralized, interactive, and easy-to-use reporting system. More importantly, they need real-time visibility to improve operational efficiency and patient satisfaction.
That is exactly where the Dermatology Clinics Dashboard in Excel becomes a powerful solution.
In this comprehensive guide, you will learn everything about this ready-to-use dashboard, including its structure, features, benefits, and best practices. By the end, you will clearly understand how this Excel dashboard can transform your dermatology clinic management.
Click to Purchases Dermatology Clinics Dashboard in Excel
What Is a Dermatology Clinics Dashboard in Excel?
A Dermatology Clinics Dashboard in Excel is an interactive reporting tool that tracks and analyzes key clinic metrics using structured data and dynamic visualizations.
Instead of reviewing multiple reports, you can monitor appointments, revenue, doctor performance, and regional activity in one centralized dashboard. Consequently, clinic managers make faster and smarter decisions.
This ready-to-use Excel file includes automated calculations, slicers, and pivot-based charts. Therefore, users can instantly filter and analyze performance across multiple dimensions.
Why Do Dermatology Clinics Need a Performance Dashboard?
Dermatology clinics operate in a fast-paced environment. Every day, clinics handle appointments, treatments, billing, and patient follow-ups. However, without proper analytics, clinics often face:
-
Poor visibility into appointment trends
-
Difficulty tracking doctor performance
-
Revenue leakage due to unmanaged discounts
-
Longer patient wait times
-
Inefficient regional planning
Because of these challenges, clinics must adopt a data-driven approach. A well-designed Excel dashboard solves these problems quickly and effectively.
Key Features of Dermatology Clinics Dashboard in Excel
The Dermatology Clinics Dashboard in Excel comes fully structured and ready to use. Moreover, it includes interactive navigation and multiple analytical views.
🧭 Page Navigator (Left Side Panel)
The dashboard includes a left-side page navigator that allows smooth movement between analytical pages.
Why it matters:
-
Improves user experience
-
Saves time while switching views
-
Makes the dashboard professional
-
Supports executive-level reporting
How Is the Dashboard Structured?
This Excel dashboard contains 5 powerful analytical pages, each designed for a specific business insight. Let us explore each page in detail.
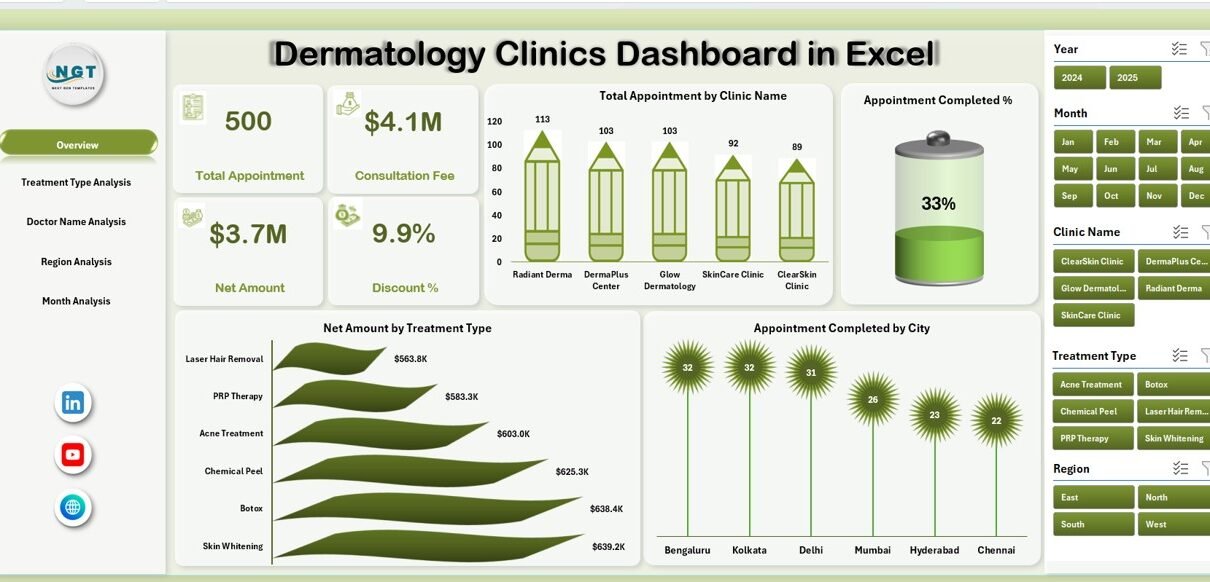
📊 1. Overview Page — The Executive Snapshot
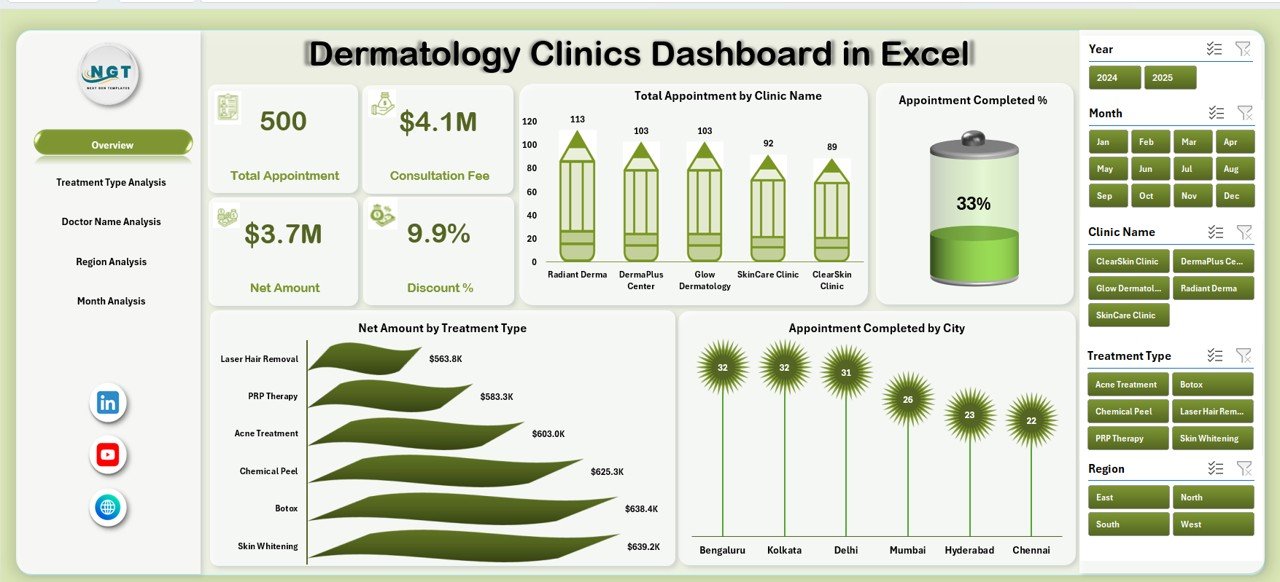
The Overview Page acts as the command center of the dashboard. It provides a high-level summary of clinic performance.
KPI Cards on Overview
The dashboard displays 4 powerful cards that highlight key metrics instantly. Because of these cards, decision-makers quickly understand overall performance.
Charts Available on Overview Page
• Total Appointment by Clinic Name
This chart shows which clinics handle the highest patient volume. Therefore, management can identify high-performing locations.
• Appointment Completed %
This metric measures operational efficiency. Moreover, it helps clinics monitor patient flow effectiveness.
• Net Amount by Treatment Type
This chart highlights the most profitable treatments. Consequently, clinics can focus on high-margin services.
• Appointment Completed by City
This visual reveals geographic performance trends. As a result, expansion decisions become easier.
Why the Overview page matters:
-
Provides quick executive insights
-
Highlights performance gaps
-
Supports fast decision-making
-
Improves clinic monitoring
🔬 2. Treatment Type Analysis — Which Treatments Perform Best?
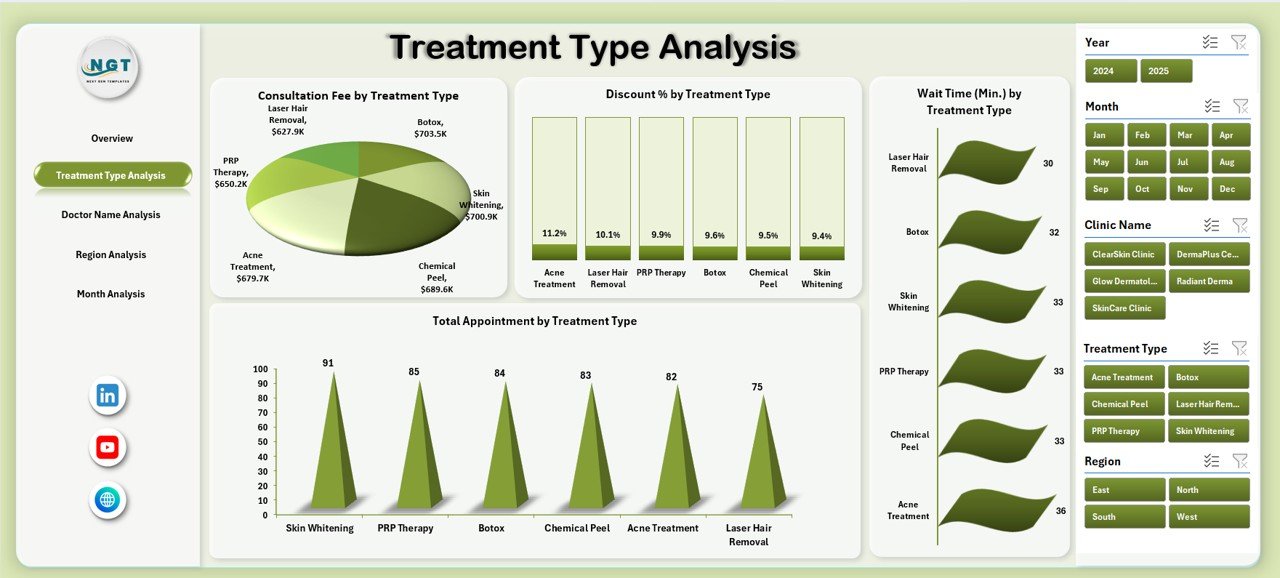
The Treatment Type Analysis page dives deeper into service-level performance. Therefore, clinic owners can optimize their treatment portfolio.
Charts in Treatment Type Analysis
Click to Purchases Dermatology Clinics Dashboard in Excel
• Consultation Fee by Treatment Type
This chart shows revenue distribution across treatments. As a result, clinics can adjust pricing strategies.
• Discount % by Treatment Type
This metric helps monitor discount leakage. Moreover, it ensures better revenue control.
• Wait Time by Treatment Type
Patient experience depends heavily on wait time. Therefore, this chart helps clinics improve service speed.
• Total Appointment by Treatment Type
This visual reveals the most popular treatments. Consequently, marketing teams can promote high-demand services.
Business value of this page:
-
Improves treatment profitability
-
Reduces unnecessary discounts
-
Enhances patient experience
-
Supports service optimization
👨⚕️ 3. Doctor Name Analysis — How Are Doctors Performing?
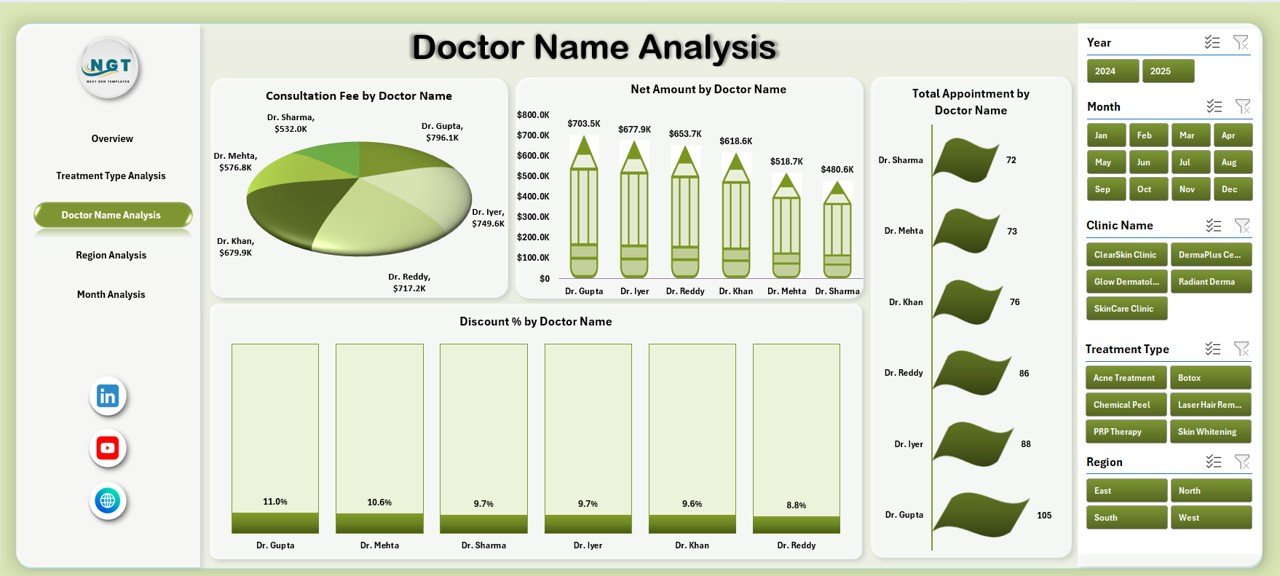
Doctor productivity directly impacts clinic success. Therefore, this page focuses on physician-level insights.
Charts in Doctor Analysis
• Consultation Fee by Doctor
This chart compares revenue generated by each doctor. As a result, management can evaluate contribution levels.
• Discount % by Doctor
This metric helps identify over-discounting behavior. Consequently, clinics maintain pricing discipline.
• Net Amount by Doctor
This visual highlights top revenue-generating doctors. Moreover, it supports performance reviews.
• Total Appointment by Doctor
This chart shows patient load distribution among doctors. Therefore, clinics can balance workloads effectively.
Why this page is powerful:
-
Enables doctor performance tracking
-
Supports incentive planning
-
Improves workload balancing
-
Increases accountability
-
Click to Purchases Dermatology Clinics Dashboard in Excel
🌍 4. Region Analysis — Where Is the Growth Coming From?
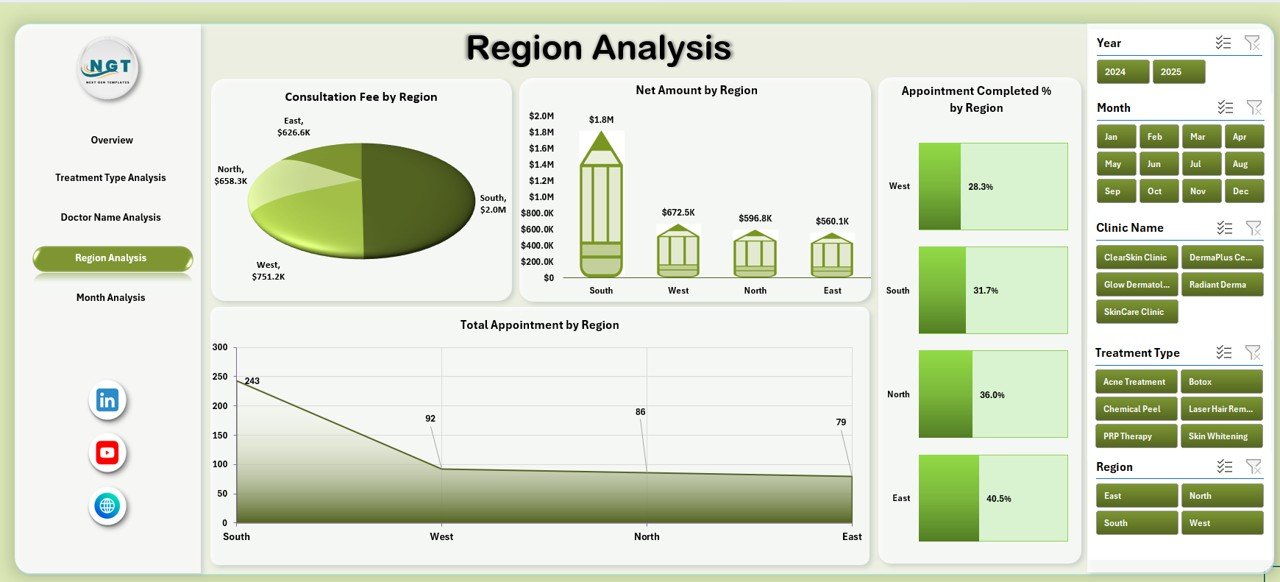
The Region Analysis page helps clinics understand geographic performance patterns. Because of this view, expansion planning becomes data-driven.
Charts in Region Analysis
• Consultation Fee by Region
This chart shows revenue contribution by region.
• Appointment Completed by Region
This metric reveals operational efficiency geographically.
• Net Amount by Region
This visual highlights profitable regions.
• Total Appointment by Region
This chart identifies high-demand territories.
Strategic benefits:
-
Supports regional expansion
-
Improves resource allocation
-
Identifies underperforming areas
-
Enhances market planning
📅 5. Month Analysis — How Do Trends Change Over Time?
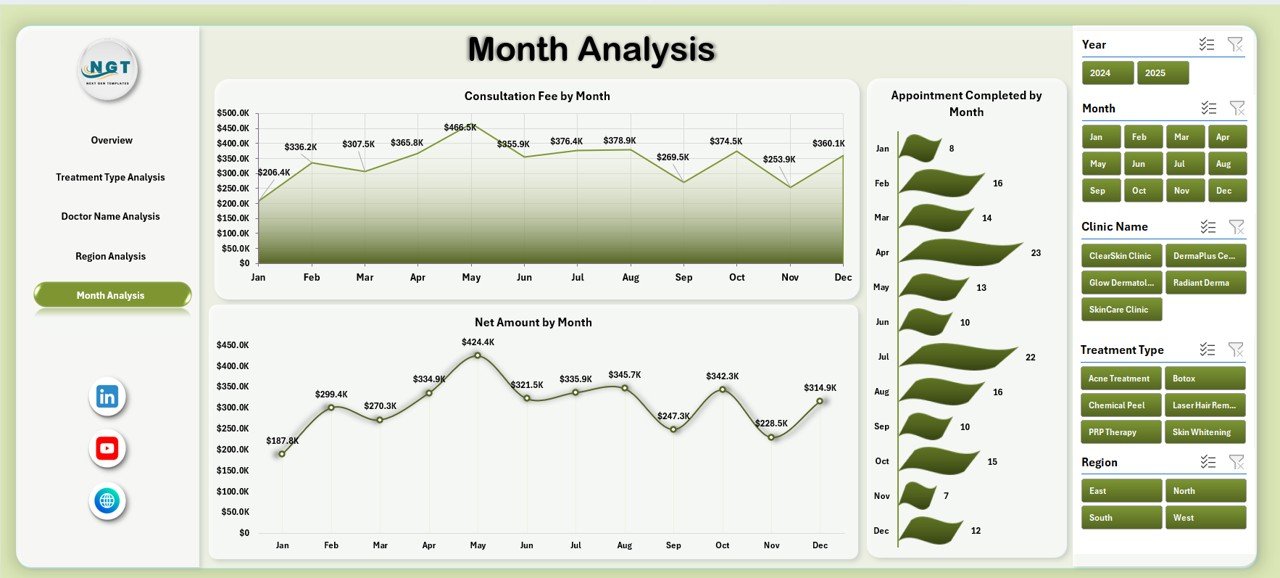
The Month Analysis page focuses on time-based performance tracking. Therefore, clinics can monitor seasonal patterns.
Charts in Month Analysis
• Consultation Fee by Month
Tracks monthly revenue movement.
• Appointment Completed by Month
Shows operational trends across the year.
• Net Amount by Month
Helps identify revenue seasonality.
Why monthly analysis matters:
-
Supports forecasting
-
Detects seasonal demand
-
Improves financial planning
-
Enables proactive decisions
🗂 Support Sheet — The Engine Behind the Dashboard
Click to Purchases Dermatology Clinics Dashboard in Excel
The Support Sheet powers all calculations and helper formulas. Although users rarely interact with it, this sheet plays a critical role.
Functions of Support Sheet:
-
Stores helper calculations
-
Supports pivot tables
-
Improves dashboard speed
-
Maintains data consistency
Because of this structured backend, the dashboard remains fast and reliable.
📁 Data Sheet — The Foundation of Analytics
The Data Sheet contains the raw transactional data for the dermatology clinics.
Typical Columns in Data Sheet
-
Appointment ID
-
Appointment Date
-
Clinic Name
-
City
-
Region
-
Doctor Name
-
Treatment Type
-
Consultation Fee
-
Discount %
-
Net Amount
-
Appointment Status
-
Wait Time
Since the dashboard uses pivot tables, the data remains flexible and scalable. Therefore, users can easily add new records without breaking the dashboard.
What Insights Can You Extract from This Dashboard?
This Excel dashboard delivers powerful business intelligence. For example, clinics can quickly answer:
-
Which clinic generates the most appointments?
-
Which treatments bring the highest revenue?
-
Which doctors give excessive discounts?
-
Which regions show strong growth?
-
When does patient demand peak?
-
Where do wait times exceed expectations?
Because the dashboard centralizes all metrics, decision-making becomes faster and more accurate.
Advantages of Dermatology Clinics Dashboard in Excel
Implementing this dashboard offers significant operational and financial benefits.
✅ Improved Decision Making
Since all KPIs appear in one place, managers make faster and smarter decisions.
✅ Better Doctor Performance Monitoring
The dashboard clearly shows doctor productivity. Therefore, performance reviews become objective and data-driven.
✅ Enhanced Revenue Visibility
Because the system tracks consultation fees and net amounts, clinics gain full financial transparency.
✅ Reduced Manual Reporting
Instead of preparing reports manually, users simply refresh the data. Consequently, teams save hours every week.
✅ Improved Patient Experience
By monitoring wait times and completion rates, clinics can optimize patient flow.
✅ Scalable and Flexible
Excel pivot tables allow easy expansion. Therefore, the dashboard grows with your clinic.
Best Practices for the Dermatology Clinics Dashboard in Excel
To get maximum value, you should follow proven best practices.
🔹 Keep Data Clean and Structured
Click to Purchases Dermatology Clinics Dashboard in Excel
Always maintain consistent formats for:
-
Dates
-
Names
-
Regions
-
Treatment types
Clean data ensures accurate pivot results.
🔹 Update Data Regularly
Refresh the dashboard frequently. As a result, decision-makers always see current performance.
Recommended frequency:
-
Daily for large clinics
-
Weekly for medium clinics
-
Monthly for small clinics
🔹 Standardize Doctor and Treatment Names
Avoid spelling variations. Otherwise, pivot tables may split the same category into multiple entries.
🔹 Monitor Discount Trends Closely
High discounts reduce profitability. Therefore, review the Discount % charts regularly.
🔹 Use Filters for Deeper Analysis
The dashboard slicers allow multi-dimensional analysis. Consequently, users can quickly drill down into specific clinics, doctors, or regions.
🔹 Protect the Formula Cells
Lock calculation areas to prevent accidental changes. This step keeps the dashboard stable.
Who Should Use This Dermatology Dashboard?
This Excel solution benefits multiple healthcare roles.
Ideal users include:
-
Dermatology clinic owners
-
Healthcare administrators
-
Operations managers
-
Medical directors
-
Financial analysts
-
Multi-clinic networks
Because the dashboard remains simple and visual, both technical and non-technical users can operate it easily.
How Does This Dashboard Improve Clinic Profitability?
Profitability improves when clinics gain visibility and control. This dashboard helps in several ways.
First, it highlights high-revenue treatments. Therefore, clinics can promote profitable services.
Second, it exposes excessive discounts. As a result, management can enforce pricing discipline.
Third, it balances doctor workloads. Consequently, clinics improve operational efficiency.
Finally, it reveals regional demand patterns. Because of this insight, expansion decisions become smarter.
Common Mistakes to Avoid
Even the best dashboard fails if users make avoidable mistakes.
❌ Ignoring Data Quality
Poor data leads to wrong insights.
❌ Overusing Discounts
Heavy discounting hurts margins.
❌ Not Refreshing Pivot Tables
Outdated data creates misleading reports.
❌ Inconsistent Naming
Different spellings break aggregation.
❌ Tracking Too Few KPIs
Limited metrics reduce visibility.
Avoid these mistakes to maximize dashboard value.
Future Enhancements You Can Add
If you want to upgrade the dashboard further, consider adding:
-
Patient retention analysis
-
Treatment success rate
-
Doctor utilization %
-
Appointment cancellation rate
-
Revenue forecast model
-
Power Query automation
-
Power BI integration
These enhancements can take your analytics to the next level.
Click to Purchases Dermatology Clinics Dashboard in Excel
Conclusion: Why Every Dermatology Clinic Needs This Excel Dashboard
Modern dermatology clinics cannot rely on manual reporting anymore. Instead, they need fast, accurate, and visual analytics.
The Dermatology Clinics Dashboard in Excel delivers exactly that. It centralizes appointments, revenue, doctor performance, treatment insights, and regional trends into one powerful interface.
Moreover, the dashboard remains easy to use, highly flexible, and completely scalable. Because of these advantages, clinics can improve efficiency, increase profitability, and enhance patient satisfaction.
If you want to transform your clinic operations with data-driven decisions, this Excel dashboard provides the perfect starting point.
Frequently Asked Questions (FAQs)
❓ What is a Dermatology Clinics Dashboard in Excel?
It is an interactive Excel reporting tool that tracks appointments, revenue, doctor performance, and treatment analytics in one centralized view.
❓ Who can use this dashboard?
Clinic owners, healthcare managers, administrators, and analysts can use this dashboard easily.
❓ Does this dashboard require advanced Excel skills?
No. The dashboard comes ready to use. Users only need basic Excel knowledge to refresh data and use filters.
❓ Can I add more data to the dashboard?
Yes. Since the system uses pivot tables, you can safely add new records to the Data Sheet.
❓ How often should I update the data?
You should update it daily or weekly depending on clinic size. Frequent updates ensure accurate insights.
❓ Can this dashboard handle multiple clinics?
Yes. The structure supports multi-clinic environments and regional analysis.
❓ Is this dashboard suitable for small clinics?
Absolutely. Both single clinics and large dermatology networks can benefit from it.
Visit our YouTube channel to learn step-by-step video tutorials