In today’s fast-moving healthcare environment, dermatology clinics must rely on data to stay competitive. However, many clinics still depend on scattered spreadsheets and manual reports. As a result, decision-makers struggle to track appointments, revenue, doctor performance, and treatment trends.
Therefore, clinics need a centralized and intelligent reporting system. More importantly, they need real-time visibility into operational and financial performance.
That is exactly where the Dermatology Clinics Dashboard in Power BI becomes a game-changing solution.
Click to Purchases Dermatology Clinics Dashboard in Power BI
This ready-to-use and fully interactive dashboard helps clinic owners, healthcare managers, and analysts monitor key performance indicators in one powerful interface. Moreover, it transforms raw clinic data into meaningful insights that support faster and smarter decisions.
In this comprehensive guide, you will learn everything about the Dermatology Clinics Dashboard in Power BI, including its structure, features, advantages, best practices, and frequently asked questions.
What Is a Dermatology Clinics Dashboard in Power BI?
A Dermatology Clinics Dashboard in Power BI is an interactive business intelligence solution designed to track and analyze the performance of dermatology clinics using key metrics.
Instead of reviewing multiple disconnected reports, you can monitor all important KPIs in one centralized dashboard. Consequently, your team saves time and improves decision-making accuracy.
This dashboard typically tracks:
-
Appointment performance
-
Treatment revenue
-
Doctor productivity
-
Regional performance
-
Monthly trends
-
Discount impact
Because the dashboard updates dynamically, users can quickly identify opportunities and issues.
Why Do Dermatology Clinics Need a Power BI Dashboard?
Dermatology clinics generate large volumes of operational data every day. However, without proper analysis, this data loses value. Therefore, clinics must adopt a structured analytics approach.
Common Challenges Clinics Face
Many dermatology centers experience:
-
Fragmented reporting systems
-
Manual data consolidation
-
Limited visibility into doctor performance
-
Difficulty tracking treatment profitability
-
Slow decision-making processes
As a result, clinic growth slows down.
How the Dashboard Solves These Problems
Click to Purchases Dermatology Clinics Dashboard in Power BI
The Power BI dashboard helps because it:
-
Centralizes clinic data
-
Automates KPI tracking
-
Provides real-time insights
-
Improves operational visibility
-
Supports data-driven decisions
Therefore, clinics can operate more efficiently and profitably.
Key Features of the Dermatology Clinics Dashboard in Power BI
This dashboard contains five powerful and interactive pages inside the Power BI Desktop file. Each page focuses on a specific analytical area.
Let us explore each page in detail.
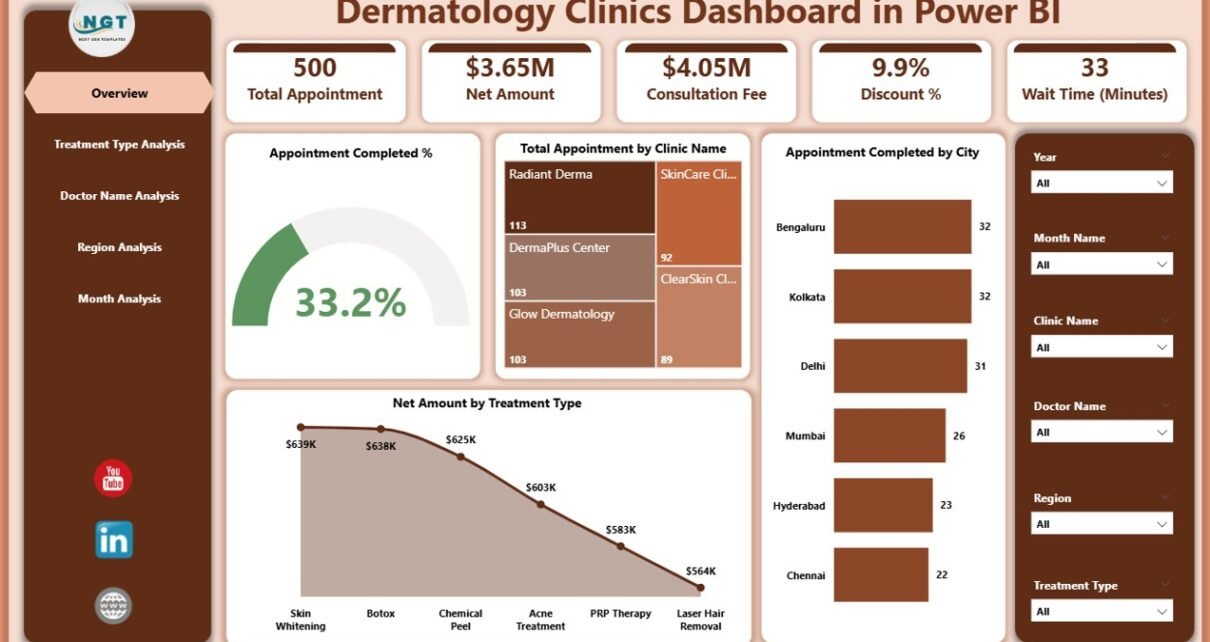
1. Overview Page — What Does the Main Dashboard Show?
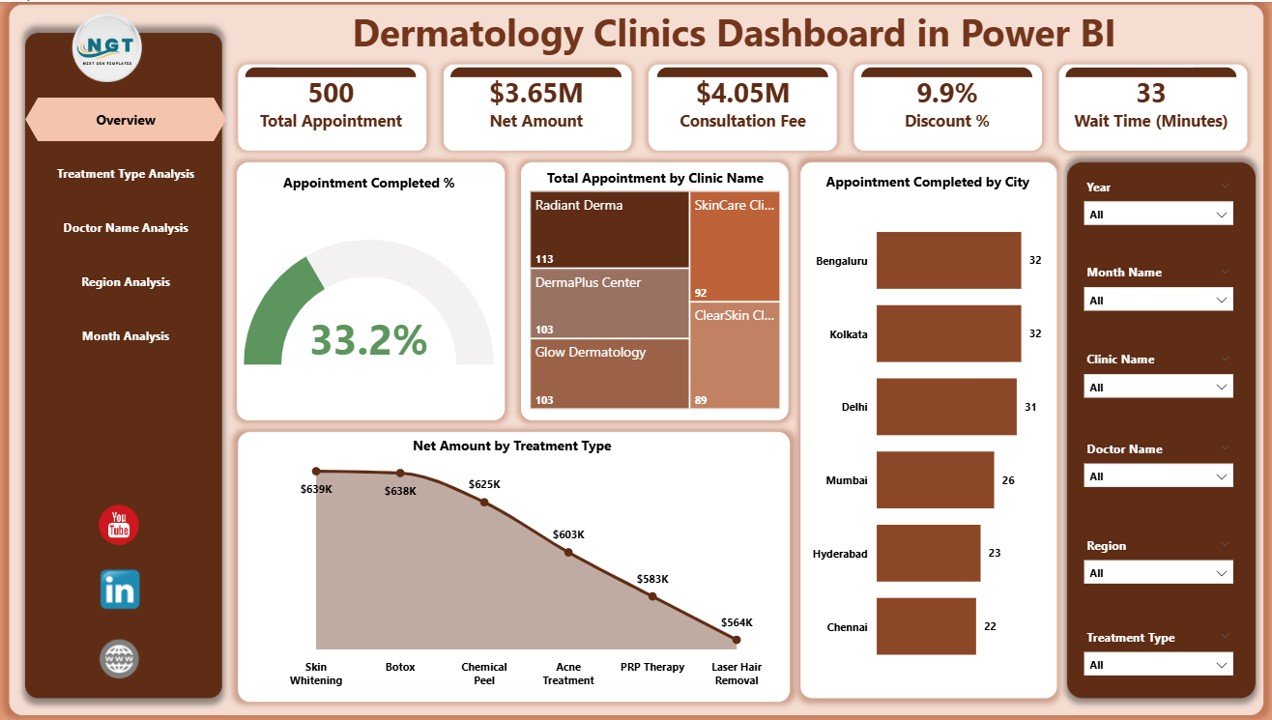
The Overview Page serves as the command center of the dashboard. Here, users get an instant snapshot of clinic performance.
Key Highlights
The page includes interactive slicers that allow users to filter data by key dimensions. As a result, the entire dashboard updates dynamically.
KPI Cards Available
-
Appointment Completed %
-
Total Appointment by City Name
-
Appointment Completed by City
-
Net Amount by Treatment Type
-
Overall performance indicators
Because these KPI cards sit at the top, decision-makers can quickly assess clinic health.
Why the Overview Page Matters
This page helps users:
-
Monitor clinic performance instantly
-
Identify high-performing cities
-
Track treatment revenue distribution
-
Evaluate appointment efficiency
-
Click to Purchases Dermatology Clinics Dashboard in Power BI
Therefore, managers can take quick action without digging into raw data.
2. Treatment Type Analysis — How Can Clinics Track Treatment Performance?
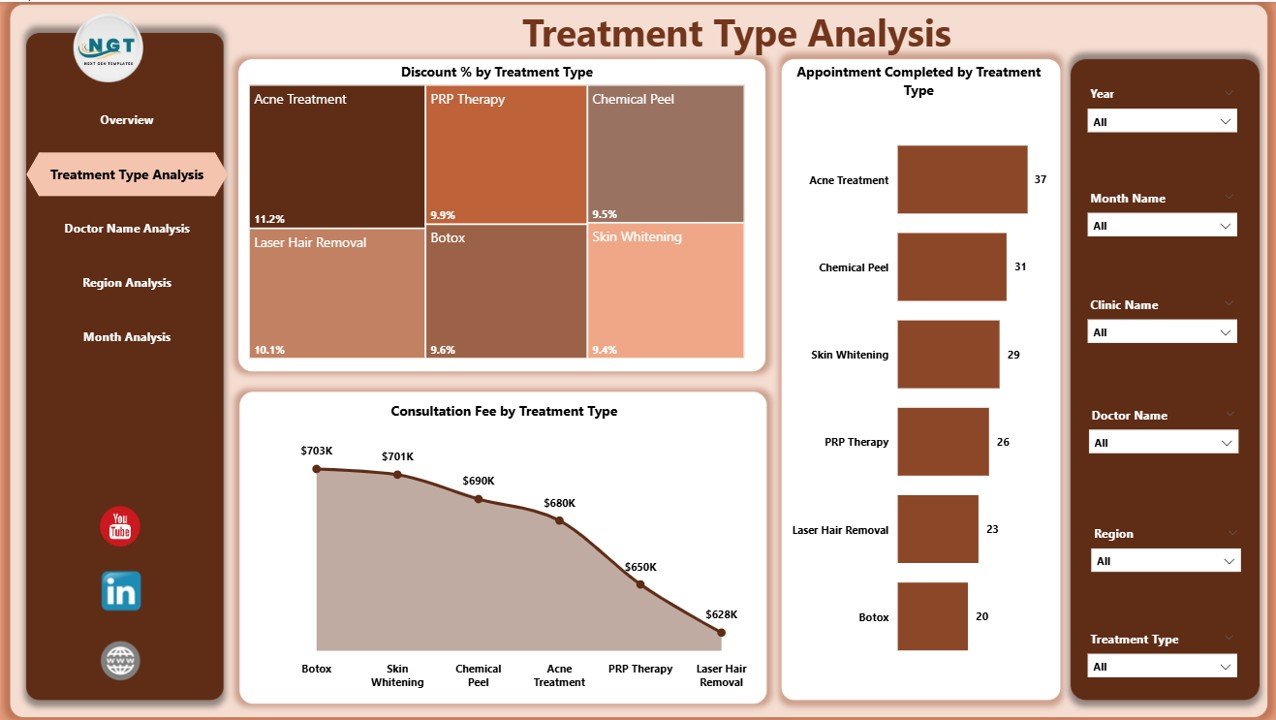
The Treatment Type Analysis page focuses on service-level insights. This section helps clinics understand which treatments drive revenue and efficiency.
Available Interactive Slicers
Users can filter data dynamically. Consequently, they can analyze specific treatments or time periods.
Key Charts on This Page
📊 Appointment Completed by Treatment Type
This visual shows how many appointments each treatment completes. Therefore, clinics can identify popular procedures.
Insights you can extract:
-
Most demanded treatments
-
Low-performing services
-
Capacity planning needs
-
Treatment utilization trends
📉 Discount % by Treatment Type
This chart highlights the discount patterns across treatments.
Why this matters:
-
Excessive discounts reduce profit
-
Strategic discounts increase volume
-
Clinics can balance pricing strategy
💰 Consultation Fee by Treatment Type
This visual compares consultation fees across services.
Key benefits:
-
Identify premium treatments
-
Evaluate pricing consistency
-
Optimize revenue strategy
Business Value of Treatment Analysis
Because treatment data drives revenue, this page helps clinics:
-
Optimize service mix
-
Improve pricing strategy
-
Increase treatment profitability
-
Reduce unnecessary discounts
3. Doctor Name Analysis — How Can You Measure Doctor Performance?
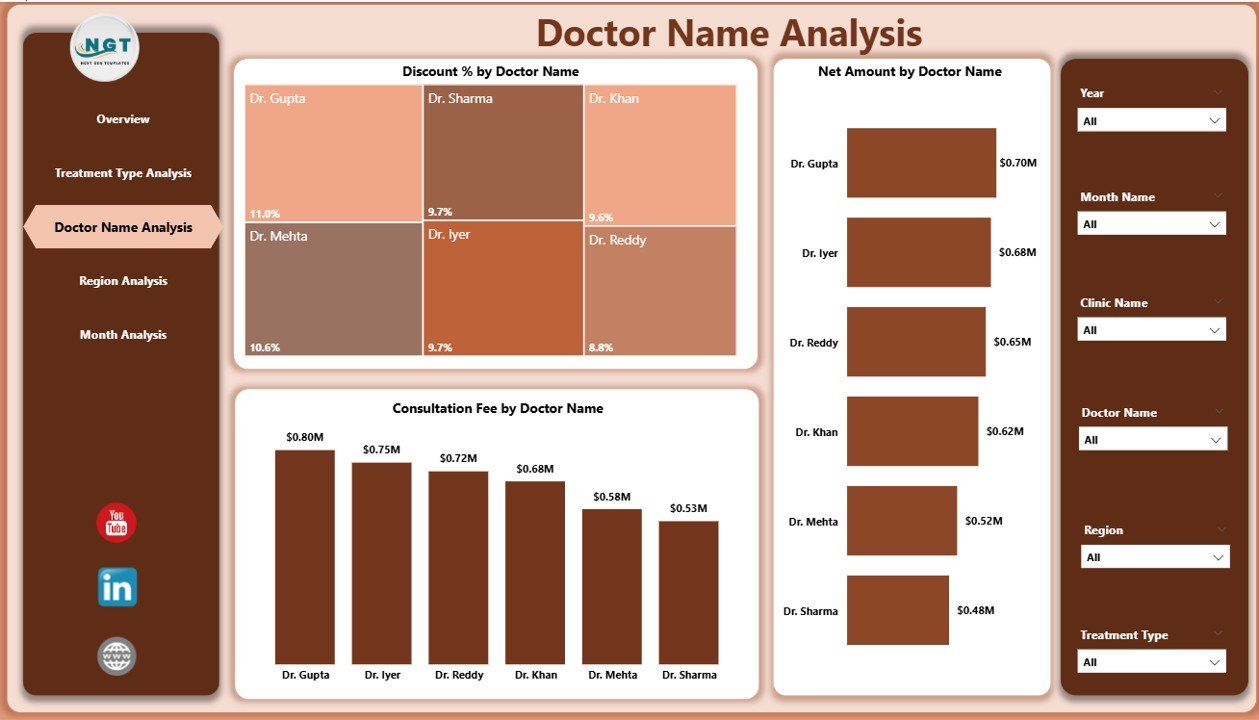
Doctor productivity directly affects clinic success. Therefore, the Doctor Name Analysis page provides deep insights into individual doctor performance.
Interactive Filtering
Users can slice data by doctor, region, or time. As a result, performance comparisons become very easy.
Key Charts Included
👨⚕️ Net Amount by Doctor Name
This chart shows revenue generated by each doctor.
Click to Purchases Dermatology Clinics Dashboard in Power BI
What clinics learn:
-
Top revenue-generating doctors
-
Underperforming practitioners
-
Revenue contribution distribution
-
Staffing optimization opportunities
📉 Discount % by Doctor Name
This visual reveals which doctors offer higher discounts.
Why this is important:
-
High discounts may reduce margins
-
Standardization improves profitability
-
Training needs become visible
💵 Consultation Fee by Doctor Name
This chart compares consultation charges across doctors.
Key insights:
-
Pricing inconsistencies
-
Premium vs standard doctors
-
Revenue optimization opportunities
Strategic Benefits of Doctor Analysis
Because doctor performance drives clinic growth, this page helps management:
-
Improve doctor productivity
-
Standardize pricing
-
Control discount leakage
-
Optimize doctor scheduling
4. Region Analysis — How Does Performance Vary by Location?
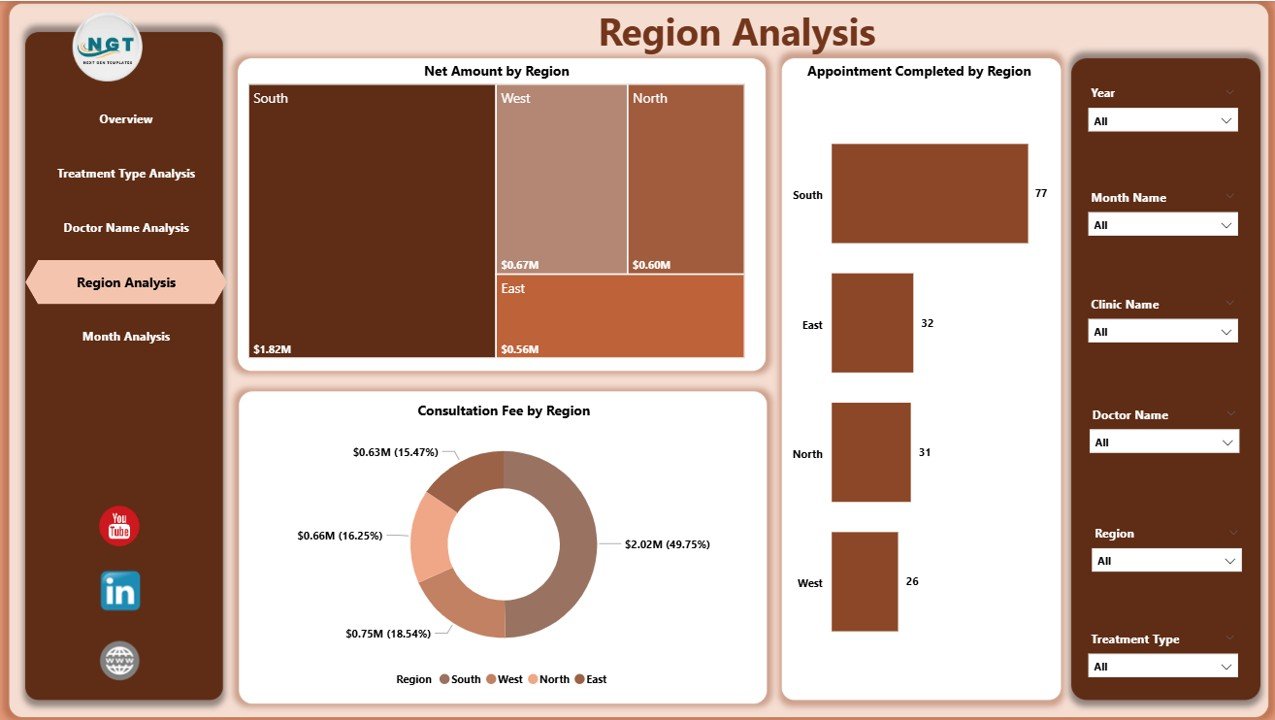
Multi-location clinics must monitor regional performance carefully. Therefore, the Region Analysis page provides geographic insights.
Slicer Functionality
Users can filter by region, month, or treatment. Consequently, location-based analysis becomes simple.
Key Visuals on This Page
🌍 Net Amount by Region
This chart highlights revenue contribution by region.
Business insights:
-
High-revenue regions
-
Underperforming locations
-
Expansion opportunities
-
Resource allocation needs
📊 Appointment Completed by Region
This visual tracks appointment volume geographically.
Why it matters:
-
Understand patient demand
-
Optimize staffing
-
Improve capacity planning
💰 Consultation Fee by Region
This chart compares pricing across regions.
Key advantages:
-
Detect pricing gaps
-
Maintain regional consistency
-
Improve profitability
Why Region Analysis Is Critical
Click to Purchases Dermatology Clinics Dashboard in Power BI
Because location performance varies widely, this page enables clinics to:
-
Improve regional strategy
-
Allocate resources wisely
-
Identify growth markets
-
Reduce regional inefficiencies
5. Month Analysis — How Can Clinics Track Monthly Trends?
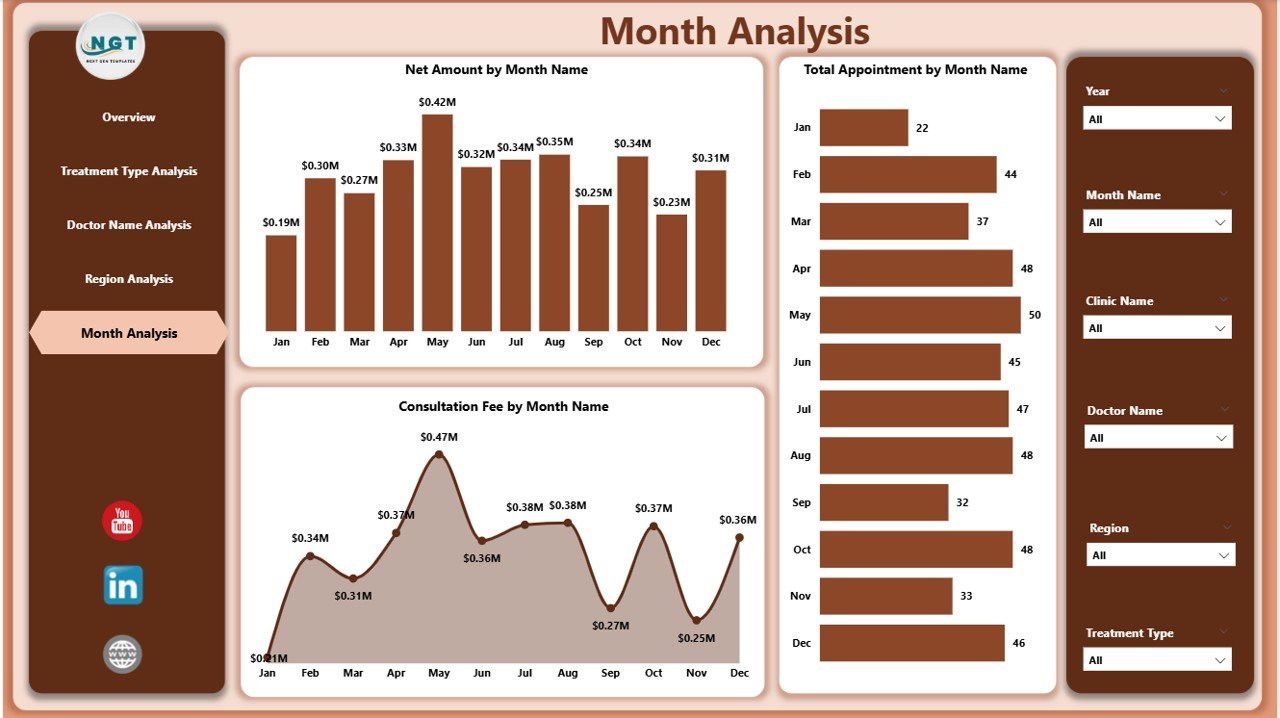
The Month Analysis page focuses on time-based performance tracking. This section helps clinics understand seasonal patterns and growth trends.
Key Charts Available
📅 Net Amount by Month
This visual tracks monthly revenue.
Insights generated:
-
Revenue trends
-
Seasonal spikes
-
Growth patterns
-
Forecasting inputs
📊 Total Appointment by Month
This chart shows patient volume over time.
Business value:
-
Demand forecasting
-
Capacity planning
-
Marketing effectiveness
💵 Consultation Fee by Month
This visual monitors pricing trends monthly.
Key benefits:
-
Detect pricing shifts
-
Maintain revenue stability
-
Monitor fee adjustments
Why Monthly Analysis Matters
Because healthcare demand fluctuates, this page helps clinics:
-
Plan marketing campaigns
-
Forecast revenue
-
Optimize staffing
-
Prepare for peak seasons
Advantages of Dermatology Clinics Dashboard in Power BI
Implementing this dashboard delivers significant business value. Let us explore the major advantages.
🚀 Real-Time Performance Visibility
-
Instantly monitor clinic KPIs
-
Track appointments dynamically
-
Identify issues quickly
-
Improve response time
📊 Centralized Data Management
Click to Purchases Dermatology Clinics Dashboard in Power BI
-
Combine multiple data sources
-
Eliminate manual reporting
-
Reduce data errors
-
Improve reporting consistency
🎯 Better Decision-Making
-
Use data instead of guesswork
-
Identify growth opportunities
-
Optimize pricing strategies
-
Improve operational planning
💰 Revenue Optimization
-
Track treatment profitability
-
Monitor doctor performance
-
Control discount leakage
-
Improve financial outcomes
⚡ Interactive and User-Friendly
-
Easy slicer-based filtering
-
Dynamic visuals
-
Professional layout
-
Minimal training required
Best Practices for the Dermatology Clinics Dashboard in Power BI
To get maximum value from your dashboard, follow these proven best practices.
✅ Maintain Clean Source Data
Always ensure:
-
No duplicate records
-
Correct date formats
-
Standardized treatment names
-
Accurate doctor mapping
Clean data produces reliable insights.
✅ Update Data Regularly
You should refresh data frequently because:
-
Healthcare metrics change daily
-
Real-time insights improve decisions
-
Outdated data creates risk
Therefore, schedule automated refresh whenever possible.
✅ Use Consistent KPI Definitions
Define each KPI clearly. For example:
-
What counts as completed appointment
-
How net amount calculates
-
How discounts apply
Consistency prevents confusion.
✅ Monitor High-Impact KPIs First
Focus on:
-
Appointment completion %
-
Net revenue
-
Doctor productivity
-
Regional performance
These metrics drive the most value.
✅ Train Your Team
Even the best dashboard fails without adoption. Therefore:
-
Train clinic managers
-
Share usage guidelines
-
Encourage data-driven culture
-
Review dashboard weekly
Who Should Use This Dashboard?
This solution benefits multiple stakeholders.
Ideal Users
-
Dermatology clinic owners
-
Healthcare administrators
-
Clinic operations managers
-
Financial analysts
-
Medical practice consultants
Because the dashboard remains flexible, organizations of all sizes can use it.
How to Implement the Dermatology Clinics Dashboard in Power BI
Follow these simple steps for successful deployment.
Step 1: Prepare Your Data
Ensure your dataset includes:
-
Appointment details
-
Treatment information
-
Doctor names
-
Region and city
-
Consultation fees
-
Discounts
-
Net amounts
Step 2: Import Data into Power BI
Next, load your dataset into Power BI Desktop. After that, clean and transform the data using Power Query.
Step 3: Build Relationships
Create proper relationships between tables. This step ensures accurate filtering and aggregation.
Step 4: Configure Visuals
Then set up:
-
KPI cards
-
Bar charts
-
Trend charts
-
Slicers
Step 5: Publish and Share
Finally, publish the dashboard to Power BI Service and share it with stakeholders.
Conclusion
The healthcare industry continues to become more data-driven every year. Therefore, dermatology clinics must adopt intelligent analytics tools to remain competitive.
The Dermatology Clinics Dashboard in Power BI provides exactly what modern clinics need — real-time visibility, centralized reporting, and actionable insights.
Because the dashboard combines appointment tracking, doctor performance, treatment analysis, regional insights, and monthly trends, it empowers decision-makers to act with confidence.
If your clinic still relies on manual reports, now is the perfect time to upgrade. With the right dashboard in place, you can improve efficiency, increase revenue, and deliver better patient experiences.
Frequently Asked Questions (FAQs)
❓ What data do I need for the Dermatology Clinics Dashboard?
You need appointment data, treatment details, doctor information, consultation fees, discounts, region, and dates.
❓ Can small dermatology clinics use this dashboard?
Yes. Small clinics can benefit greatly because the dashboard scales easily and requires minimal infrastructure.
❓ How often should I refresh the dashboard?
You should refresh the dashboard daily or weekly. However, high-volume clinics may prefer real-time refresh.
❓ Does this dashboard require advanced Power BI skills?
No. Basic Power BI knowledge works fine. Moreover, the ready-to-use template simplifies implementation.
❓ Can I customize the KPIs?
Absolutely. You can add, remove, or modify KPIs based on your clinic’s requirements.
❓ Is this dashboard suitable for multi-location clinics?
Yes. In fact, the Region Analysis page makes it ideal for multi-branch dermatology centers.
Visit our YouTube channel to learn step-by-step video tutorials