Healthcare organizations generate massive amounts of diagnostic data every day. Radiology and imaging centers handle thousands of scans, patient records, technician activities, and financial transactions monthly. However, many hospitals and imaging facilities still rely on scattered spreadsheets and manual reports. As a result, managers struggle to track performance, revenue, operational efficiency, and departmental productivity in one place.
So, how can radiology centers monitor performance clearly while making faster decisions?
Click to Purchases Radiology and Imaging Dashboard in Power BI
The answer is simple — Radiology and Imaging Dashboard in Power BI.
This article explains everything you need to know about building and using a Radiology and Imaging Dashboard in Power BI. Moreover, you will learn how this dashboard improves operational visibility, enhances financial tracking, and helps healthcare leaders make data-driven decisions.
What Is a Radiology and Imaging Dashboard in Power BI?
A Radiology and Imaging Dashboard in Power BI is an interactive healthcare analytics solution designed to monitor diagnostic imaging operations, financial performance, technician productivity, and referral trends using visual reports.
Instead of reviewing multiple files, healthcare managers can analyze all critical metrics from a centralized dashboard.
Because Power BI connects directly with Excel or hospital databases, it converts raw radiology data into meaningful visuals such as charts, KPI cards, and trend analysis.
As a result, decision-makers quickly understand performance gaps and take corrective actions.
Why Do Radiology and Imaging Centers Need a Dashboard?
Radiology departments operate in a fast-paced environment. Every day, technicians perform scans, doctors send referrals, and billing teams process revenue records. Without structured analytics, tracking performance becomes difficult.
Common Challenges Without a Dashboard
-
Data scattered across multiple systems
-
Difficulty tracking scan completion rates
-
Limited visibility into technician productivity
-
Poor financial monitoring
-
Delayed decision-making
-
Manual reporting errors
Therefore, organizations need a centralized system that brings operational and financial data together.
A Power BI dashboard solves these problems efficiently.
Key Features of Radiology and Imaging Dashboard in Power BI
This ready-to-use dashboard contains five powerful analytical pages inside the Power BI Desktop application. Each page focuses on a specific business perspective.
Let us explore each page in detail.
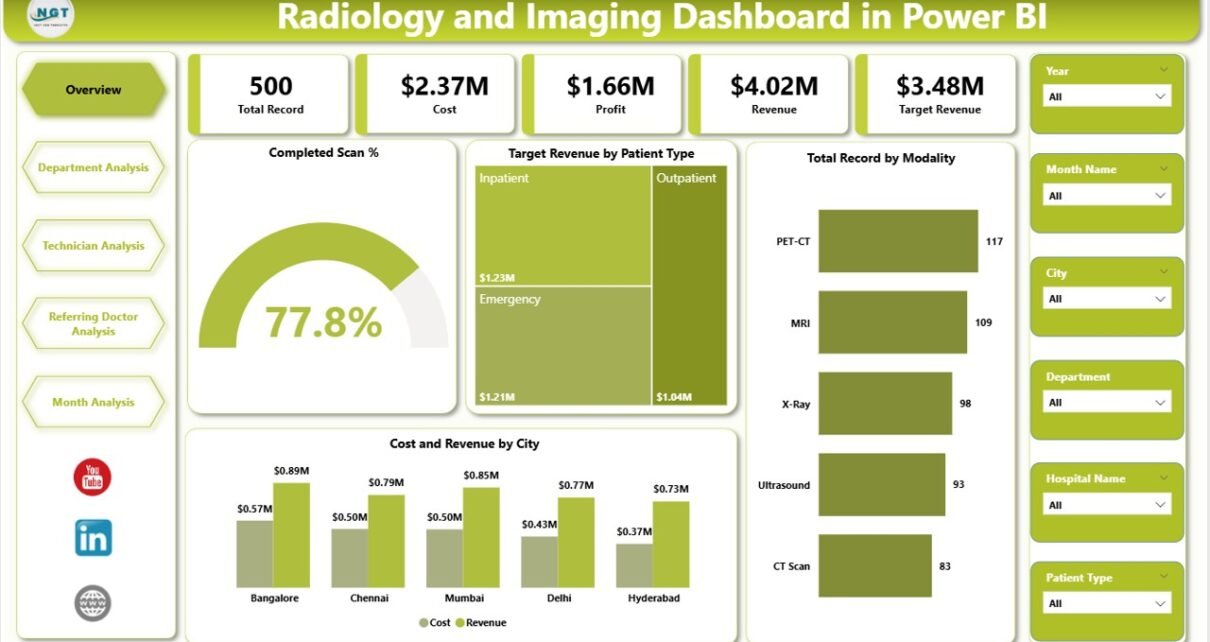
1. Overview Page – How Does It Provide a Complete Snapshot?
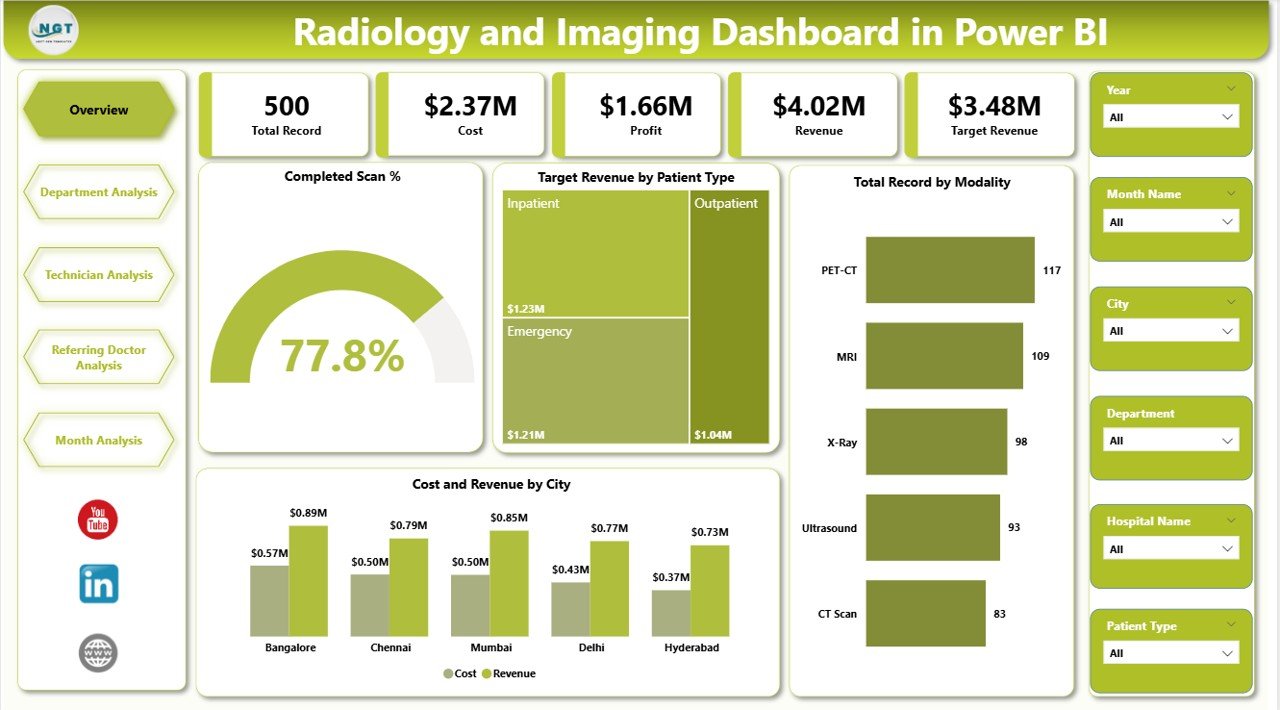
The Overview Page acts as the main control center of the dashboard. It presents a high-level summary of radiology performance.
Key Elements Available
-
Interactive slicers for filtering data
-
KPI cards for instant insights
-
Performance visualization charts
KPI Cards Included
-
Completed Scan % – Shows operational efficiency
-
Target Revenue by Patient Type – Tracks financial goals
-
Total Records by Modality – Displays scan distribution
-
Cost by City – Monitors operational expenses
-
Revenue by City – Highlights geographic performance
Because leaders often need quick updates, this page helps them understand overall performance within seconds.
Moreover, managers can filter by time period or category to analyze specific trends instantly.
2. Department Analysis – How Can Departments Improve Performance?
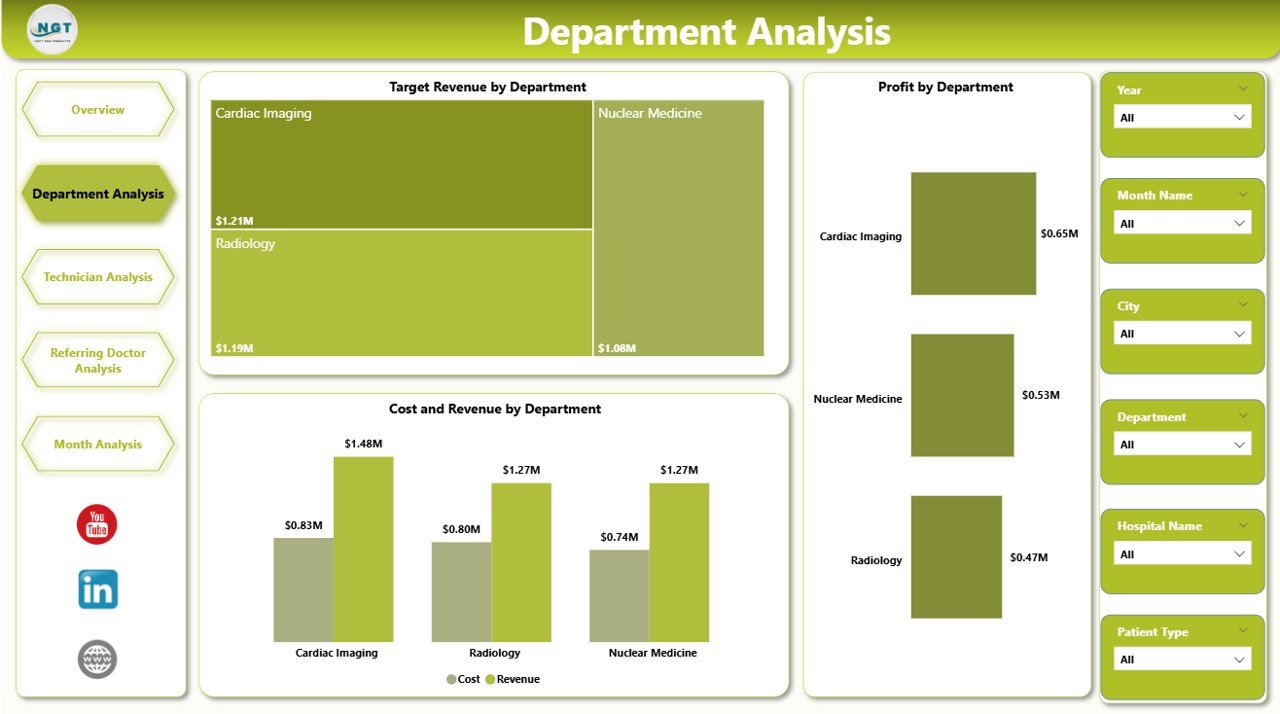
The Department Analysis Page focuses on comparing radiology departments such as MRI, CT Scan, X-Ray, Ultrasound, and Mammography.
Charts Included
-
Target Revenue by Department
-
Profit by Department
-
Cost and Revenue by Department
Insights You Can Gain
-
Identify high-performing departments
-
Detect departments with high costs
-
Compare profitability across services
-
Optimize resource allocation
For example, if MRI generates high revenue but also high cost, management can evaluate pricing strategies or operational efficiency.
Consequently, departments operate more strategically.
Click to Purchases Radiology and Imaging Dashboard in Power BI
3. Technician Analysis – How Do You Measure Staff Productivity?
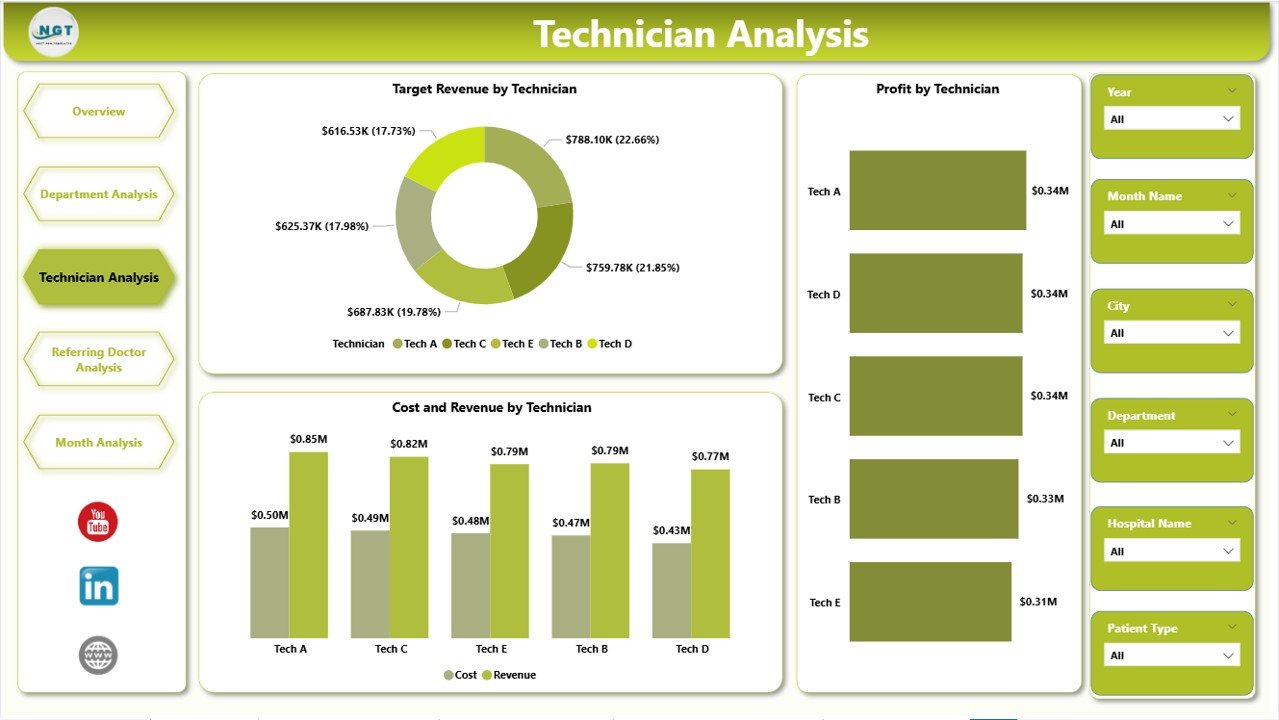
Technicians play a critical role in imaging operations. Therefore, measuring their performance becomes essential.
The Technician Analysis Page evaluates technician efficiency and financial contribution.
Charts Included
-
Target Revenue by Technician
-
Profit by Technician
-
Cost and Revenue by Technician
Benefits of Technician Analysis
-
Monitor technician productivity
-
Identify training requirements
-
Balance workload distribution
-
Improve scheduling decisions
Because data becomes transparent, organizations reward top performers and support underperforming staff.
As a result, overall operational efficiency increases.
4. Referring Doctor Analysis – Why Track Referral Performance?
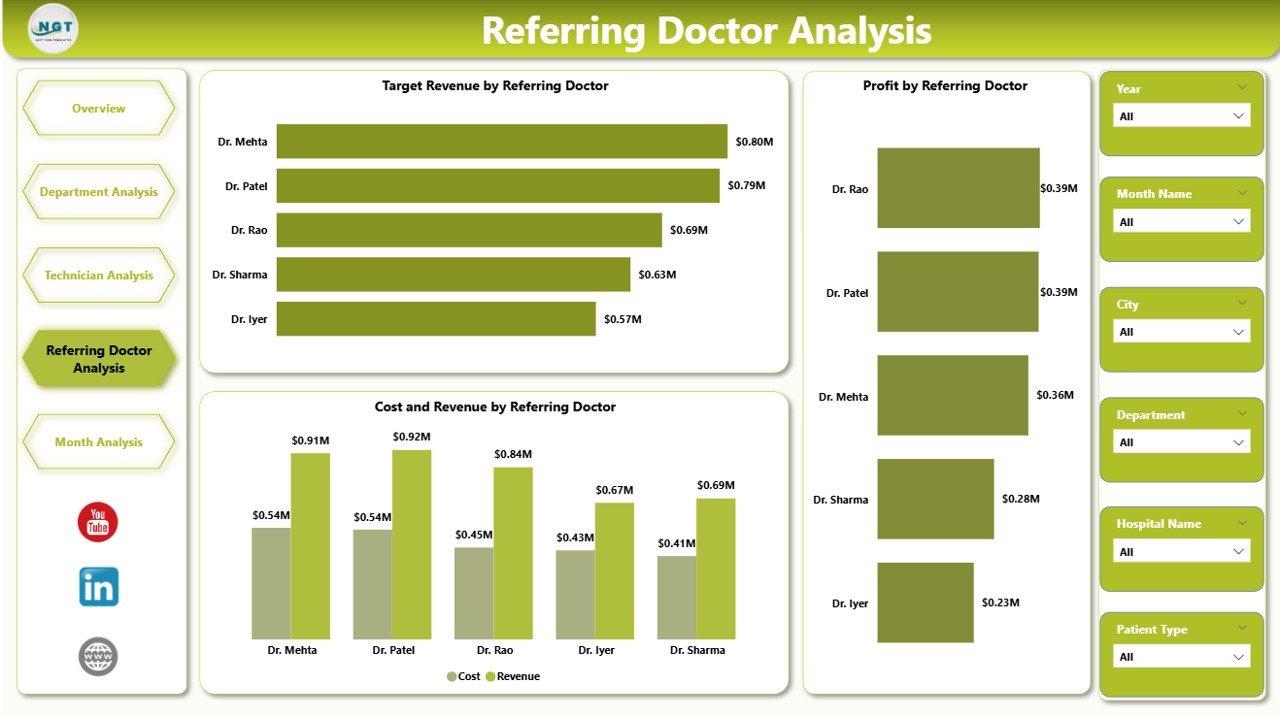
Referring doctors significantly influence patient volume. Understanding referral patterns helps imaging centers strengthen partnerships.
The Referring Doctor Analysis Page provides detailed referral insights.
Charts Available
-
Target Revenue by Referring Doctor
-
Profit by Referring Doctor
-
Cost and Revenue by Referring Doctor
Key Insights
-
Identify top referral sources
-
Analyze profitability of referrals
-
Build stronger doctor relationships
-
Improve marketing strategies
Additionally, hospitals can design loyalty programs for high-value referring doctors.
Therefore, patient inflow increases consistently.
5. Month Analysis – How Does Trend Analysis Improve Planning?
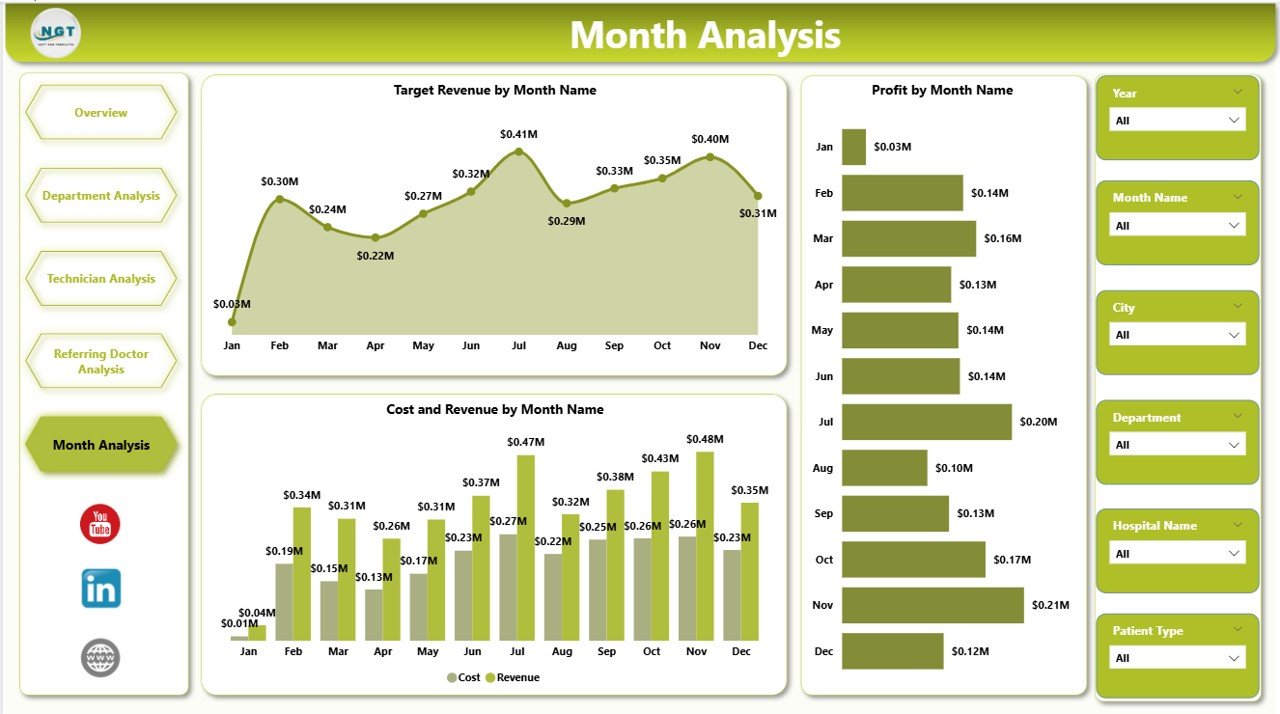
Healthcare performance changes every month. Hence, trend monitoring becomes essential.
The Month Analysis Page tracks time-based performance metrics.
Charts Included
-
Net Amount vs Target Revenue by Month
-
Profit by Month
-
Cost and Revenue by Month
Why Monthly Analysis Matters
-
Detect seasonal demand patterns
-
Monitor revenue growth trends
-
Forecast future performance
-
Plan staffing and equipment usage
Because managers view historical performance visually, they make more accurate forecasts.
Important KPIs Included in Radiology Dashboard
A strong dashboard depends on meaningful KPIs.
Operational KPIs
-
Completed Scan Percentage
-
Total Scan Records
-
Modality Utilization Rate
-
Patient Volume
Financial KPIs
-
Target Revenue
-
Actual Revenue
-
Operational Cost
-
Net Profit
Performance KPIs
-
Technician Productivity
-
Department Profitability
-
Referral Contribution
These KPIs provide a complete performance ecosystem.
How Does Power BI Transform Radiology Data into Insights?
Click to Purchases Radiology and Imaging Dashboard in Power BI
Power BI uses data modeling and visualization features to simplify complex datasets.
Key Capabilities
-
Interactive slicers for dynamic filtering
-
Drill-down analysis
-
Real-time calculations
-
Automated refresh
-
Visual storytelling
Because Power BI updates visuals automatically, reporting becomes faster and more reliable.
Advantages of Radiology and Imaging Dashboard in Power BI
Implementing this dashboard offers multiple benefits.
✅ Better Decision Making
Managers analyze performance instantly instead of waiting for reports.
✅ Centralized Data Management
All operational and financial metrics appear in one platform.
✅ Improved Operational Efficiency
Teams identify delays and performance gaps quickly.
✅ Enhanced Financial Visibility
Revenue, cost, and profit tracking become easier.
✅ Increased Staff Accountability
Technician and department performance stays transparent.
✅ Stronger Referral Management
Hospitals build data-driven relationships with doctors.
✅ Time Savings
Automated reporting eliminates manual work.
How Does This Dashboard Improve Healthcare Operations?
A well-designed analytics dashboard changes how radiology departments operate.
Operational Improvements
-
Faster patient processing
-
Better equipment utilization
-
Reduced reporting workload
-
Accurate performance monitoring
Financial Improvements
-
Revenue optimization
-
Cost control
-
Profitability tracking
Strategic Improvements
-
Data-backed decision making
-
Long-term planning support
-
Performance benchmarking
Best Practices for the Radiology and Imaging Dashboard in Power BI
Click to Purchases Radiology and Imaging Dashboard in Power BI
To achieve maximum results, organizations should follow proven implementation practices.
1. Define Clear KPIs First
Always identify measurable goals before building visuals.
2. Maintain Clean Data Structure
Use standardized columns and formats.
3. Use Interactive Filters
Allow users to analyze data dynamically.
4. Focus on Visual Clarity
Avoid overcrowded charts.
5. Automate Data Refresh
Schedule updates regularly.
6. Train End Users
Ensure staff understands dashboard usage.
7. Monitor Performance Regularly
Review insights weekly or monthly.
Following these practices ensures long-term dashboard success.
Who Can Benefit from This Dashboard?
Many healthcare professionals gain value from this solution.
-
Radiology Center Owners
-
Hospital Administrators
-
Financial Managers
-
Department Heads
-
Operations Managers
-
Healthcare Analysts
Because each role requires different insights, multi-page dashboards provide tailored analytics.
How to Implement a Radiology Dashboard Step by Step?
Step 1: Collect Data
Gather scan records, technician details, referral data, and financial information.
Step 2: Prepare Data in Excel
Structure tables properly for Power BI import.
Step 3: Load Data into Power BI
Use Power Query for cleaning and transformation.
Step 4: Create Relationships
Connect tables logically.
Step 5: Build Measures Using DAX
Calculate revenue, profit, and percentages.
Step 6: Design Dashboard Pages
Create overview and analysis pages.
Step 7: Publish and Share
Deploy dashboard securely across teams.
Common Mistakes to Avoid While Building Healthcare Dashboards
Click to Purchases Radiology and Imaging Dashboard in Power BI
Even powerful tools fail when design mistakes occur.
-
Using too many visuals
-
Ignoring KPI relevance
-
Poor data quality
-
Lack of user training
-
Overcomplicated calculations
Therefore, simplicity and clarity should always guide dashboard design.
Future of Radiology Analytics with Power BI
Healthcare analytics continues to evolve rapidly.
Soon, dashboards will integrate with:
-
AI-based diagnosis trends
-
Predictive patient volume forecasting
-
Automated anomaly detection
-
Real-time hospital systems
Consequently, radiology centers will shift from reactive reporting to predictive decision-making.
Conclusion
The Radiology and Imaging Dashboard in Power BI transforms how healthcare organizations monitor performance. Instead of managing scattered reports, decision-makers gain a unified and interactive analytics platform.
Because the dashboard combines operational, financial, technician, and referral insights, healthcare leaders understand their business completely.
Moreover, the five analytical pages — Overview, Department Analysis, Technician Analysis, Referring Doctor Analysis, and Month Analysis — provide a 360-degree view of radiology operations.
As healthcare competition grows, data-driven decision-making becomes essential. Therefore, implementing a Power BI dashboard helps radiology centers improve efficiency, increase profitability, and deliver better patient services.
Frequently Asked Questions (FAQs)
1. What is a Radiology and Imaging Dashboard in Power BI?
It is an interactive reporting tool that tracks radiology performance, revenue, technician productivity, and referral analytics using visual reports.
2. Why should hospitals use Power BI for radiology analytics?
Power BI provides real-time insights, automated reporting, and interactive analysis, which improves decision-making.
3. What data is required for this dashboard?
You need scan records, department details, technician information, referral data, and financial metrics.
4. Can small diagnostic centers use this dashboard?
Yes. Even small imaging centers benefit from centralized analytics and performance monitoring.
5. Does the dashboard support monthly trend analysis?
Yes. The Month Analysis page tracks revenue, cost, and profit trends over time.
6. Is Power BI suitable for healthcare reporting?
Yes. Power BI offers secure data handling, advanced visualization, and scalable analytics suitable for healthcare environments.
7. How often should the dashboard be updated?
Organizations should update data daily or weekly depending on operational needs.
Visit our YouTube channel to learn step-by-step video tutorials