In today’s data-driven world, think tanks play a critical role in shaping policies, influencing governments, and guiding public decisions. However, managing research funding, tracking publications, monitoring regional activities, and evaluating policy impact often becomes complex when organizations rely on scattered spreadsheets and manual reporting.
Therefore, organizations need a smarter and more structured solution. A Think Tanks Dashboard in Power BI provides a centralized analytics platform that transforms raw research data into meaningful insights. Instead of reviewing multiple reports, decision-makers can instantly evaluate performance through interactive visuals and real-time analytics.
Click to Purchases Think Tanks Dashboard in Power BI
In this comprehensive guide, you will learn everything about the Think Tanks Dashboard in Power BI, including its features, structure, benefits, analysis capabilities, best practices, and frequently asked questions.
What Is a Think Tanks Dashboard in Power BI?
A Think Tanks Dashboard in Power BI is an interactive business intelligence solution designed to help research organizations monitor operational performance, funding utilization, publication output, and policy impact using visual analytics.
Instead of compiling reports manually, teams connect their data sources to Power BI and instantly generate dashboards that display key performance indicators (KPIs) through charts, filters, and dynamic visuals.
Because Power BI updates visuals automatically, organizations gain faster insights and improve strategic decision-making.
Why Do Think Tanks Need a Dashboard?
Think tanks manage multiple activities simultaneously:
-
Research programs
-
Funding sources
-
Publications and reports
-
Policy impact measurement
-
Regional operations
-
Event management
However, traditional reporting methods create delays. As a result, leadership struggles to identify trends quickly.
A Power BI dashboard solves these problems by:
-
Centralizing data into one platform
-
Automating analysis
-
Providing real-time visibility
-
Supporting evidence-based decisions
How Does Power BI Improve Think Tank Analytics?
Power BI converts complex datasets into visual stories. Moreover, it allows users to interact with data using slicers, filters, and drill-down capabilities.
Key Capabilities Include:
-
Interactive dashboards
-
Automated data refresh
-
Cross-filtering visuals
-
Multi-dimensional analysis
-
Secure data sharing
-
Cloud accessibility
Consequently, research managers spend less time preparing reports and more time generating insights.
Key Features of the Think Tanks Dashboard in Power BI
Click to Purchases Think Tanks Dashboard in Power BI
The dashboard contains five analytical pages, each designed to answer specific operational questions.
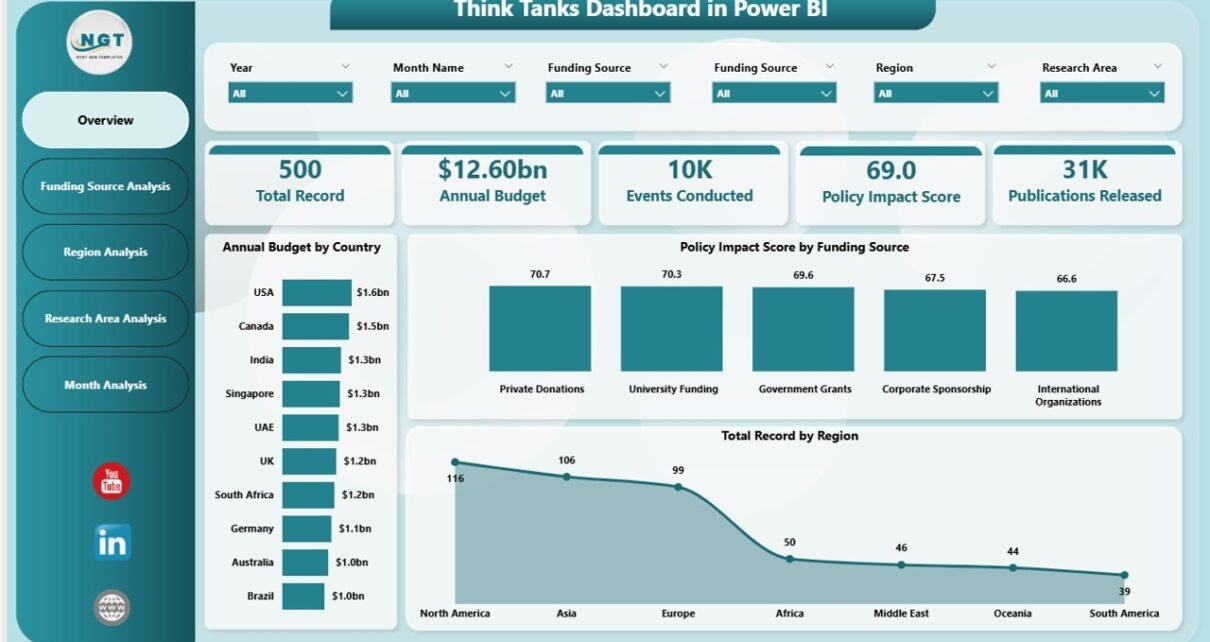
1️⃣ Overview Page – How Is Overall Performance Performing?
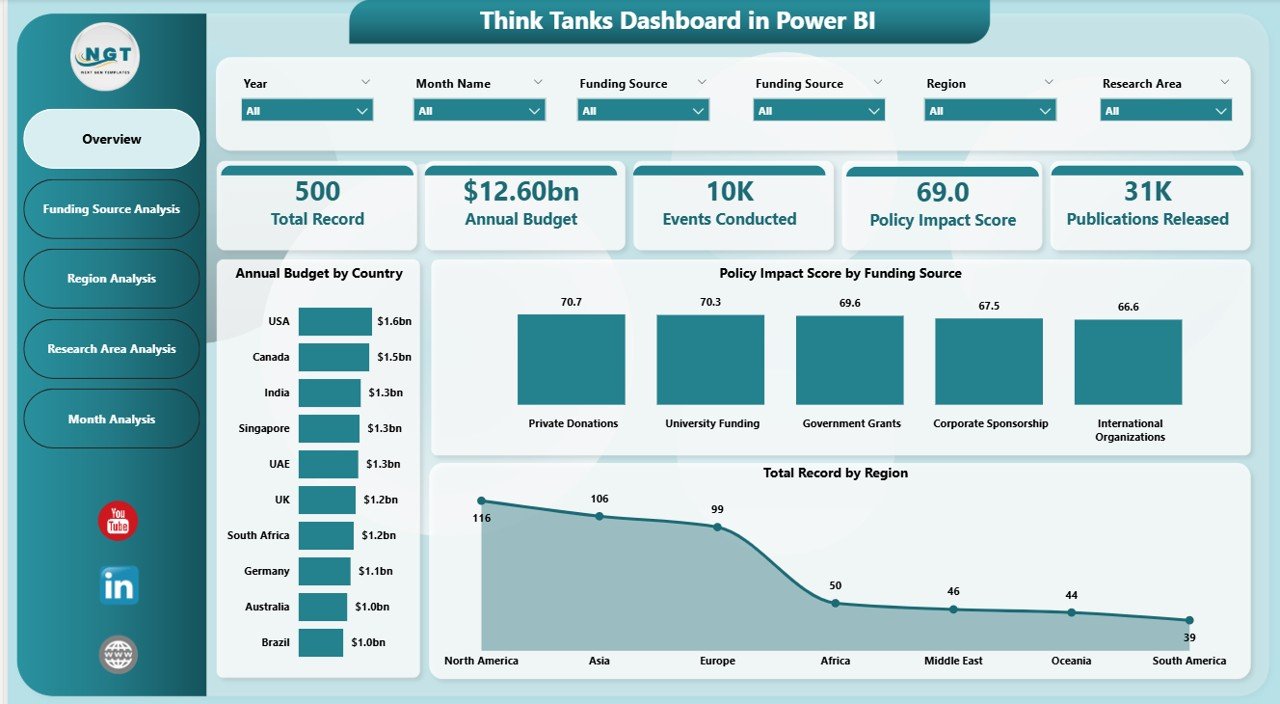
The Overview Page acts as the main control center of the dashboard. It provides a high-level snapshot of organizational performance.
Main Components
-
Interactive slicers for filtering data
-
KPI cards for quick performance tracking
-
Comparative analytics visuals
Key Visuals
-
Annual Budget by Country
-
Policy Impact Score by Funding Source
-
Total Records by Region
-
Performance summary cards
Insights You Can Gain
-
Which countries receive the highest research funding
-
How funding sources influence policy outcomes
-
Regional contribution to research output
-
Overall organizational performance trends
Because leaders often require quick summaries, this page enables fast executive decision-making.
2️⃣ Funding Source Analysis – Where Does Funding Drive Results?
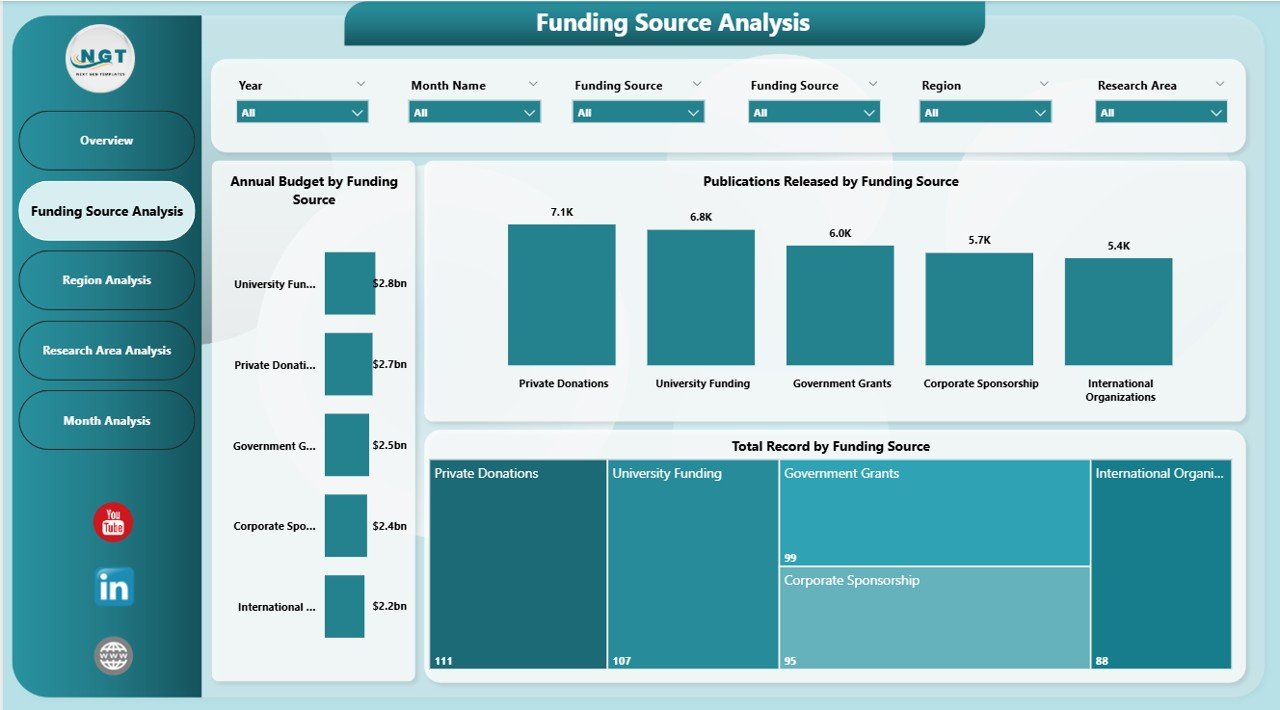
Funding determines research capacity. Therefore, analyzing funding sources helps organizations allocate resources effectively.
Dashboard Elements
-
Dynamic slicers for filtering by year or category
-
Interactive charts focused on funding performance
Charts Included
-
Annual Budget by Funding Source
-
Total Records by Funding Source
-
Publications Released by Funding Source
Questions Answered
-
Which funding source contributes the most?
-
Does higher funding generate more publications?
-
Which donors deliver the strongest policy impact?
As a result, finance teams optimize funding strategies more efficiently.
Click to Purchases Think Tanks Dashboard in Power BI
3️⃣ Region Analysis – Which Regions Perform Best?
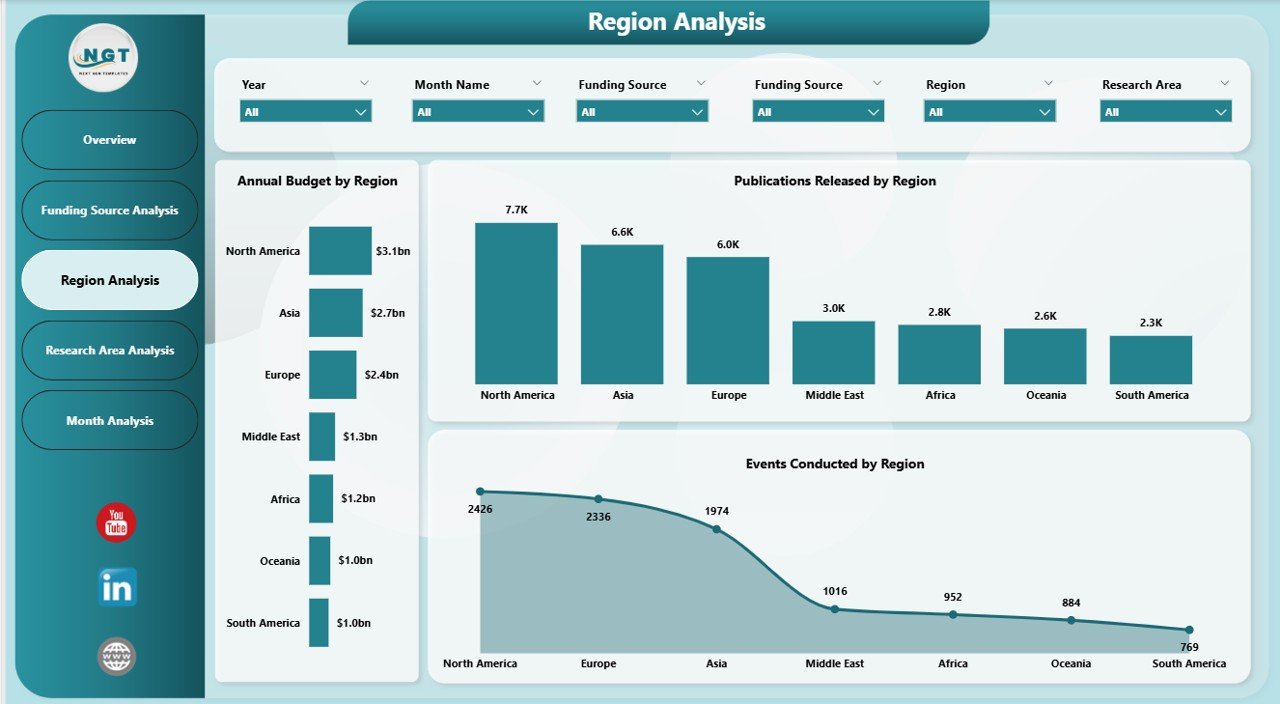
Think tanks operate across multiple regions. Hence, geographical analysis becomes essential.
Key Charts
-
Annual Budget by Region
-
Events Conducted by Region
-
Publications Released by Region
Analytical Benefits
-
Identify high-performing regions
-
Track event engagement geographically
-
Compare research productivity across locations
Moreover, organizations can adjust regional strategies based on performance data.
4️⃣ Research Area Analysis – Which Topics Generate Impact?
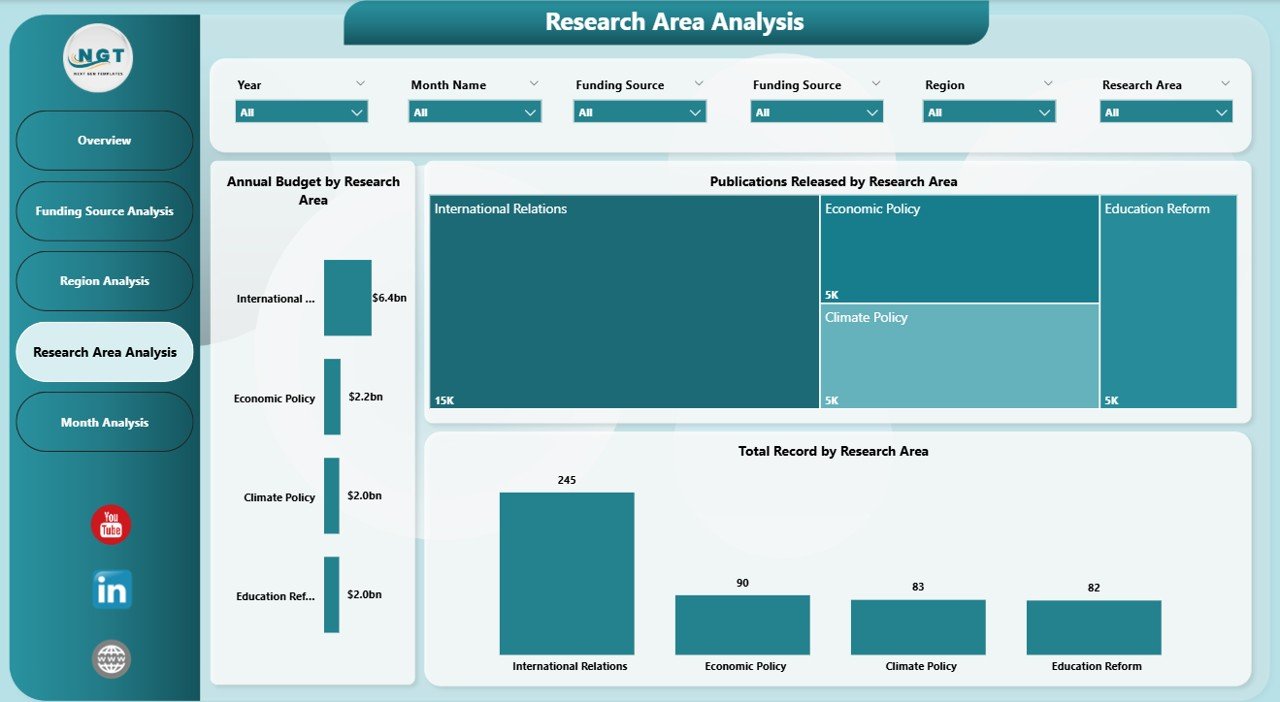
Research areas represent the intellectual core of think tanks. Therefore, tracking performance by research area provides strategic clarity.
Included Visuals
-
Annual Budget by Research Area
-
Total Records by Research Area
-
Publications Released by Research Area
Insights Generated
-
Most funded research domains
-
High-performing policy areas
-
Publication productivity by topic
Consequently, leadership prioritizes research initiatives that create measurable impact.
Click to Purchases Think Tanks Dashboard in Power BI
5️⃣ Month Analysis – How Does Performance Change Over Time?
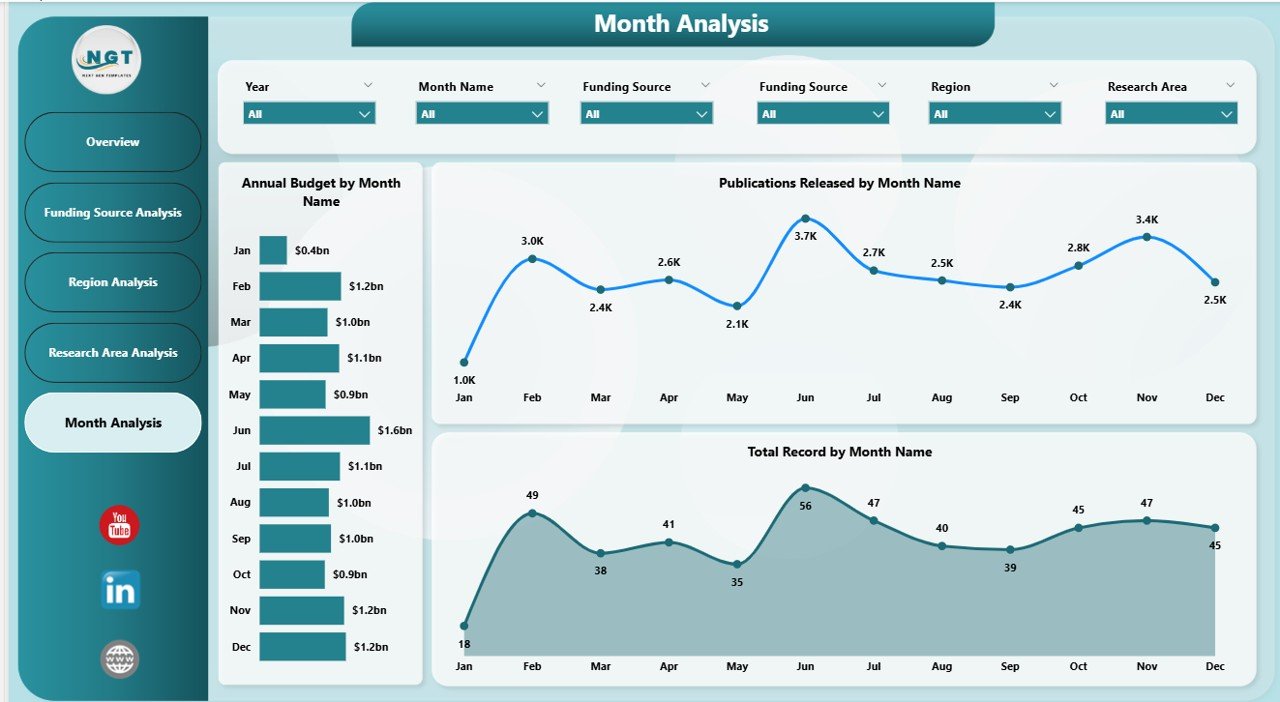
Time-based analysis helps organizations understand trends and seasonality.
Charts Included
-
Annual Budget by Month
-
Total Records by Month
-
Publications Released by Month
What You Can Analyze
-
Monthly funding trends
-
Publication cycles
-
Seasonal activity patterns
Because trends reveal operational behavior, teams can forecast future performance accurately.
What Data Is Required for This Dashboard?
To build this dashboard effectively, organizations typically collect structured data such as:
-
Country
-
Region
-
Funding Source
-
Research Area
-
Publication Count
-
Event Details
-
Budget Allocation
-
Policy Impact Score
-
Date or Month
Once uploaded into Power BI, this data automatically powers visual analytics.
How Does the Dashboard Support Decision-Making?
A Think Tanks Dashboard enables leaders to answer critical questions quickly:
-
Which research programs deliver results?
-
Where should funding increase?
-
Which regions require improvement?
-
How effective are policy initiatives?
Because decisions rely on data rather than assumptions, organizations achieve stronger outcomes.
Advantages of Think Tanks Dashboard in Power BI
✅ Centralized Data Visibility
All research metrics appear in one unified interface.
✅ Faster Decision-Making
Leaders analyze performance instantly without waiting for reports.
✅ Interactive Exploration
Users filter and drill into data dynamically.
✅ Improved Funding Transparency
Stakeholders clearly understand budget allocation.
✅ Performance Accountability
Teams track outputs and outcomes effectively.
✅ Real-Time Insights
Automatic refresh ensures updated information.
How Does This Dashboard Improve Research Management?
Click to Purchases Think Tanks Dashboard in Power BI
Research management often involves coordination between analysts, donors, and policymakers. However, manual reporting slows communication.
This dashboard improves workflows because:
-
Analysts update data once
-
Visuals update automatically
-
Leadership reviews insights instantly
-
Stakeholders access shared dashboards
Therefore, collaboration improves significantly.
Best Practices for the Think Tanks Dashboard in Power BI
To maximize dashboard effectiveness, organizations should follow proven best practices.
1. Define Clear KPIs
Choose measurable indicators such as:
-
Publication count
-
Budget utilization
-
Policy impact score
-
Event participation
2. Keep Visuals Simple
Avoid overcrowded charts. Instead, focus on clarity.
3. Use Consistent Data Structure
Maintain standardized formats for dates, regions, and categories.
4. Enable Data Validation
Clean data ensures accurate insights.
5. Apply Meaningful Filters
Use slicers for:
-
Year
-
Country
-
Funding Source
-
Research Area
6. Update Data Regularly
Schedule refresh cycles to maintain relevance.
7. Focus on Storytelling
Every dashboard should answer business questions clearly.
Common Challenges and How This Dashboard Solves Them
Challenge: Scattered Reports
➡ Dashboard centralizes all analytics.
Challenge: Slow Reporting
➡ Automation reduces manual work.
Challenge: Lack of Visibility
➡ Interactive visuals provide clarity.
Challenge: Funding Analysis Difficulty
➡ Dedicated funding analysis page simplifies evaluation.
Who Can Benefit from a Think Tanks Dashboard?
Click to Purchases Think Tanks Dashboard in Power BI
This dashboard supports multiple stakeholders:
-
Policy Research Organizations
-
Non-Profit Think Tanks
-
Government Advisory Bodies
-
Academic Research Institutes
-
International Development Agencies
-
Strategy Consultants
Because each stakeholder views data differently, Power BI enables customized insights.
How to Implement a Think Tanks Dashboard in Power BI?
Step 1: Prepare Data
Organize datasets into structured tables.
Step 2: Import Data into Power BI
Load Excel or database files.
Step 3: Create Relationships
Connect tables logically.
Step 4: Build Measures
Use DAX formulas for calculations.
Step 5: Design Visual Pages
Create overview and analysis pages.
Step 6: Add Slicers
Enable user interaction.
Step 7: Publish Dashboard
Share securely via Power BI Service.
Why Power BI Is Ideal for Think Tanks
Power BI offers several advantages compared to traditional tools:
-
Strong visualization engine
-
Easy integration with Excel
-
Cloud collaboration
-
Data security controls
-
Scalability for growing datasets
Therefore, organizations achieve enterprise-level analytics without expensive systems.
Future Trends in Think Tank Analytics
As analytics evolves, think tanks increasingly adopt advanced technologies.
Emerging Trends
-
AI-driven policy insights
-
Predictive analytics
-
Automated reporting
-
Real-time collaboration
-
Data storytelling dashboards
Consequently, dashboards will become strategic decision platforms rather than reporting tools.
Conclusion
The Think Tanks Dashboard in Power BI transforms how research organizations manage performance, funding, and policy outcomes. Instead of depending on manual reporting, teams gain instant visibility into operational activities through interactive analytics.
Moreover, the dashboard’s five analytical pages — Overview, Funding Source Analysis, Region Analysis, Research Area Analysis, and Month Analysis — provide complete organizational insight.
As a result, leadership makes faster, smarter, and more transparent decisions. When organizations combine structured data with Power BI’s visualization capabilities, they unlock the true power of data-driven policy research.
Frequently Asked Questions (FAQs)
1. What is a Think Tanks Dashboard in Power BI used for?
It helps organizations monitor research performance, funding allocation, publications, and policy impact using interactive analytics.
2. Can non-technical users operate this dashboard?
Yes. Power BI dashboards provide simple filters and visuals that anyone can use easily.
3. What type of data works best for this dashboard?
Structured datasets including budgets, publications, regions, funding sources, and research areas work best.
4. How often should data be updated?
Organizations should update data monthly or automatically using scheduled refresh.
5. Is Power BI suitable for non-profit organizations?
Yes. Power BI offers scalable analytics ideal for non-profits and research institutions.
6. Can this dashboard support multiple countries?
Yes. Power BI handles global datasets efficiently.
7. Does the dashboard support real-time analytics?
Yes, when connected to live data sources.
Visit our YouTube channel to learn step-by-step video tutorials