Modern fertilizer manufacturing companies operate in a highly competitive and efficiency-driven environment. Every day, plants manage raw material consumption, production output, energy usage, quality parameters, logistics, and operational costs. However, many organizations still depend on disconnected spreadsheets and manual reports to monitor performance.
As a result, managers struggle to track key metrics in real time. Decision-making becomes slow, operational inefficiencies increase, and performance gaps remain unnoticed. Therefore, manufacturers now focus on data-driven performance management systems that provide instant visibility into operations.
One practical and powerful solution is the Fertilizer Manufacturing KPI Dashboard in Excel. This ready-to-use dashboard converts complex operational data into meaningful insights using automated calculations, KPI tracking, and visual performance indicators.
In this comprehensive guide, you will learn everything about the Fertilizer Manufacturing KPI Dashboard in Excel — including its structure, benefits, features, implementation steps, best practices, and frequently asked questions.
Click to Purchases Fertilizer Manufacturing KPI Dashboard in Excel
What Is a Fertilizer Manufacturing KPI Dashboard in Excel?
A Fertilizer Manufacturing KPI Dashboard in Excel is an interactive performance monitoring tool designed to track and analyze key performance indicators across fertilizer production operations.
Instead of reviewing multiple reports, managers can monitor all KPIs from a single dashboard. Moreover, Excel automation helps users compare actual performance with targets and previous year results instantly.
Typically, the dashboard tracks:
-
Production efficiency
-
Plant utilization
-
Raw material consumption
-
Energy usage
-
Quality compliance
-
Operational costs
-
Delivery performance
Because Excel remains widely accessible, companies can implement this dashboard without expensive software investments.
Why Do Fertilizer Manufacturers Need KPI Dashboards?
Fertilizer production involves complex chemical processes and strict operational control. Therefore, companies must continuously measure performance.
Without structured KPI tracking:
-
Teams rely on manual calculations.
-
Performance trends remain hidden.
-
Managers react late to production issues.
-
Costs increase unnecessarily.
However, a KPI dashboard solves these problems by providing centralized performance monitoring.
Key Reasons Organizations Adopt KPI Dashboards
-
Real-time operational visibility
-
Faster decision-making
-
Improved productivity tracking
-
Better cost management
-
Performance accountability across departments
As a result, organizations move from reactive management to proactive optimization.
Click to Purchases Fertilizer Manufacturing KPI Dashboard in Excel
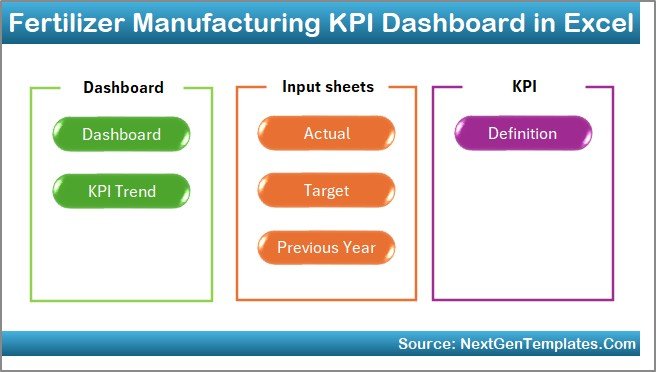
Key Features of the Fertilizer Manufacturing KPI Dashboard in Excel
This ready-to-use dashboard includes seven structured worksheets, each designed to perform a specific function.
1. Home Sheet – Easy Navigation Center
The Home Sheet works as an index page.
It includes:
-
Six navigation buttons
-
Quick access to all dashboard sections
-
User-friendly interface
Therefore, users can move between sheets without searching manually.
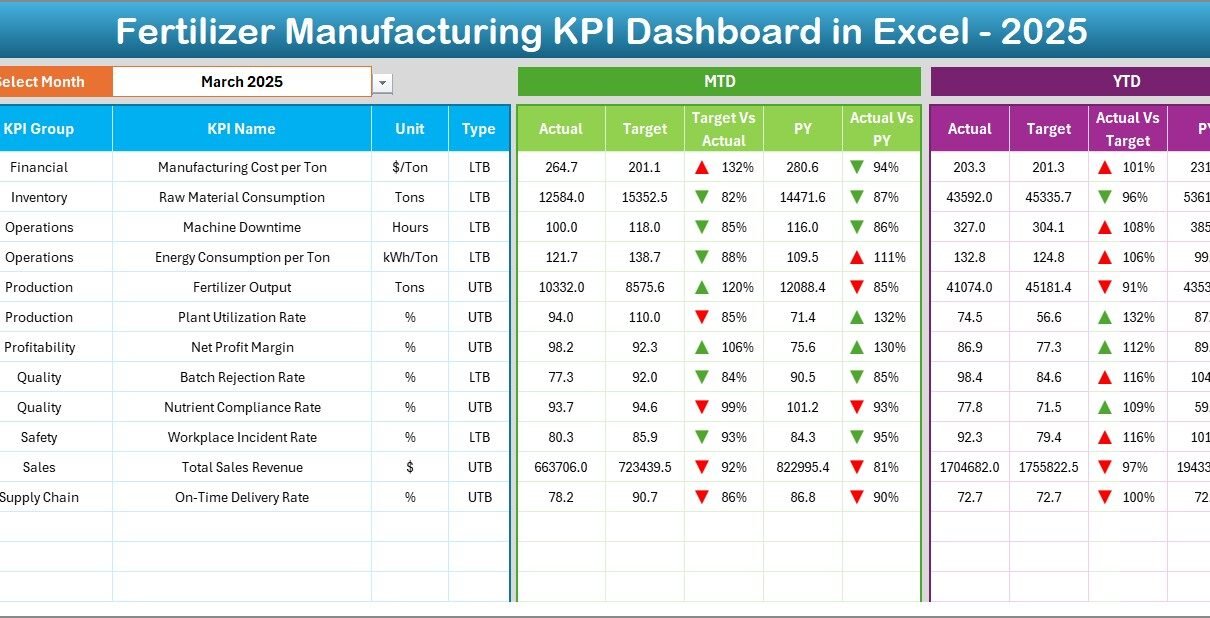
2. Dashboard Sheet – Main KPI Monitoring Area
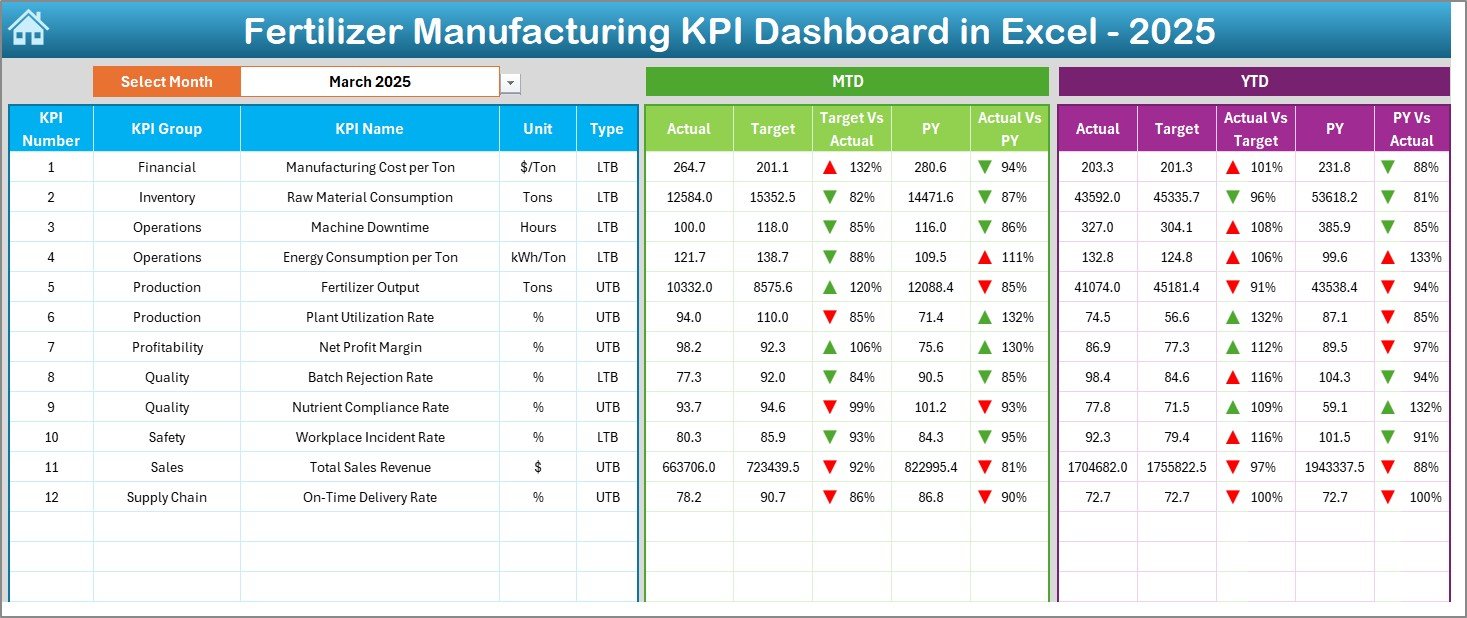
The Dashboard Sheet acts as the central analysis page.
Here, users can view complete KPI performance at a glance.
Key Functionalities
-
Month selection dropdown in cell D3
-
Automatic dashboard updates based on selected month
-
MTD (Month-to-Date) performance tracking
-
YTD (Year-to-Date) performance tracking
Performance Metrics Displayed
-
MTD Actual vs Target
-
MTD Previous Year vs Actual
-
YTD Actual vs Target
-
YTD Previous Year comparison
Additionally, conditional formatting displays:
-
▲ Up arrows for improvement
-
▼ Down arrows for decline
Consequently, managers instantly understand performance status.
Click to Purchases Fertilizer Manufacturing KPI Dashboard in Excel
3. KPI Trend Sheet – Performance Analysis Over Time
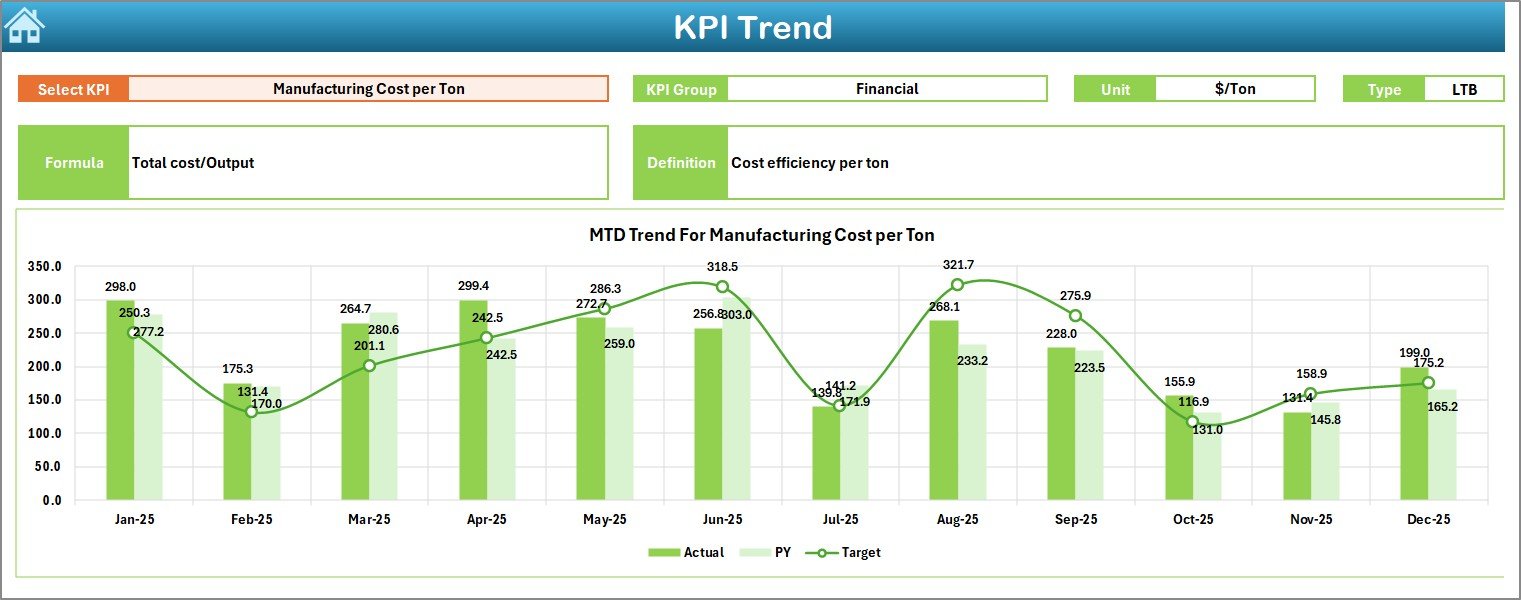
The KPI Trend Sheet helps users analyze individual KPI behavior.
Users select the KPI name from the dropdown in cell C3.
This sheet displays:
-
KPI Group
-
Unit of measurement
-
KPI type (Lower the Better / Upper the Better)
-
Formula explanation
-
KPI definition
Moreover, the dashboard shows:
-
MTD trend charts
-
YTD trend charts
-
Actual vs Target vs Previous Year comparisons
Therefore, users can identify patterns and performance gaps easily.
4. Actual Numbers Input Sheet – Data Entry Area
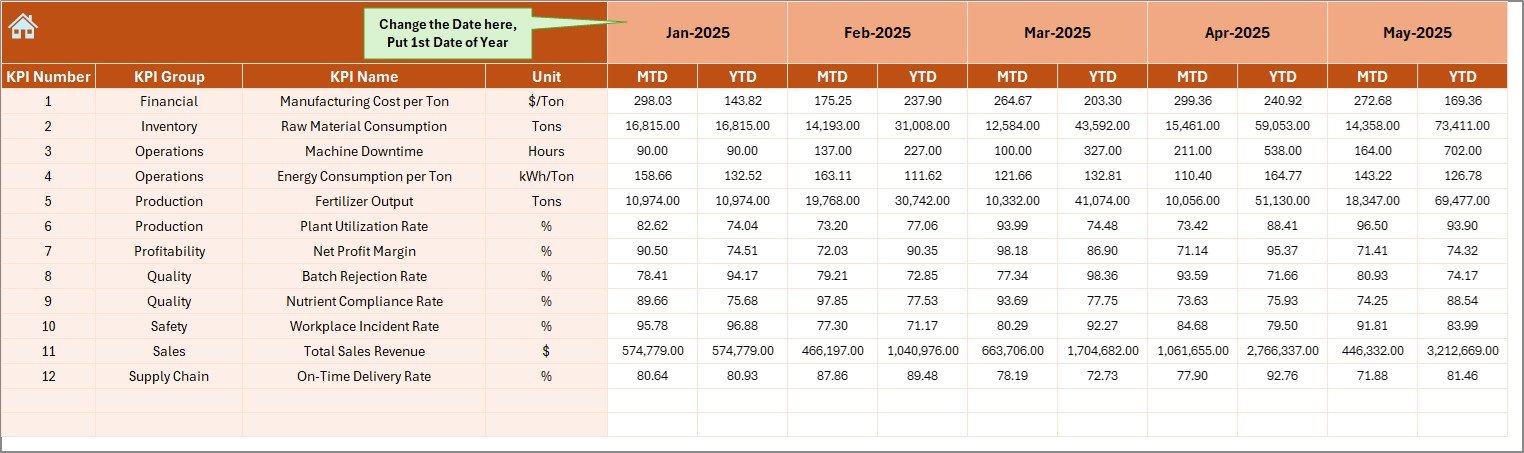
This sheet allows users to enter operational data.
Key functionality includes:
-
Month selection in cell E1
-
Automatic yearly progression
-
Entry fields for MTD and YTD actual values
Once users update numbers, the entire dashboard refreshes automatically.
5. Target Sheet – Performance Planning
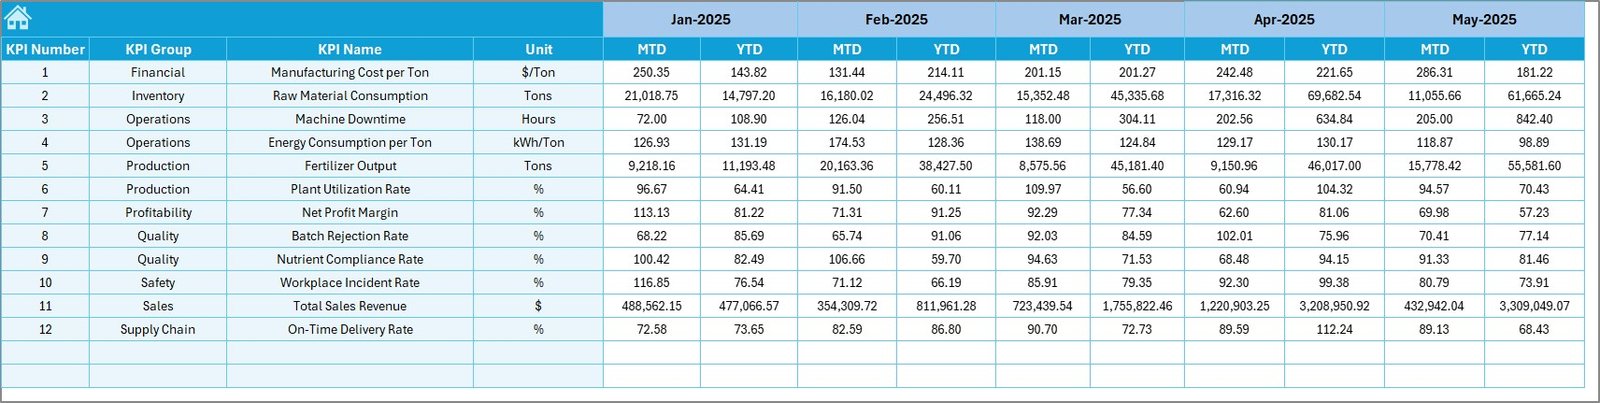
The Target Sheet stores monthly KPI targets.
Users enter:
-
Monthly MTD targets
-
YTD targets for each KPI
Because targets define expectations, this sheet plays a critical role in performance evaluation.
6. Previous Year Numbers Sheet – Historical Comparison
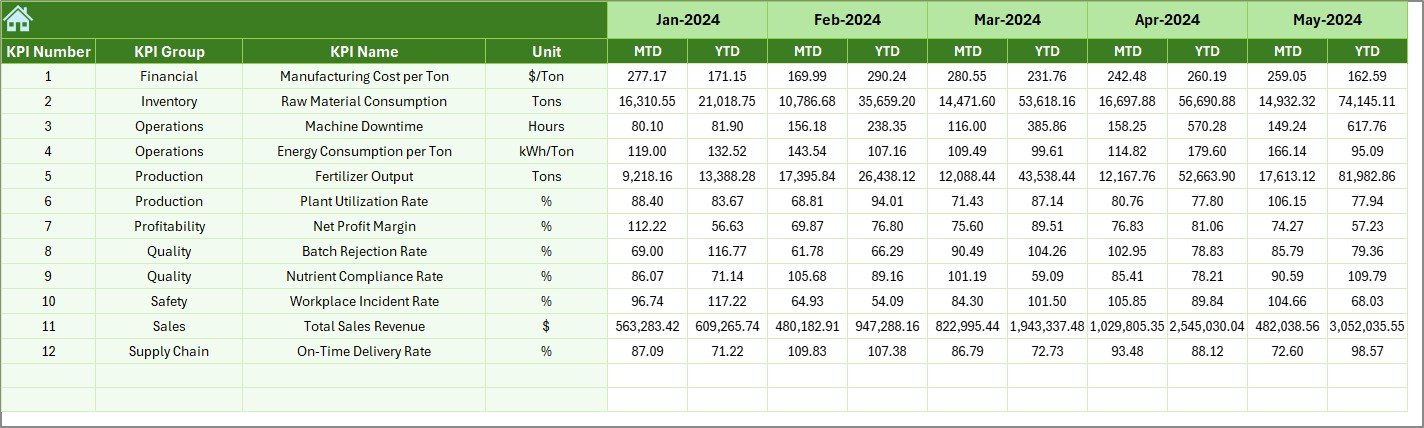
This worksheet stores last year’s performance data.
Users enter values similar to current-year inputs. Afterward, the dashboard compares:
-
Current vs Previous Year
-
Growth trends
-
Performance improvement levels
Therefore, managers clearly measure progress.
7. KPI Definition Sheet – KPI Master Database
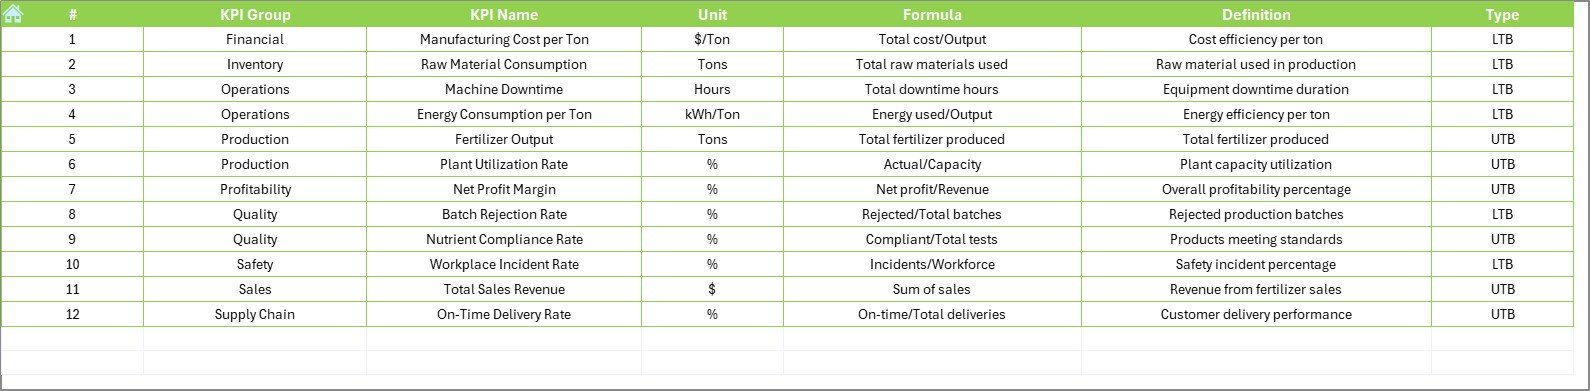
The KPI Definition Sheet acts as a reference library.
Users define:
-
KPI Name
-
KPI Group
-
Unit
-
Formula
-
KPI Definition
As a result, every KPI remains standardized across the organization.
Which KPIs Should Fertilizer Manufacturers Track?
Although KPIs vary by organization, most fertilizer plants monitor operational, financial, and quality metrics.
Click to Purchases Fertilizer Manufacturing KPI Dashboard in Excel
Production KPIs
-
Production Volume
-
Plant Capacity Utilization
-
Batch Completion Rate
-
Downtime Percentage
Quality KPIs
-
Product Purity Level
-
Rejection Rate
-
Quality Compliance Score
Cost KPIs
-
Energy Cost per Ton
-
Raw Material Cost
-
Maintenance Cost
Supply Chain KPIs
-
Delivery Timeliness
-
Inventory Turnover
-
Logistics Efficiency
Tracking these KPIs ensures balanced operational performance.
How Does the Dashboard Improve Decision-Making?
When managers access structured data, they make faster and better decisions.
For example:
-
If energy cost increases, teams investigate consumption trends.
-
If production drops, supervisors analyze downtime KPIs.
-
If quality declines, managers review process parameters.
Therefore, the dashboard converts data into actionable insights.
Advantages of Fertilizer Manufacturing KPI Dashboard in Excel
Organizations gain multiple benefits after implementing this dashboard.
✅ Centralized Performance Monitoring
All KPIs appear in one location, reducing reporting confusion.
✅ Faster Analysis
Users no longer create manual reports every month.
✅ Improved Accountability
Teams clearly see targets versus achievements.
✅ Historical Comparison
Previous year analysis highlights improvement areas.
✅ Cost-Effective Solution
Excel eliminates expensive BI software requirements.
✅ Easy Customization
Companies can add or modify KPIs anytime.
✅ Better Strategic Planning
Leaders identify trends before problems escalate.
How to Implement the Fertilizer Manufacturing KPI Dashboard?
Successful implementation requires a structured approach.
Step 1: Define KPIs
Identify measurable KPIs aligned with business goals.
Step 2: Populate KPI Definition Sheet
Enter formulas, units, and KPI descriptions.
Step 3: Set Targets
Input monthly targets for all KPIs.
Step 4: Enter Actual Data
Update operational numbers regularly.
Step 5: Review Dashboard Monthly
Analyze trends and identify deviations.
Step 6: Take Corrective Actions
Assign improvement plans based on insights.
Following these steps ensures smooth adoption.
Best Practices for the Fertilizer Manufacturing KPI Dashboard
Organizations achieve better results when they follow proven practices.
1. Update Data Regularly
Consistent updates keep insights reliable.
2. Keep KPIs Relevant
Avoid tracking unnecessary metrics.
3. Use Standard Definitions
Ensure everyone understands KPI formulas.
4. Review Trends, Not Just Numbers
Trend analysis reveals long-term issues.
5. Train Team Members
Users must understand dashboard interpretation.
6. Automate Data Collection
Whenever possible, connect operational systems.
7. Conduct Monthly Review Meetings
Discuss KPI performance with stakeholders.
These practices improve dashboard effectiveness significantly.
Common Challenges and How to Overcome Them
Click to Purchases Fertilizer Manufacturing KPI Dashboard in Excel
Even powerful dashboards face adoption challenges.
Data Accuracy Issues
Solution: Establish validation checks.
Resistance to Change
Solution: Train employees and demonstrate benefits.
Too Many KPIs
Solution: Focus on critical metrics only.
Irregular Updates
Solution: Assign dashboard ownership.
When organizations address these issues early, success becomes easier.
Real-World Use Cases of KPI Dashboards in Fertilizer Plants
Production Optimization
Managers monitor output trends and reduce downtime.
Cost Control
Finance teams analyze energy and material costs.
Quality Improvement
Quality teams track defect rates continuously.
Strategic Planning
Leadership evaluates yearly performance growth.
Therefore, dashboards support both operational and strategic decisions.
Why Excel Remains a Powerful Tool for KPI Dashboards?
Although advanced BI tools exist, Excel continues to dominate business analytics.
Reasons include:
-
Familiar interface
-
Low implementation cost
-
High flexibility
-
Strong calculation capabilities
-
Easy sharing across teams
Consequently, Excel dashboards remain practical for manufacturing industries.
How Does This Dashboard Support Continuous Improvement?
Continuous improvement requires measurable performance.
The dashboard helps organizations:
-
Detect inefficiencies early
-
Compare performance trends
-
Monitor improvement initiatives
-
Align teams with company goals
As a result, organizations build a culture of performance excellence.
Future Scope of KPI Dashboards in Manufacturing
Manufacturing analytics continues evolving rapidly.
Future enhancements may include:
-
Automated data integration
-
Predictive analytics
-
AI-based forecasting
-
Real-time production monitoring
However, Excel dashboards still serve as the foundation for performance tracking.
Conclusion
The Fertilizer Manufacturing KPI Dashboard in Excel provides a structured, practical, and powerful way to monitor manufacturing performance. Instead of relying on manual reporting, organizations gain real-time visibility into production, quality, and cost metrics.
Moreover, the dashboard simplifies performance tracking through automated calculations, visual indicators, and trend analysis. Because it combines accessibility with analytical power, companies of all sizes can adopt it easily.
Ultimately, organizations that track KPIs consistently improve efficiency, reduce costs, and make smarter decisions. Therefore, implementing a KPI dashboard becomes not just an operational upgrade but a strategic advantage.
Frequently Asked Questions (FAQs)
What is a KPI dashboard in fertilizer manufacturing?
A KPI dashboard is a performance monitoring tool that tracks production, cost, quality, and operational metrics in a single interface.
Why should fertilizer plants use Excel dashboards?
Excel dashboards provide affordable, flexible, and easy-to-use performance monitoring without requiring advanced software.
How often should KPI data be updated?
Organizations should update KPI data monthly or weekly depending on operational needs.
Can companies customize this dashboard?
Yes. Users can add new KPIs, modify formulas, and adjust targets according to business requirements.
What is the difference between MTD and YTD analysis?
-
MTD measures performance within the current month.
-
YTD measures cumulative performance from the beginning of the year.
Who should use this dashboard?
-
Plant managers
-
Production supervisors
-
Quality teams
-
Finance analysts
-
Operations leaders
Does the dashboard help reduce manufacturing costs?
Click to Purchases Fertilizer Manufacturing KPI Dashboard in Excel
Yes. By identifying inefficiencies and tracking performance trends, organizations can control costs effectively.
Visit our YouTube channel to learn step-by-step video tutorials