Agricultural exports play a vital role in strengthening a country’s economy. Governments, exporters, agribusiness companies, and trade organizations continuously monitor export performance to ensure growth, profitability, and global competitiveness. However, managing export performance becomes challenging when teams rely on scattered spreadsheets and manual reports.
Therefore, businesses increasingly adopt structured performance monitoring systems. One of the most practical solutions is an Agricultural Exports KPI Scorecard in Excel.
This comprehensive article explains everything about the Agricultural Exports KPI Scorecard in Excel, including its structure, features, benefits, implementation steps, best practices, and real-world applications. Moreover, you will learn how this ready-to-use Excel template helps organizations track agricultural export performance efficiently.
Click to Purchases Agricultural Exports KPI Scorecard in Excel
What Is an Agricultural Exports KPI Scorecard in Excel?
An Agricultural Exports KPI Scorecard in Excel is a performance management tool designed to measure, monitor, and analyze key export indicators using structured dashboards and automated calculations.
Instead of reviewing multiple reports, decision-makers can view all important export KPIs on a single screen. Additionally, Excel automatically compares actual results with targets, helping organizations evaluate performance quickly.
Typically, the scorecard tracks:
-
Export volume growth
-
Shipment value
-
Market expansion performance
-
Delivery efficiency
-
Cost optimization
-
Quality compliance metrics
-
Revenue from agricultural exports
Because Excel remains widely used, teams can implement the scorecard without complex software investment.
Why Do Agricultural Export Businesses Need a KPI Scorecard?
Agricultural exports involve multiple stakeholders such as farmers, exporters, logistics providers, customs authorities, and international buyers. Consequently, performance tracking becomes complicated.
Common Challenges Without KPI Tracking
-
Lack of performance visibility
-
Delayed decision-making
-
Inconsistent reporting formats
-
Difficulty comparing targets vs results
-
Poor forecasting accuracy
However, when organizations use a KPI scorecard, they gain structured insights that support better planning and execution.
Click to Purchases Agricultural Exports KPI Scorecard in Excel
Key Features of Agricultural Exports KPI Scorecard in Excel
This ready-to-use template contains four structured worksheets, each designed to perform a specific analytical function.
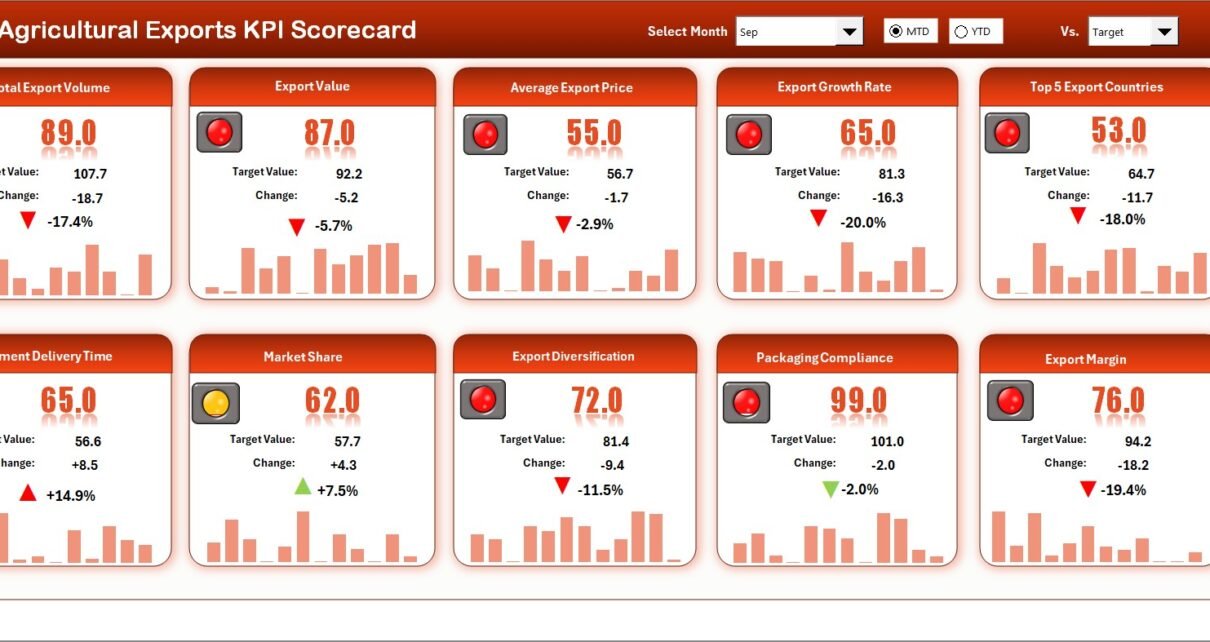
1. Scorecard Sheet – The Main Performance Dashboard
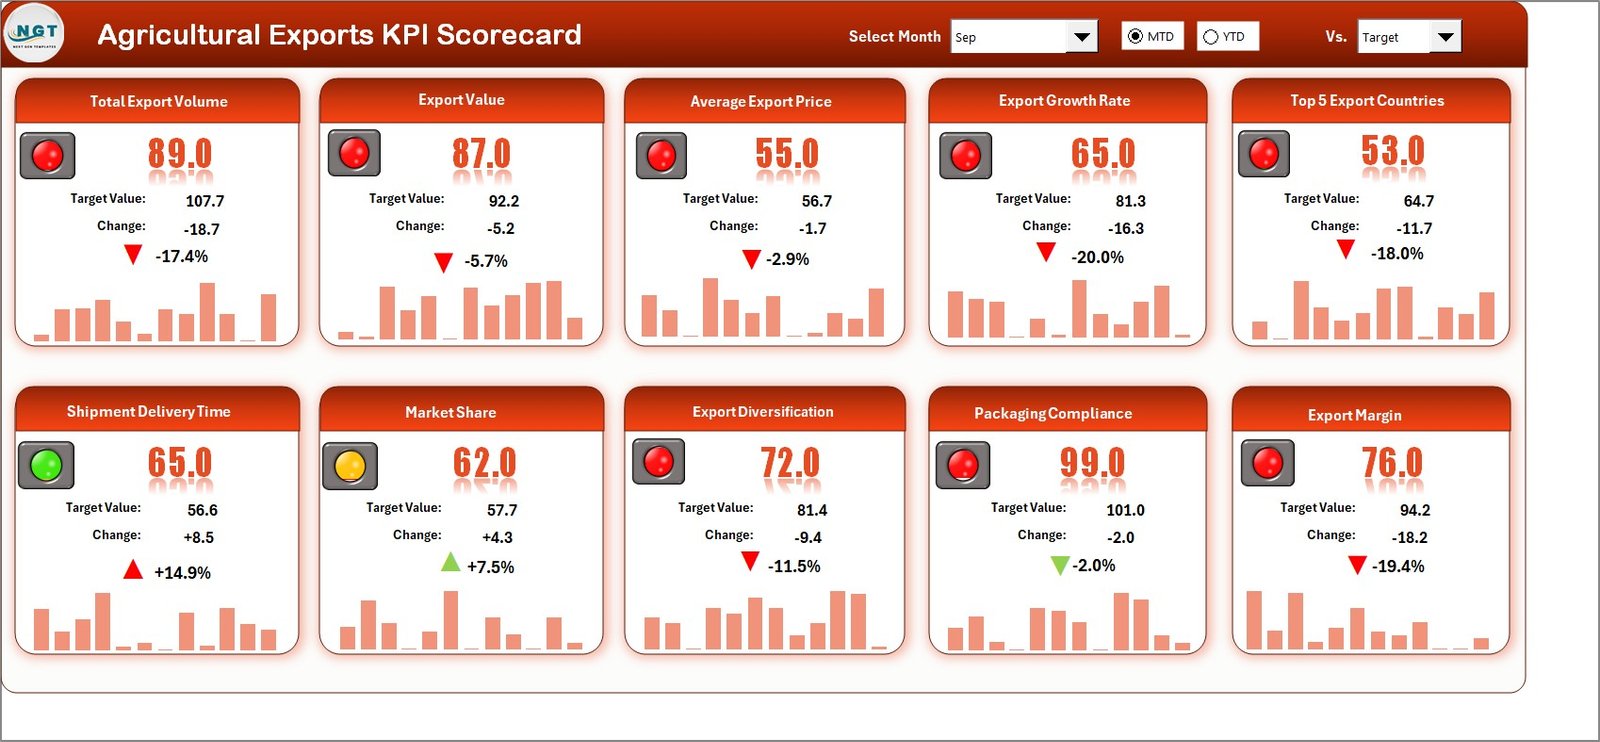
The Scorecard Sheet serves as the central interface where users analyze overall KPI performance.
Core Features
Dropdown Menus for Analysis
Users can select:
-
Month
-
MTD (Month-to-Date)
-
YTD (Year-to-Date)
Therefore, performance analysis becomes flexible and dynamic.
Actual vs Target Comparison
The dashboard compares real performance against planned targets. As a result, managers immediately understand performance gaps.
Visual Indicators
Color-coded indicators highlight performance status:
-
Green → On target
-
Yellow → Needs attention
-
Red → Below expectations
These visuals help users interpret results instantly.
Comprehensive KPI Overview
The scorecard displays all relevant KPI information together, including:
-
KPI values
-
MTD vs YTD comparison
-
Performance trends
Hence, executives gain quick insights without analyzing raw data.
Click to Purchases Agricultural Exports KPI Scorecard in Excel
2. KPI Trend Sheet – Performance Analysis Over Time
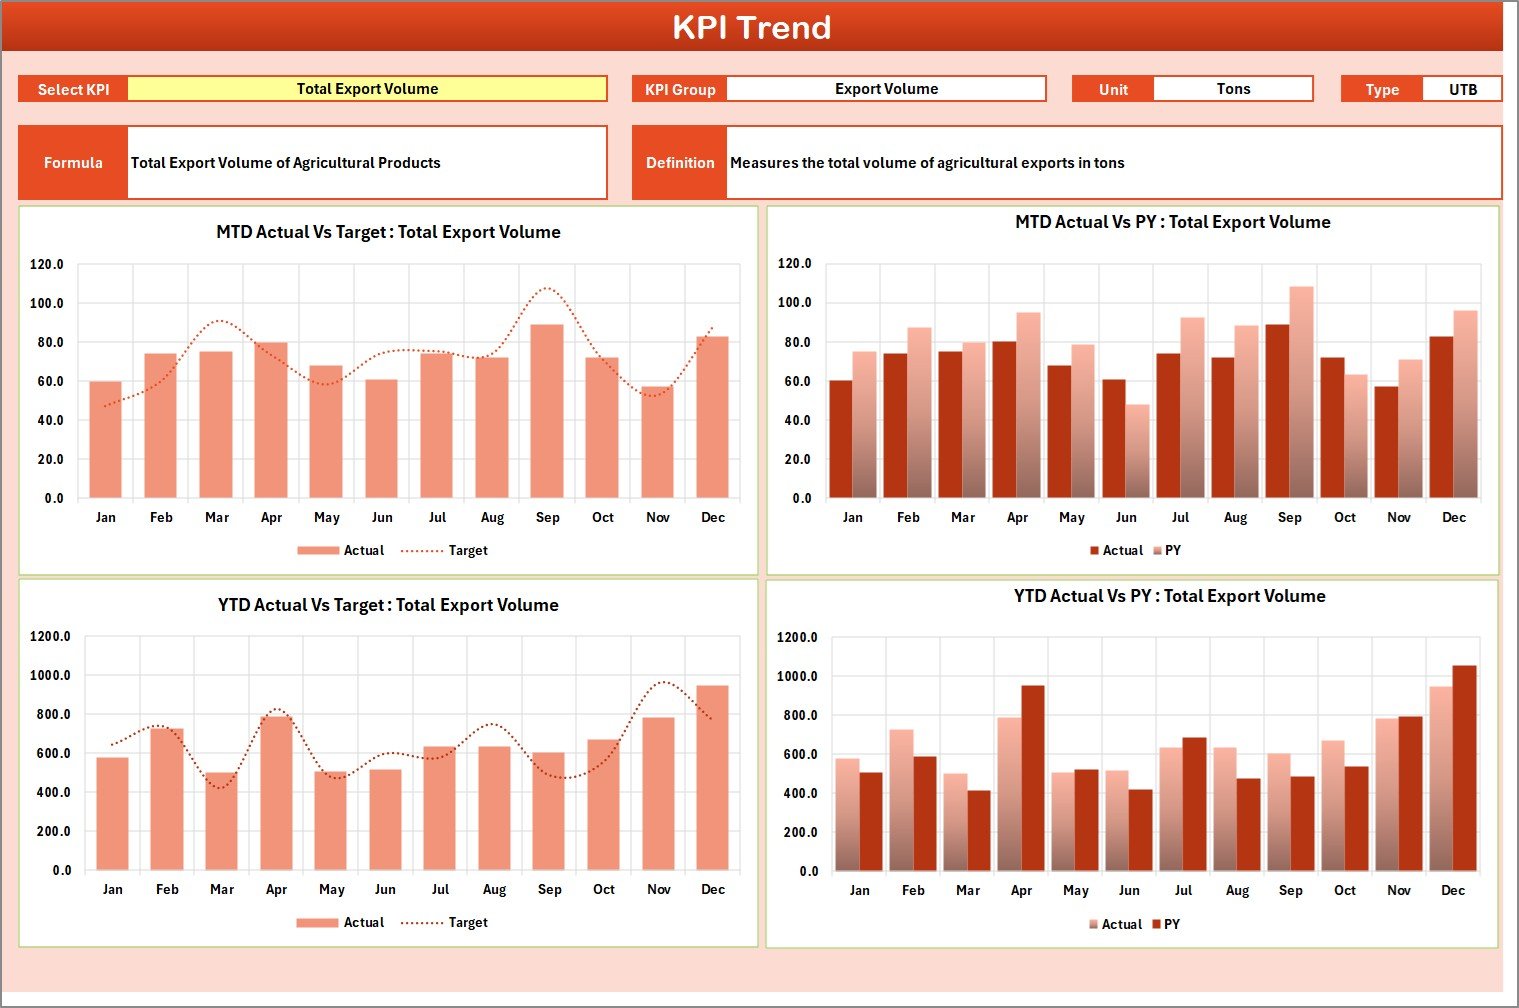
While the scorecard shows current performance, the KPI Trend Sheet explains how performance evolves over time.
KPI Selection Feature
Users select the KPI from dropdown cell C3, and the dashboard updates automatically.
Information Displayed
-
KPI Group
-
KPI Unit
-
KPI Type (Lower the Better / Upper the Better)
-
KPI Formula
-
KPI Definition
This structure ensures complete KPI understanding.
Trend Charts Included
The template displays trend charts for:
-
Actual values
-
Target values
-
Previous Year (PY) performance
Because trends appear visually, managers can easily identify growth patterns and seasonal fluctuations.
Click to Purchases Agricultural Exports KPI Scorecard in Excel
3. Input Data Sheet – Central Data Entry Area
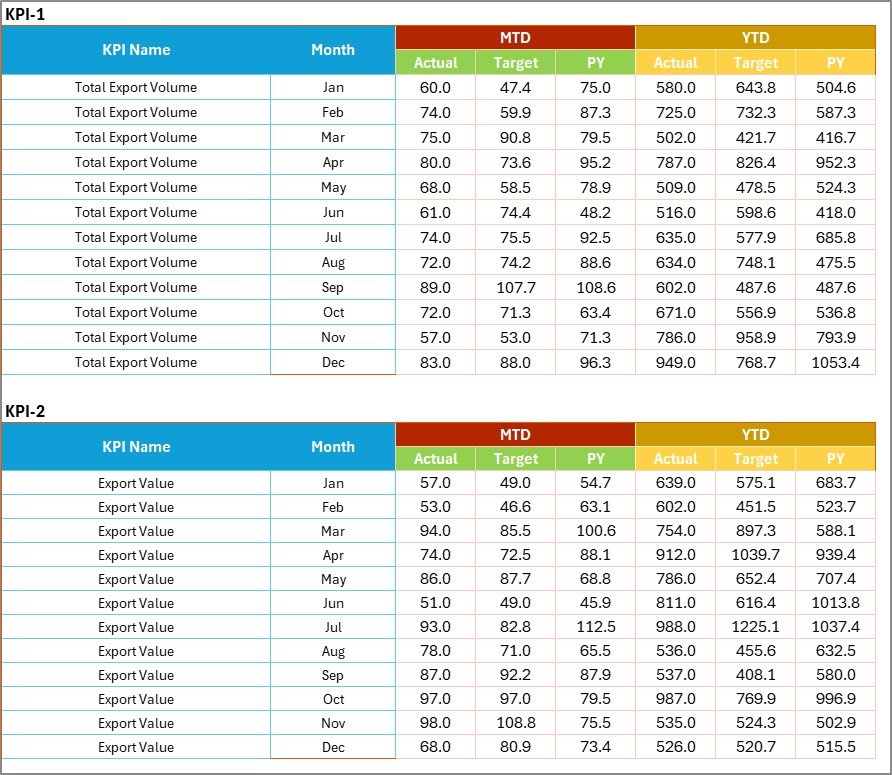
The Input Data Sheet acts as the operational backbone of the scorecard.
Key Functions
Data Entry
Users record:
-
Actual KPI values
-
Targets
-
Monthly performance data
Flexible Updates
As new export results become available, users simply update data entries.
Consequently, the dashboard refreshes automatically.
Why This Sheet Matters
-
Ensures data accuracy
-
Maintains centralized records
-
Simplifies reporting workflows
Thus, organizations avoid scattered data management.
Click to Purchases Agricultural Exports KPI Scorecard in Excel
4. KPI Definition Sheet – KPI Knowledge Base
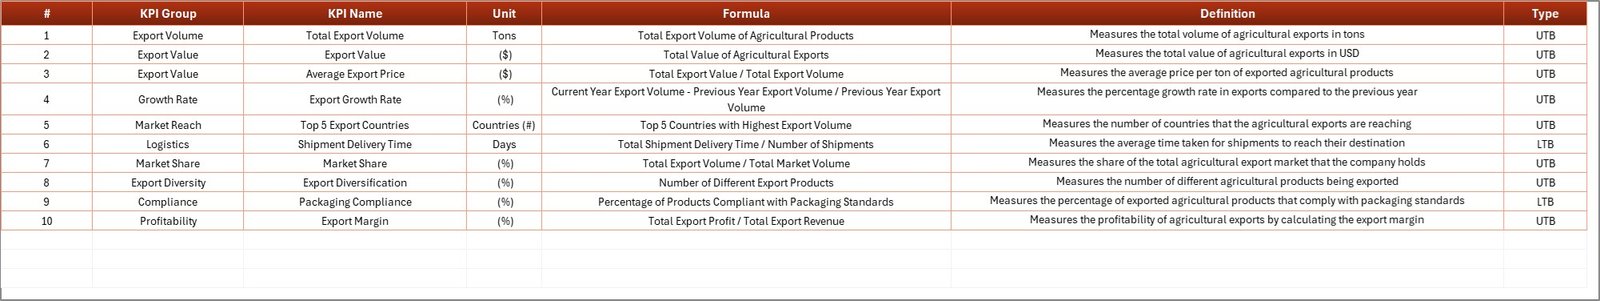
The KPI Definition Sheet standardizes KPI information across the organization.
Fields Included
-
KPI Name
-
KPI Group
-
Unit of Measurement
-
Formula
-
KPI Definition
Because definitions remain documented, teams maintain consistent performance measurement.
What KPIs Can Be Tracked in Agricultural Export Scorecards?
Organizations can monitor various export performance indicators.
Example KPIs
-
Export Volume (tons)
-
Export Revenue
-
Shipment Success Rate
-
Average Delivery Time
-
Market Expansion Rate
-
Export Cost per Shipment
-
Product Quality Compliance
-
Order Fulfillment Rate
-
Customer Satisfaction Index
-
Year-over-Year Export Growth
These KPIs provide a holistic view of export operations.
How Does the KPI Scorecard Improve Export Performance?
A structured KPI system transforms business decision-making.
Key Improvements
-
Faster performance analysis
-
Data-driven decisions
-
Improved export planning
-
Better resource allocation
-
Increased accountability
Therefore, organizations achieve sustainable growth.
Click to Purchases Agricultural Exports KPI Scorecard in Excel
Advantages of Agricultural Exports KPI Scorecard in Excel
✅ Centralized Performance Monitoring
All KPIs appear in one dashboard.
✅ Real-Time Insights
Updates reflect immediately after data entry.
✅ Easy to Use
Excel familiarity simplifies adoption.
✅ Automated Calculations
Reduces manual effort and errors.
✅ Visual Performance Indicators
Quickly identify strong and weak areas.
✅ Historical Trend Analysis
Compare performance across time periods.
✅ Customizable Framework
Organizations can modify KPIs easily.
Who Should Use This KPI Scorecard?
This template benefits multiple stakeholders.
Ideal Users
-
Agricultural exporters
-
Government trade departments
-
Agribusiness companies
-
Export analysts
-
Supply chain managers
-
Trade consultants
-
Export promotion agencies
Thus, the scorecard supports strategic and operational roles.
Click to Purchases Agricultural Exports KPI Scorecard in Excel
Real-World Applications of Agricultural Export KPI Tracking
Export Strategy Planning
Companies analyze performance before expanding into new markets.
Performance Reviews
Managers evaluate monthly and yearly export outcomes.
Government Reporting
Organizations prepare standardized performance reports.
Supply Chain Optimization
Teams identify delays and cost inefficiencies.
Market Performance Evaluation
Businesses compare results across regions.
How to Use the Agricultural Exports KPI Scorecard Step-by-Step?
Step 1: Define KPIs
Enter KPI details in the KPI Definition sheet.
Step 2: Enter Performance Data
Input monthly actual and target values.
Step 3: Select Analysis Period
Choose Month, MTD, or YTD.
Step 4: Review Scorecard
Analyze performance indicators.
Step 5: Study Trends
Use KPI Trend sheet for deeper analysis.
Step 6: Take Action
Adjust export strategies based on insights.
Click to Purchases Agricultural Exports KPI Scorecard in Excel
Best Practices for the Agricultural Exports KPI Scorecard
Maintain Accurate Data Entry
Incorrect data leads to misleading analysis.
Review KPIs Regularly
Update targets according to market changes.
Use Standard KPI Definitions
Ensure consistent interpretation.
Monitor Trends Monthly
Identify issues early.
Focus on Actionable KPIs
Track metrics that influence decisions.
Train Users
Ensure team members understand dashboard usage.
Common Mistakes to Avoid in KPI Scorecard Implementation
-
Tracking too many KPIs
-
Ignoring data validation
-
Not updating targets
-
Skipping trend analysis
-
Using inconsistent KPI definitions
Avoiding these mistakes improves performance monitoring effectiveness.
Future Scope of Agricultural KPI Monitoring
As agricultural exports grow globally, data analytics will become increasingly important.
Future enhancements may include:
-
Power BI integration
-
Automated reporting
-
Forecast analytics
-
Cloud collaboration
-
AI-driven performance prediction
Thus, Excel scorecards can evolve into advanced analytics platforms.
Conclusion
The Agricultural Exports KPI Scorecard in Excel provides a powerful yet simple way to monitor export performance. By combining structured data entry, automated dashboards, and visual analytics, the template helps organizations transform raw export data into meaningful insights.
Moreover, the scorecard improves decision-making, enhances accountability, and supports long-term export growth. Because Excel remains accessible and customizable, businesses can implement this solution quickly without heavy investment.
Ultimately, organizations that track KPIs consistently achieve stronger export performance and better strategic outcomes.
Click to Purchases Agricultural Exports KPI Scorecard in Excel
Frequently Asked Questions (FAQs)
What is an Agricultural Exports KPI Scorecard?
It is an Excel-based dashboard used to monitor export performance using measurable KPIs.
Can beginners use this template?
Yes. The template uses simple Excel features and dropdown selections.
What is MTD and YTD analysis?
MTD shows performance for the current month, while YTD shows performance from the beginning of the year.
Can I add new KPIs?
Yes. You can easily add KPIs in the KPI Definition sheet.
Does the scorecard update automatically?
Yes. Charts and indicators update once data changes.
Is this template suitable for government export reporting?
Yes. It supports structured and standardized reporting.
How often should KPI data be updated?
Organizations should update KPI data monthly or weekly.
Click to Purchases Agricultural Exports KPI Scorecard in Excel
Visit our YouTube channel to learn step-by-step video tutorials