The cement industry operates in a highly competitive and performance-driven environment. Manufacturers must continuously monitor production efficiency, operational costs, product quality, logistics performance, and sales outcomes. However, many cement companies still rely on disconnected spreadsheets and manual reports. As a result, decision-making becomes slow, performance gaps remain unnoticed, and operational efficiency declines.
Therefore, organizations increasingly adopt structured performance monitoring systems. One practical and powerful solution is the Cement Products KPI Dashboard in Excel.
This comprehensive guide explains everything about the Cement Products KPI Dashboard in Excel, including its structure, features, advantages, implementation process, best practices, and real-world applications. Moreover, this ready-to-use Excel dashboard transforms raw operational data into meaningful insights that help cement businesses improve productivity and profitability.
Click to Purchases Cement Products KPI Dashboard in Excel
What Is a Cement Products KPI Dashboard in Excel?
A Cement Products KPI Dashboard in Excel is a performance monitoring tool designed to track key operational and business metrics using automated calculations, visual indicators, and interactive reports.
Instead of reviewing multiple operational reports separately, managers can monitor all KPIs on a single dashboard. Additionally, the system compares current performance with targets and previous year results, enabling quick and informed decisions.
Typically, the dashboard tracks:
-
Production output
-
Plant efficiency
-
Sales performance
-
Dispatch and logistics metrics
-
Cost performance
-
Quality indicators
-
Inventory utilization
Because Excel remains widely accessible, companies can implement this solution quickly without investing in expensive software.
Why Does the Cement Industry Need a KPI Dashboard?
Cement manufacturing involves complex operations that include raw material handling, kiln operations, grinding processes, packaging, and distribution. Consequently, performance monitoring becomes essential.
Common Challenges Without KPI Dashboards
-
Delayed performance analysis
-
Manual data consolidation
-
Lack of real-time insights
-
Difficulty comparing targets and results
-
Limited visibility into operational trends
However, a KPI dashboard centralizes performance tracking and simplifies analysis.
Click to Purchases Cement Products KPI Dashboard in Excel
Key Features of Cement Products KPI Dashboard in Excel
This ready-to-use dashboard contains seven structured worksheets, each designed for a specific analytical purpose.
1. Home Sheet – Central Navigation Panel
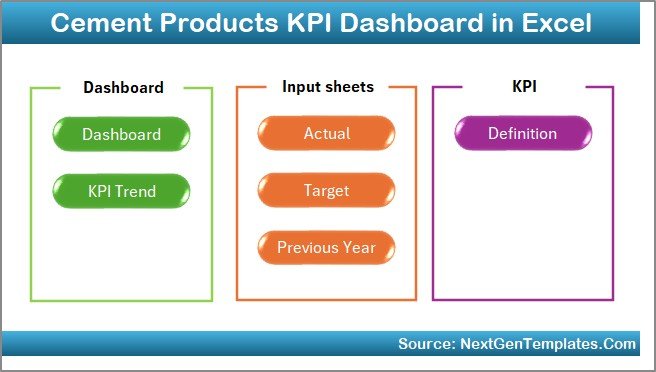
The Home Sheet acts as an index page that improves user navigation.
Features
-
Six navigation buttons
-
Quick access to all sheets
-
User-friendly interface
Because of this structure, users move across reports without searching manually.
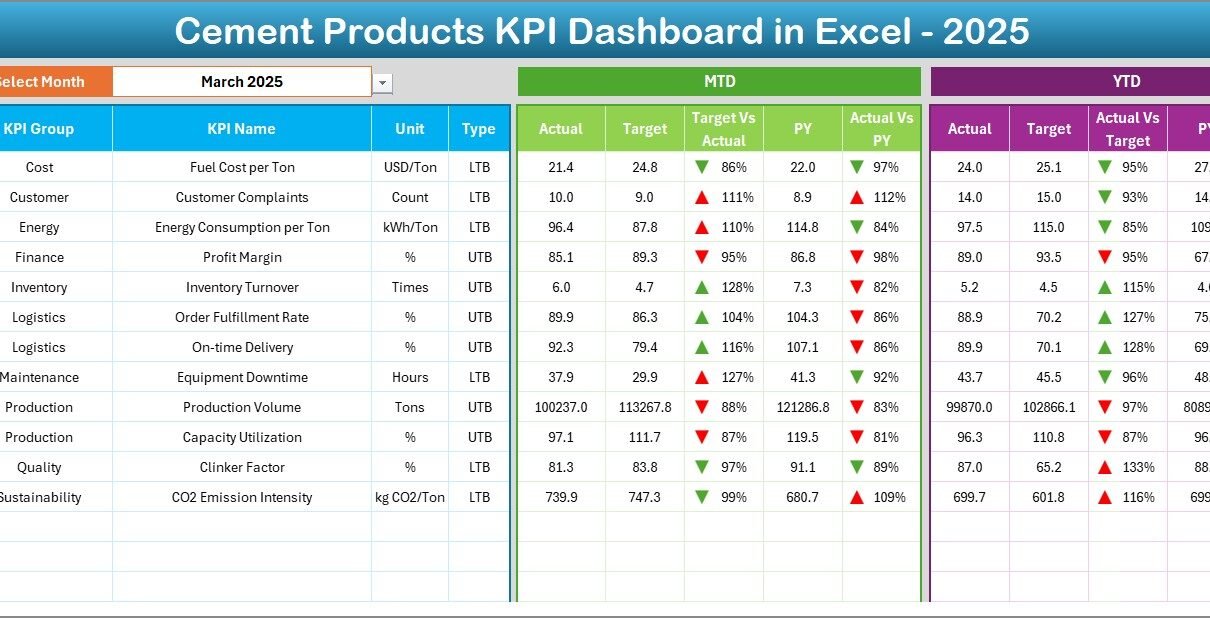
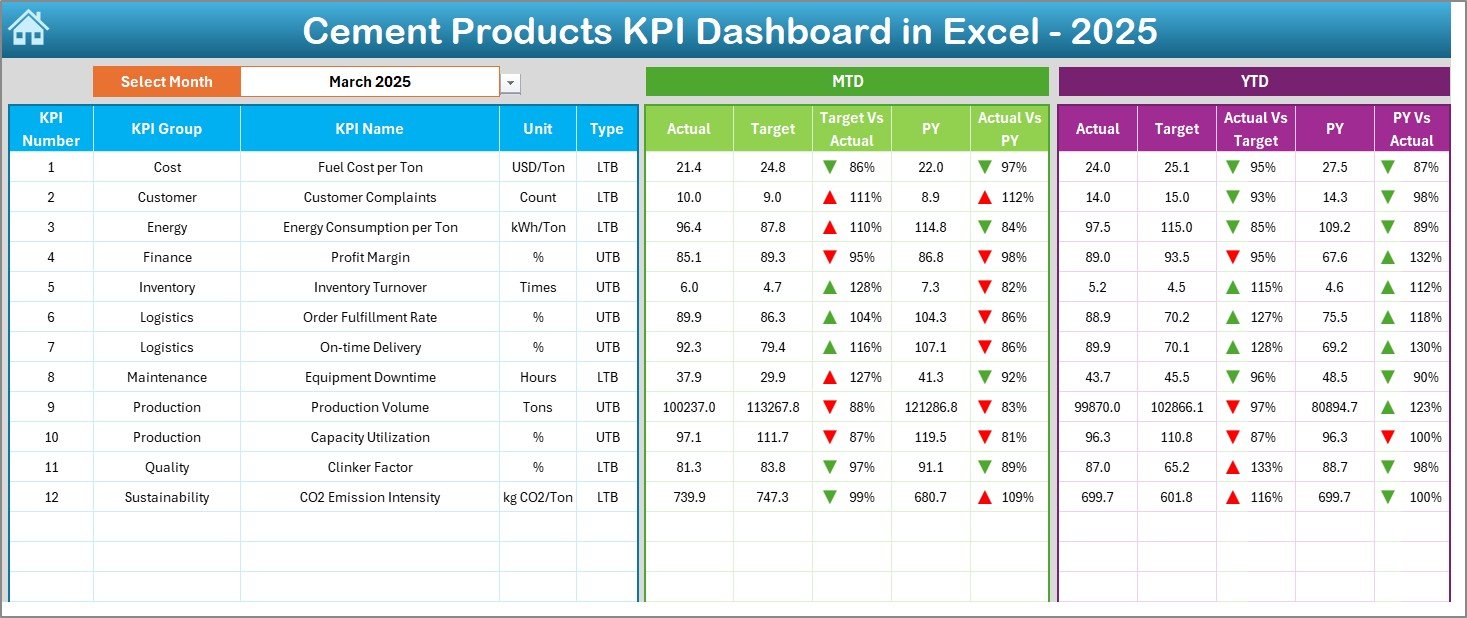
2. Dashboard Sheet – Main KPI Overview
The Dashboard Sheet serves as the core performance monitoring page.
Month Selection Feature
Users select the month from cell D3, and the entire dashboard updates automatically.
Therefore, monthly performance analysis becomes instant.
KPI Metrics Displayed
The dashboard presents:
MTD (Month-to-Date) Analysis
-
Actual performance
-
Target values
-
Previous Year data
-
Target vs Actual comparison
-
PY vs Actual comparison
YTD (Year-to-Date) Analysis
-
Actual totals
-
Target totals
-
Previous Year performance
-
Variance indicators
Conditional formatting arrows visually indicate performance trends:
-
▲ Up arrow → Improvement
-
▼ Down arrow → Decline
Thus, managers quickly understand performance status.
Click to Purchases Cement Products KPI Dashboard in Excel
3. KPI Trend Sheet – Detailed KPI Analysis
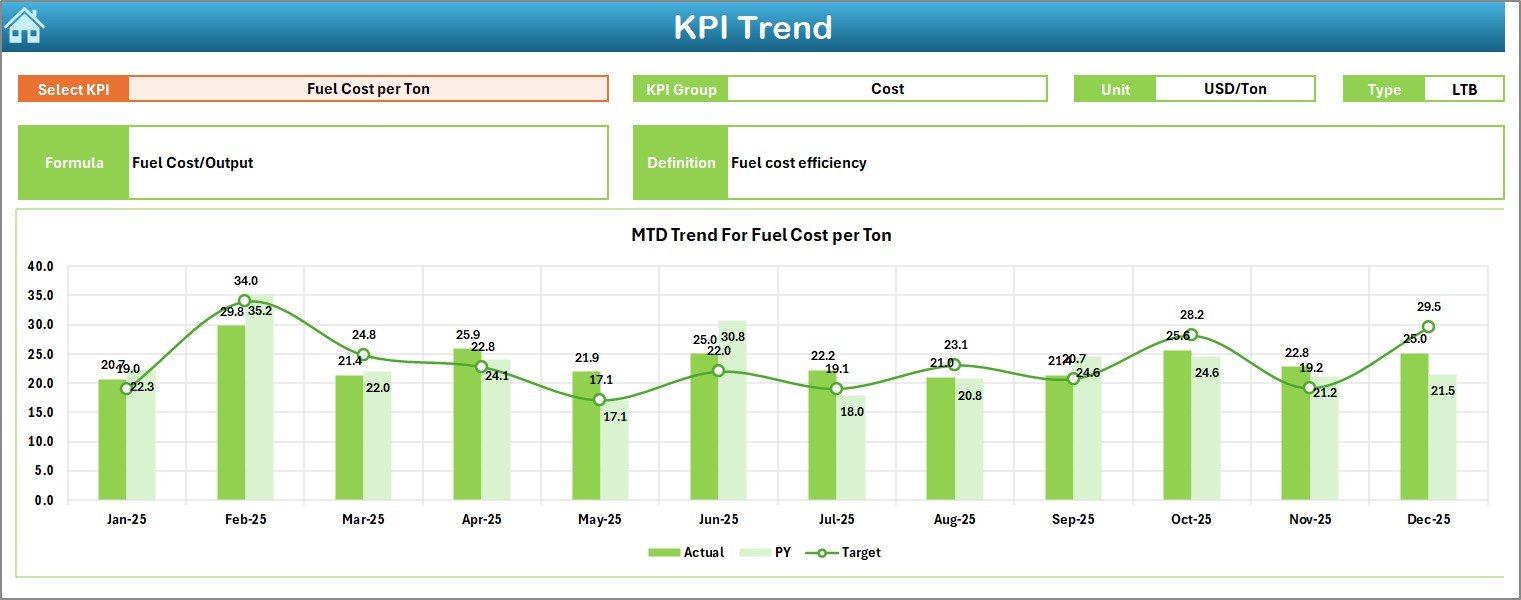
While the dashboard shows summary performance, the KPI Trend Sheet provides deeper insights.
KPI Selection
Users select a KPI from dropdown cell C3, and the dashboard updates automatically.
KPI Information Displayed
-
KPI Group
-
Unit of Measurement
-
KPI Type (Lower the Better / Upper the Better)
-
Formula
-
KPI Definition
This structure ensures transparency and consistency.
Trend Charts
The sheet displays:
-
MTD trends
-
YTD trends
-
Actual vs Target vs Previous Year comparisons
Because visual charts simplify analysis, managers can identify patterns quickly.
Click to Purchases Cement Products KPI Dashboard in Excel
4. Actual Numbers Input Sheet – Current Year Data Entry
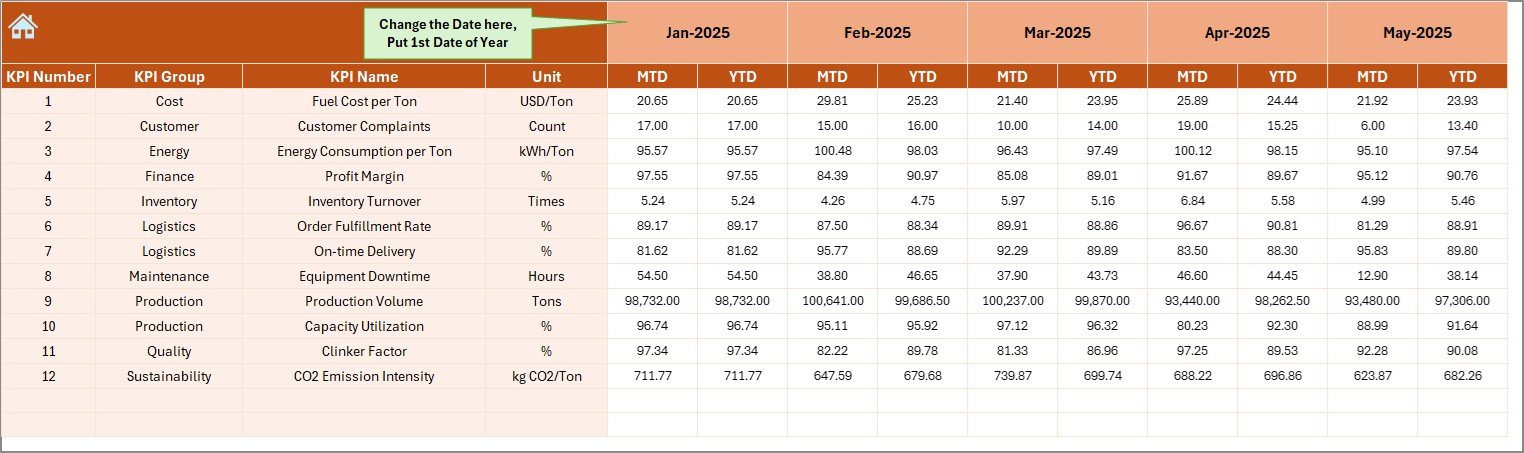
The Actual Numbers Input Sheet captures real performance data.
Key Functions
-
Enter MTD and YTD actual values
-
Change reporting month using cell E1
-
Automatic dashboard updates
Therefore, users maintain accurate and updated performance tracking.
5. Target Sheet – Performance Planning
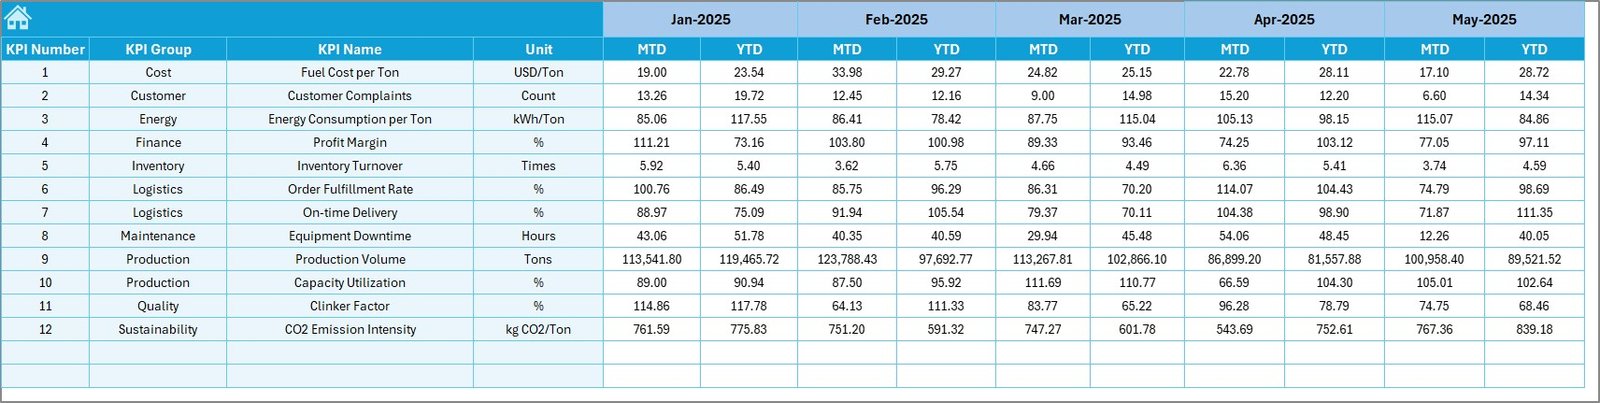
The Target Sheet stores planned KPI values.
Users Enter
-
Monthly targets
-
YTD targets for each KPI
As a result, the dashboard continuously compares goals with results.
6. Previous Year Numbers Sheet – Historical Benchmarking
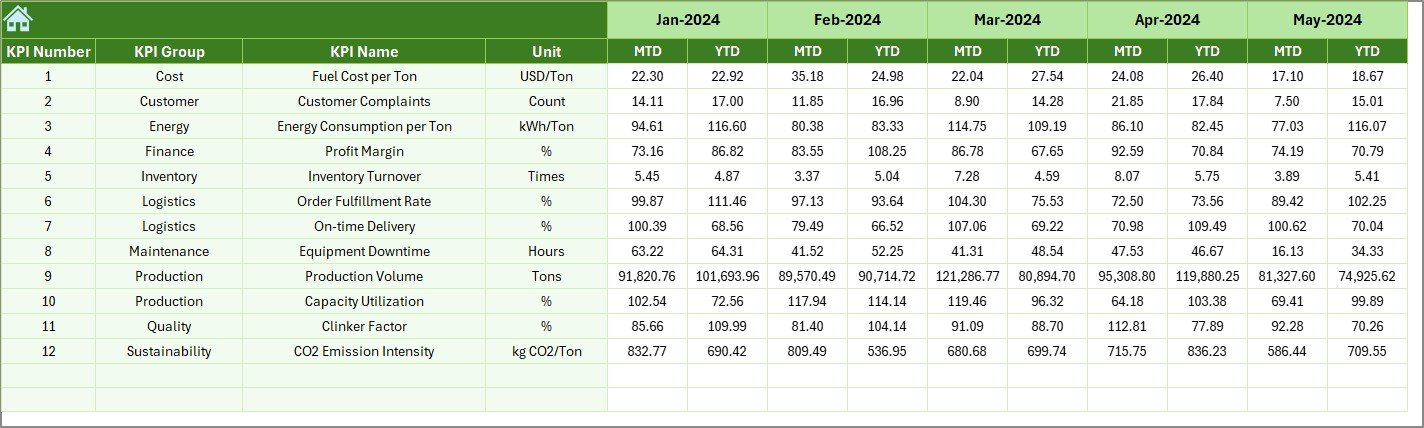
Historical data plays a major role in performance evaluation.
This sheet records previous year KPI values, allowing:
-
Year-over-year comparisons
-
Performance benchmarking
-
Growth analysis
Hence, organizations measure improvement accurately.
Click to Purchases Cement Products KPI Dashboard in Excel
7. KPI Definition Sheet – KPI Documentation Center
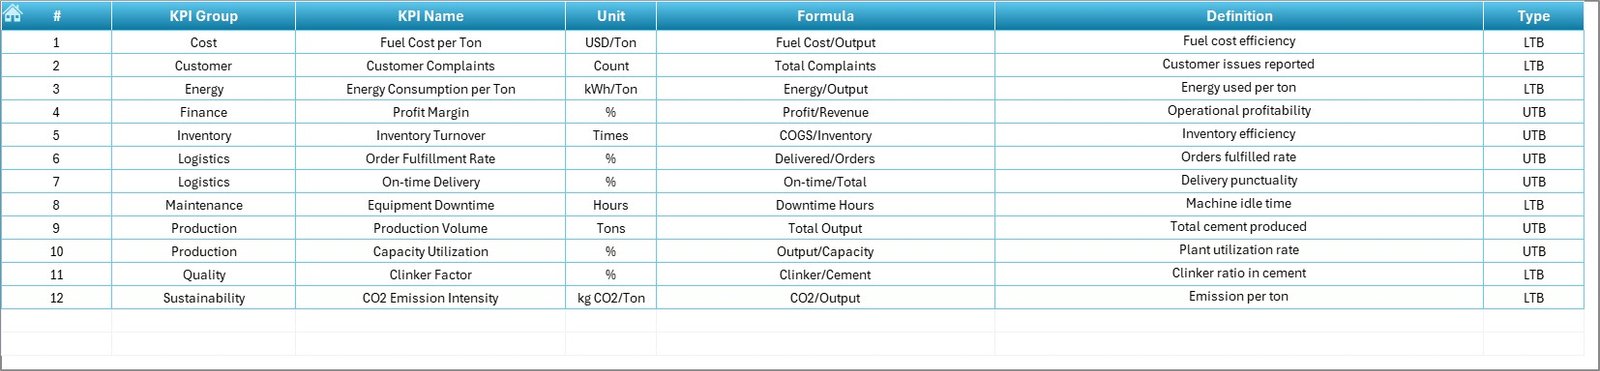
The KPI Definition Sheet standardizes KPI information.
Fields Included
-
KPI Name
-
KPI Group
-
Unit
-
Formula
-
KPI Definition
Because definitions remain centralized, teams avoid confusion in KPI interpretation.
What KPIs Can Cement Companies Track?
The dashboard supports various manufacturing and business KPIs.
Example Cement Industry KPIs
-
Production Volume (tons)
-
Plant Utilization Rate
-
Energy Consumption per Ton
-
Dispatch Efficiency
-
Inventory Turnover
-
Sales Revenue
-
Cost per Ton Produced
-
Quality Compliance Rate
-
Delivery Performance
-
Equipment Downtime
These KPIs provide a complete operational overview.
Click to Purchases Cement Products KPI Dashboard in Excel
How Does the KPI Dashboard Improve Decision-Making?
A structured dashboard transforms raw data into actionable insights.
Key Benefits
-
Faster performance reviews
-
Improved operational planning
-
Early issue detection
-
Better resource allocation
-
Increased accountability
Therefore, management decisions become data-driven rather than assumption-based.
Click to Purchases Cement Products KPI Dashboard in Excel
Advantages of Cement Products KPI Dashboard in Excel
✅ Centralized KPI Monitoring
All performance metrics appear in one place.
✅ Automated Calculations
Reduces manual effort and errors.
✅ Interactive Analysis
Month selection updates dashboard instantly.
✅ Visual Performance Indicators
Conditional formatting simplifies interpretation.
✅ Historical Comparison
Evaluate growth using previous year data.
✅ Easy Customization
Modify KPIs according to business needs.
✅ Cost-Effective Solution
No expensive BI software required.
Who Should Use This Dashboard?
The template serves multiple roles within cement organizations.
Ideal Users
-
Plant managers
-
Production supervisors
-
Operations analysts
-
Finance teams
-
Supply chain managers
-
Business executives
Thus, it supports both operational and strategic decision-making.
Click to Purchases Cement Products KPI Dashboard in Excel
Real-World Applications of Cement KPI Dashboards
Production Monitoring
Track daily and monthly output performance.
Cost Management
Identify cost deviations early.
Efficiency Improvement
Analyze plant utilization trends.
Sales Performance Tracking
Evaluate regional demand performance.
Strategic Planning
Support long-term operational decisions.
How to Use the Cement KPI Dashboard Step-by-Step?
Step 1: Define KPIs
Enter KPI details in the KPI Definition sheet.
Step 2: Enter Targets
Input monthly and yearly targets.
Step 3: Add Previous Year Data
Record historical numbers.
Step 4: Input Actual Results
Update performance values monthly.
Step 5: Select Month
Choose month from dashboard dropdown.
Step 6: Analyze Trends
Review KPI Trend sheet for insights.
Best Practices for the Cement Products KPI Dashboard
Maintain Data Accuracy
Validate data before entry.
Update Monthly
Keep dashboard current for reliable analysis.
Focus on Critical KPIs
Avoid tracking unnecessary metrics.
Standardize KPI Definitions
Ensure consistent measurement across teams.
Review Trends Regularly
Monitor performance changes early.
Backup Data Frequently
Prevent accidental data loss.
Following these practices maximizes dashboard effectiveness.
Common Mistakes to Avoid
-
Entering inconsistent units
-
Ignoring previous year comparisons
-
Updating data irregularly
-
Tracking too many KPIs
-
Misinterpreting trend indicators
Avoiding these errors improves reporting accuracy.
Click to Purchases Cement Products KPI Dashboard in Excel
Why Excel Remains Ideal for KPI Dashboards?
Although advanced analytics tools exist, Excel still offers major advantages:
-
Familiar interface
-
High flexibility
-
Easy sharing
-
Fast implementation
-
Low cost
Therefore, many manufacturing companies prefer Excel dashboards.
Future Scope of KPI Dashboards in Manufacturing
As digital transformation grows, KPI dashboards will evolve further.
Future improvements may include:
-
Power BI integration
-
Automated data imports
-
Predictive analytics
-
Cloud-based collaboration
-
AI-driven insights
Thus, Excel dashboards serve as the foundation for advanced analytics systems.
Conclusion
The Cement Products KPI Dashboard in Excel provides a structured and efficient approach to monitoring manufacturing and business performance. By combining automated calculations, interactive dashboards, and trend analysis, the template enables organizations to transform operational data into meaningful insights.
Moreover, centralized KPI monitoring improves productivity, enhances decision-making, and supports continuous improvement. Because the system remains simple and customizable, cement companies can implement it quickly and start gaining value immediately.
Ultimately, organizations that consistently track KPIs achieve higher operational efficiency and stronger business performance.
Click to Purchases Cement Products KPI Dashboard in Excel
Frequently Asked Questions (FAQs)
What is a Cement Products KPI Dashboard in Excel?
It is an Excel-based performance monitoring tool used to track manufacturing and business KPIs.
Can beginners use this dashboard?
Yes. The dashboard uses simple dropdowns and structured sheets.
Does the dashboard update automatically?
Yes. Once data changes, charts and KPIs refresh automatically.
Can I customize KPIs?
Yes. You can modify or add KPIs in the KPI Definition sheet.
What is the benefit of previous year comparison?
It helps measure growth and evaluate performance improvements.
How often should data be updated?
Organizations should update KPI data monthly.
Is this dashboard suitable for multiple plants?
Yes. Companies can customize KPIs for different locations.
Click to Purchases Cement Products KPI Dashboard in Excel
Visit our YouTube channel to learn step-by-step video tutorials


