The cement manufacturing industry operates in a data-intensive environment where production efficiency, operational performance, cost management, and quality control determine profitability. However, many organizations still struggle to analyze performance data effectively because information remains scattered across spreadsheets and reports.
Therefore, companies increasingly adopt business intelligence tools that convert raw operational data into meaningful insights. One powerful solution is the Cement Products KPI Dashboard in Power BI.
This comprehensive guide explains everything about the Cement Products KPI Dashboard in Power BI, including its structure, features, benefits, implementation process, best practices, and real-world applications. Moreover, this ready-to-use dashboard helps cement companies track KPIs dynamically and make faster data-driven decisions.
Click to Purchases Cement Products KPI Dashboard in Power BI
What Is a Cement Products KPI Dashboard in Power BI?
A Cement Products KPI Dashboard in Power BI is an interactive business intelligence solution designed to monitor key performance indicators using dynamic visuals, automated calculations, and real-time filtering.
Instead of analyzing multiple Excel reports manually, managers can view all KPI performance metrics in a centralized dashboard. Additionally, Power BI enables comparisons between targets, current performance, and previous year results.
Typically, the dashboard monitors:
-
Production efficiency KPIs
-
Operational performance metrics
-
Quality indicators
-
Cost management KPIs
-
Plant utilization performance
-
Year-over-year performance trends
Because Power BI connects directly to Excel data sources, organizations can update dashboards instantly by refreshing data.
Why Do Cement Companies Need a KPI Dashboard in Power BI?
Cement manufacturing involves complex operations across production plants, logistics networks, and sales channels. Consequently, leaders require clear performance visibility.
Challenges Without a BI Dashboard
-
Manual reporting consumes time
-
KPI comparisons become difficult
-
Performance insights arrive late
-
Trend analysis becomes limited
-
Decision-making slows down
However, Power BI dashboards solve these challenges by presenting real-time analytics visually.
Click to Purchases Cement Products KPI Dashboard in Power BI
Key Features of Cement Products KPI Dashboard in Power BI
This ready-to-use dashboard includes three interactive pages inside the Power BI Desktop application.
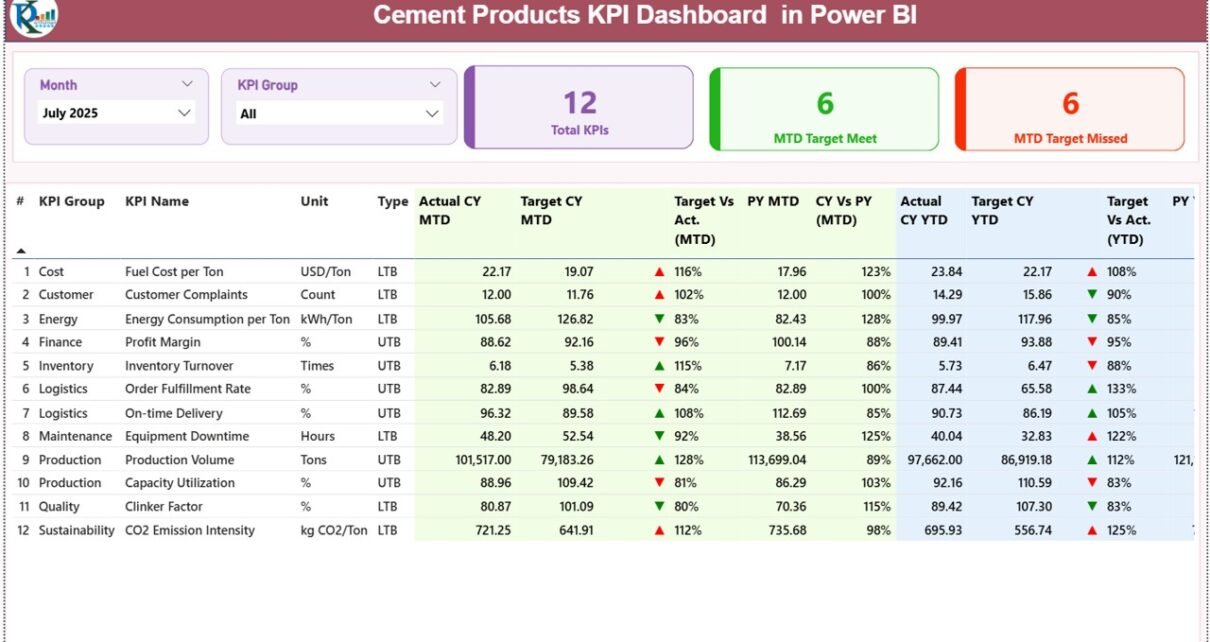
1. Summary Page – Central KPI Monitoring Hub
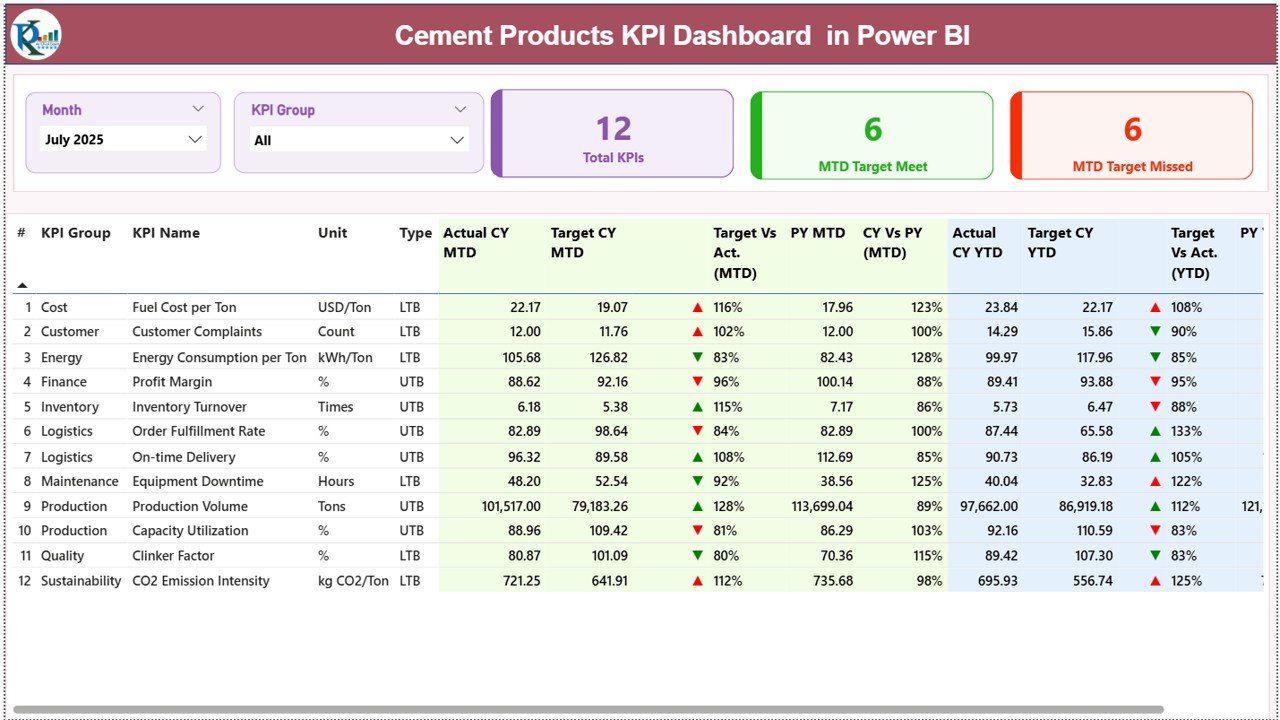
The Summary Page acts as the main interface where users analyze overall KPI performance.
Interactive Slicers
At the top of the dashboard, users can filter data using:
-
Month slicer
-
KPI Group slicer
Therefore, managers can instantly analyze performance for specific periods or KPI categories.
KPI Performance Cards
The dashboard displays three key cards:
-
Total KPIs Count
-
MTD Target Meet Count
-
MTD Target Missed Count
These indicators provide a quick performance overview.
Detailed KPI Performance Table
Below the cards, a comprehensive table presents KPI-level information.
KPI Information Displayed
-
KPI Number – Sequence identifier
-
KPI Group – KPI category
-
KPI Name – Performance metric name
-
Unit – Measurement unit
-
Type – LTB (Lower the Better) or UTB (Upper the Better)
MTD Performance Metrics
The dashboard includes:
-
Actual CY MTD
-
Target CY MTD
-
MTD Status Icons (▲ Green / ▼ Red)
-
Target vs Actual (MTD %)
-
Previous Year MTD
-
CY vs PY Comparison (MTD %)
These metrics help managers evaluate short-term performance instantly.
YTD Performance Metrics
Similarly, Year-to-Date analysis includes:
-
Actual CY YTD
-
Target CY YTD
-
YTD Status Icons
-
Target vs Actual (YTD %)
-
Previous Year YTD
-
CY vs PY Comparison (YTD %)
Because both MTD and YTD appear together, users gain complete performance visibility.
Click to Purchases Cement Products KPI Dashboard in Power BI
2. KPI Trend Page – Performance Trend Analysis
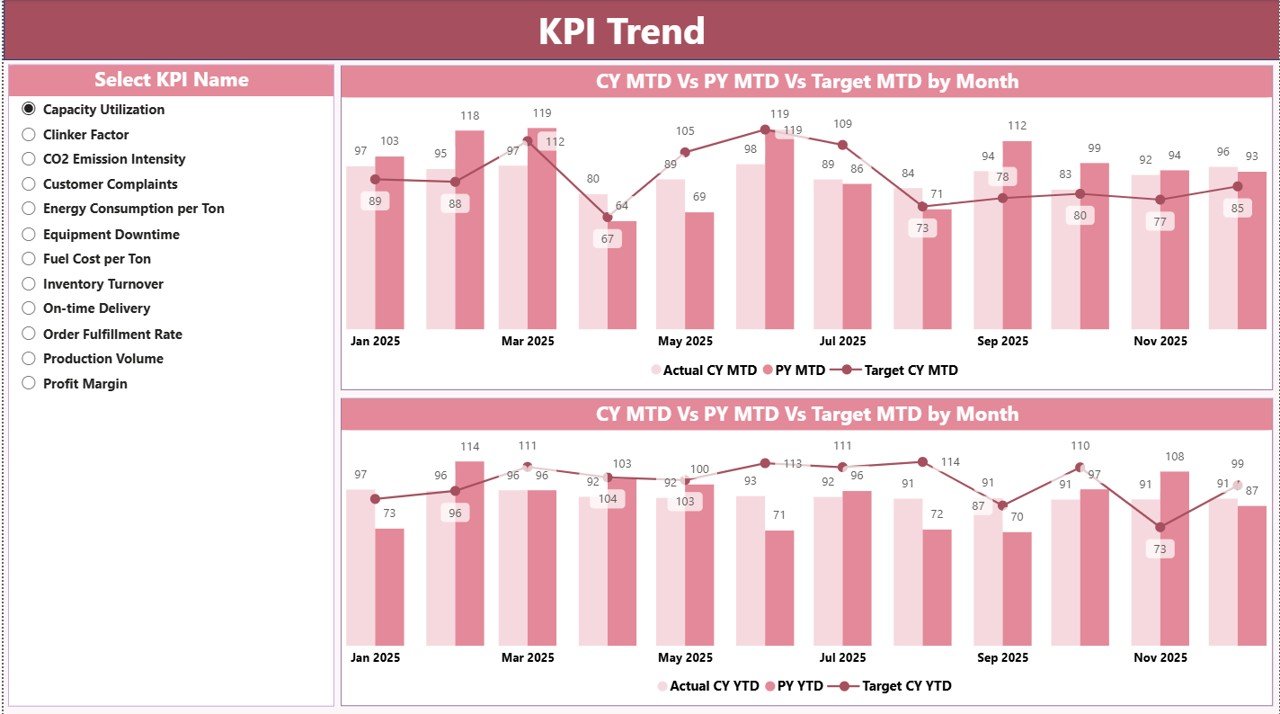
While the summary page provides an overview, the KPI Trend Page focuses on detailed performance trends.
KPI Selection Slicer
Users select a KPI from the slicer on the left side. Consequently, charts update automatically.
Combo Charts Included
Two combo charts display:
-
Current Year Actual values
-
Previous Year performance
-
Target values
Charts exist for both:
-
MTD trends
-
YTD trends
Therefore, users easily identify performance improvements or declines over time.
3. KPI Definition Page – Drill-Through KPI Details
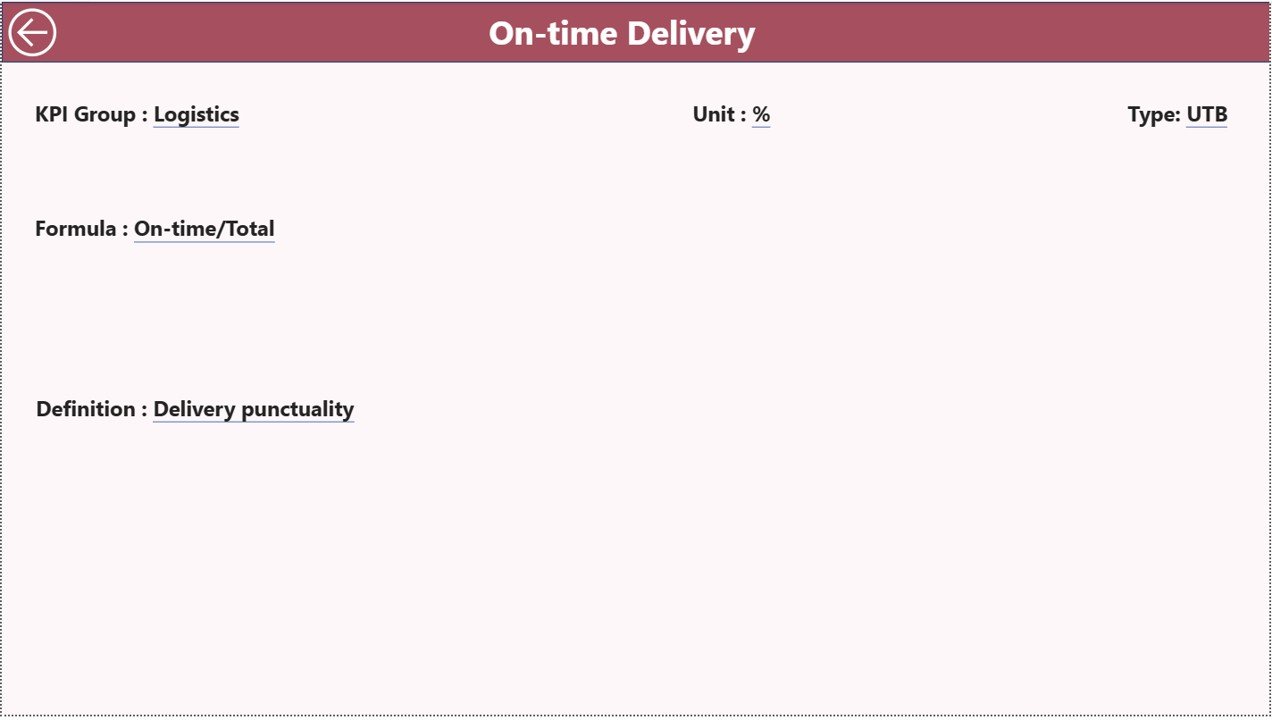
The KPI Definition Page works as a drill-through page and remains hidden during normal navigation.
Information Available
When users drill through from the summary page, they can view:
-
KPI Formula
-
KPI Definition
-
KPI Classification
-
Measurement logic
A back button allows users to return to the main dashboard easily.
This feature improves KPI transparency across teams.
Click to Purchases Cement Products KPI Dashboard in Power BI
Excel Data Source Structure
The dashboard connects to an Excel file that serves as the data source.
Users only need to update Excel sheets, and Power BI refreshes automatically.
1. Input_Actual Sheet
Users enter:
-
KPI Name
-
Month (first date of month)
-
MTD Actual values
-
YTD Actual values
2. Input_Target Sheet
Users record:
-
KPI Name
-
Month
-
Target MTD values
-
Target YTD values
This enables automatic performance comparison.
3. KPI Definition Sheet
Users define KPI metadata:
-
KPI Number
-
KPI Group
-
KPI Name
-
Unit
-
Formula
-
Definition
-
Type (LTB or UTB)
Because KPI definitions remain centralized, reporting stays standardized.
How Does Power BI Improve Cement Performance Monitoring?
Power BI transforms static reporting into interactive analytics.
Key Improvements
-
Real-time KPI visibility
-
Faster performance analysis
-
Interactive filtering
-
Automated calculations
-
Visual trend identification
Therefore, leaders make decisions based on live insights instead of outdated reports.
Click to Purchases Cement Products KPI Dashboard in Power BI
Advantages of Cement Products KPI Dashboard in Power BI
✅ Interactive Analytics
Users explore data dynamically using slicers.
✅ Real-Time Performance Tracking
Dashboard updates instantly after data refresh.
✅ Visual KPI Status Indicators
Icons clearly show performance results.
✅ Historical Comparison
Analyze growth using previous year data.
✅ Centralized Reporting
All KPIs remain in one dashboard.
✅ Drill-Through Analysis
Access detailed KPI explanations instantly.
✅ Scalable Solution
Supports multi-plant operations.
Who Should Use This Dashboard?
The dashboard benefits multiple roles within cement organizations.
Ideal Users
-
Plant managers
-
Operations executives
-
Production analysts
-
Finance teams
-
Supply chain managers
-
Business intelligence teams
Thus, both operational and strategic users gain value.
Click to Purchases Cement Products KPI Dashboard in Power BI
Real-World Applications of Cement KPI Dashboards
Production Monitoring
Track plant performance continuously.
Performance Review Meetings
Use dashboard visuals during management reviews.
Cost Optimization
Identify inefficiencies early.
Strategic Planning
Evaluate long-term performance trends.
Benchmark Analysis
Compare current results with previous year performance.
How to Use the Cement Products KPI Dashboard Step-by-Step?
Step 1: Update Excel Data
Enter actual and target numbers.
Step 2: Maintain KPI Definitions
Ensure KPI information stays accurate.
Step 3: Refresh Power BI Dataset
Update dashboard visuals instantly.
Step 4: Apply Filters
Select month or KPI group.
Step 5: Analyze Trends
Use KPI Trend page for deeper insights.
Step 6: Drill Through for Details
Review KPI formulas and definitions.
Click to Purchases Cement Products KPI Dashboard in Power BI
Best Practices for the Cement Products KPI Dashboard in Power BI
Maintain Clean Data Structure
Ensure consistent KPI names.
Update Data Monthly
Keep analysis current.
Use Standard KPI Definitions
Avoid misinterpretation.
Monitor Both MTD and YTD
Balance short-term and long-term analysis.
Review KPI Trends Regularly
Identify issues early.
Limit Unnecessary KPIs
Focus on actionable metrics.
Common Mistakes to Avoid
-
Incorrect month formatting
-
Missing target values
-
Inconsistent KPI naming
-
Ignoring trend analysis
-
Not refreshing dashboard regularly
Avoiding these mistakes ensures accurate insights.
Click to Purchases Cement Products KPI Dashboard in Power BI
Why Power BI Is Ideal for Manufacturing KPI Dashboards?
Power BI offers advanced capabilities compared to traditional reporting.
Key Advantages
-
Interactive visuals
-
Automated data modeling
-
Strong Excel integration
-
Scalable analytics
-
Professional reporting environment
Therefore, manufacturing companies increasingly adopt Power BI dashboards.
Future Scope of KPI Dashboards in Cement Manufacturing
Digital transformation continues to reshape manufacturing analytics.
Future enhancements may include:
-
IoT data integration
-
Predictive maintenance analytics
-
AI-driven KPI forecasting
-
Cloud-based collaboration
-
Real-time plant monitoring
Thus, KPI dashboards will become central to smart manufacturing.
Conclusion
The Cement Products KPI Dashboard in Power BI provides a powerful and modern solution for monitoring cement industry performance. By combining Excel data sources with interactive Power BI visuals, organizations gain real-time insights into operational and business KPIs.
Moreover, the dashboard improves transparency, enhances decision-making, and supports continuous improvement. Because the system remains scalable and user-friendly, cement companies can quickly adopt it and achieve measurable performance improvements.
Ultimately, organizations that leverage KPI dashboards effectively gain a competitive advantage through data-driven management.
Click to Purchases Cement Products KPI Dashboard in Power BI
Frequently Asked Questions (FAQs)
What is a Cement Products KPI Dashboard in Power BI?
It is an interactive dashboard used to monitor manufacturing KPIs using Power BI visuals and analytics.
Does the dashboard require manual reporting?
No. Users only update Excel data and refresh Power BI.
What does LTB and UTB mean?
LTB means Lower the Better, while UTB means Upper the Better.
Can I customize KPIs?
Yes. KPI definitions can be modified in the Excel source file.
How often should data be refreshed?
Organizations typically refresh data monthly or weekly.
Can beginners use this dashboard?
Yes. Basic Power BI knowledge is sufficient.
Is this dashboard suitable for multiple plants?
Yes. It can scale to monitor multiple manufacturing locations.
Click to Purchases Cement Products KPI Dashboard in Power BI
Visit our YouTube channel to learn step-by-step video tutorials