The heavy vehicle manufacturing industry operates in a highly competitive and performance-driven environment. Companies that assemble trucks, buses, construction equipment, and industrial vehicles must manage production efficiency, quality standards, delivery timelines, labor productivity, and operational costs simultaneously. However, many organizations still rely on scattered Excel sheets and manual reporting systems. As a result, decision-makers often struggle to identify performance gaps quickly.
Therefore, manufacturers increasingly adopt modern business intelligence tools to monitor operations in real time. One of the most powerful solutions available today is the Heavy Vehicle Assembly KPI Dashboard in Power BI.
Click to Purchases Heavy Vehicle Assembly KPI Dashboard in Power BI
This ready-to-use dashboard transforms raw operational data into meaningful insights. Instead of reviewing multiple reports separately, managers can track all key performance indicators (KPIs) through interactive visuals and automated analytics. Consequently, teams make faster decisions, improve assembly performance, and achieve operational excellence.
In this comprehensive guide, you will learn everything about the Heavy Vehicle Assembly KPI Dashboard in Power BI, including its structure, features, benefits, implementation steps, best practices, and frequently asked questions.
What Is a Heavy Vehicle Assembly KPI Dashboard in Power BI?
A Heavy Vehicle Assembly KPI Dashboard in Power BI is an interactive analytics solution designed to monitor assembly line performance using visual reports and automated calculations.
It collects production and performance data from an Excel source file and converts it into dynamic dashboards. As soon as users update the data, Power BI automatically refreshes visuals. Therefore, managers always work with updated information.
This dashboard helps organizations track:
-
Assembly productivity
-
Target achievement
-
Year-over-year performance
-
Quality indicators
-
Production efficiency
-
Operational trends
Moreover, the dashboard simplifies complex manufacturing data into easy-to-understand visuals. Because of this, even non-technical users can analyze performance without advanced analytics knowledge.
Why Is KPI Tracking Important in Heavy Vehicle Assembly?
Heavy vehicle assembly involves multiple stages such as chassis preparation, component installation, engine integration, testing, and final inspection. Each stage directly impacts production output and profitability.
Without structured KPI monitoring:
-
Production delays increase.
-
Quality issues remain unnoticed.
-
Targets become difficult to achieve.
-
Decision-making slows down.
On the other hand, KPI dashboards provide clarity. They allow managers to identify problems early and take corrective actions immediately.
Key Reasons KPI Dashboards Matter
-
Improve operational transparency
-
Monitor production efficiency continuously
-
Compare performance against targets
-
Track historical trends
-
Support data-driven decision making
Therefore, organizations that adopt KPI dashboards gain a strong competitive advantage.
Click to Purchases Heavy Vehicle Assembly KPI Dashboard in Power BI
Overview of the Heavy Vehicle Assembly KPI Dashboard in Power BI
This dashboard is a ready-to-use Power BI solution that captures data through Excel and presents insights across multiple interactive pages.
The dashboard contains three main pages:
-
Summary Page
-
KPI Trend Page
-
KPI Definition (Drill-Through Page)
Each page serves a specific analytical purpose. Together, they provide complete visibility into assembly performance.
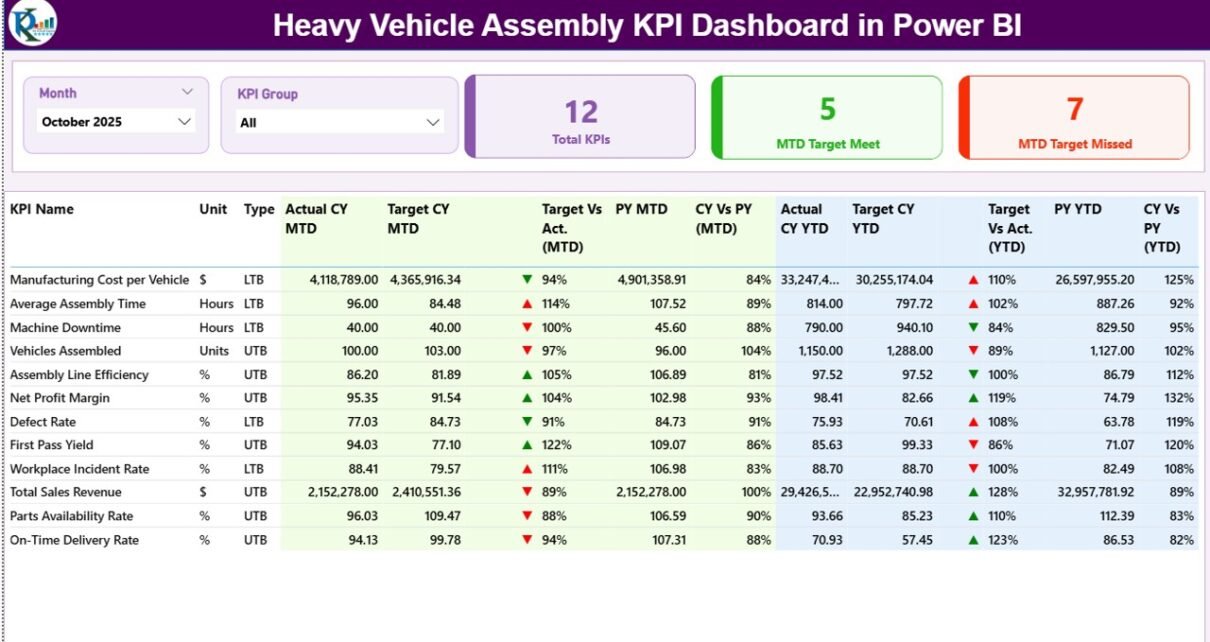
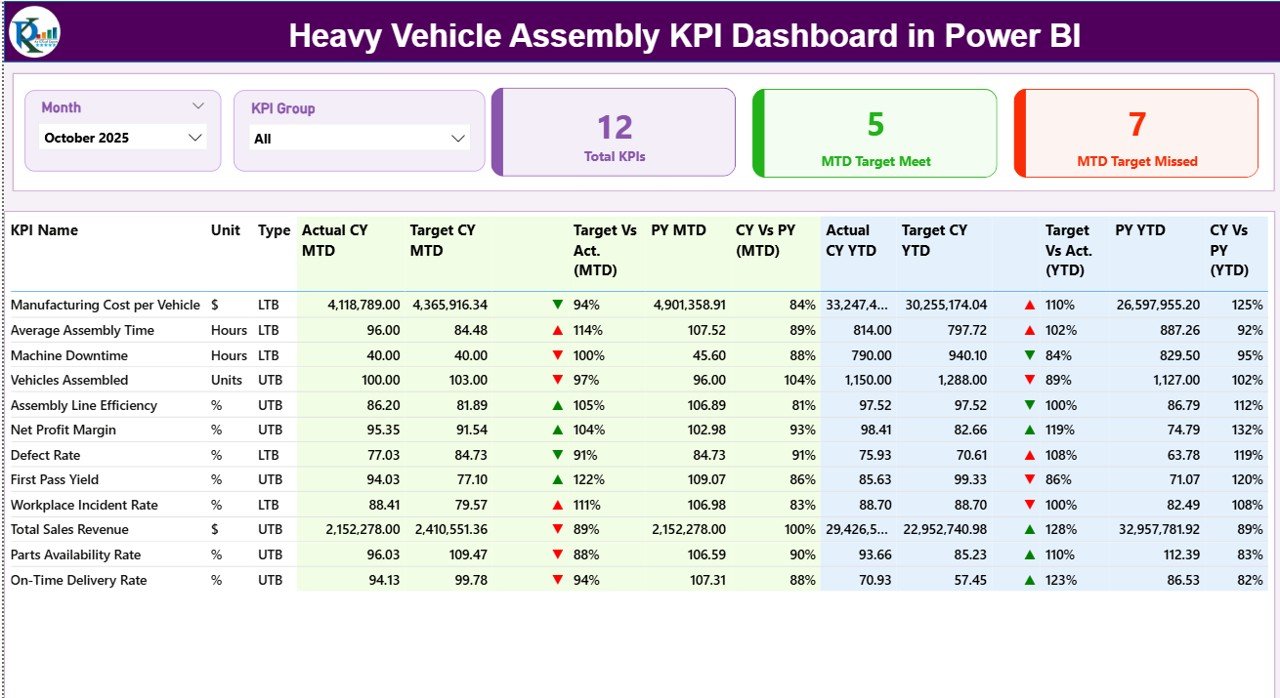
What Does the Summary Page Show?
The Summary Page acts as the central control panel of the dashboard. Users can quickly understand overall KPI performance without navigating multiple reports.
Interactive Filters
At the top of the page, users find:
-
Month slicer – Select any month instantly.
-
KPI Group slicer – Filter performance by category.
Because of these slicers, users analyze performance dynamically.
KPI Performance Cards
The dashboard displays three key cards:
-
Total KPIs Count
-
MTD Target Meet Count
-
MTD Target Missed Count
These cards immediately show performance status. Therefore, managers recognize whether operations remain on track.
Detailed KPI Table Explained
Below the cards, a detailed performance table displays comprehensive KPI information.
KPI Information Fields
-
KPI Number – Sequential identifier.
-
KPI Group – Performance category.
-
KPI Name – Specific measurement.
-
Unit – Measurement unit.
-
Type –
-
LTB (Lower the Better)
-
UTB (Upper the Better)
-
Monthly Performance Metrics (MTD)
The dashboard tracks Month-to-Date performance using:
-
Actual CY MTD
-
Target CY MTD
-
MTD Status Icons (▲ Green / ▼ Red)
-
Target vs Actual Percentage
-
Previous Year MTD
-
Current Year vs Previous Year Comparison
Because icons visually highlight performance, users quickly identify underperforming KPIs.
Yearly Performance Metrics (YTD)
Similarly, the dashboard displays Year-to-Date analysis:
-
Actual CY YTD
-
Target CY YTD
-
YTD Status Indicators
-
Target vs Actual (YTD)
-
Previous Year YTD
-
CY vs PY Comparison
As a result, managers evaluate both short-term and long-term performance simultaneously.
Click to Purchases Heavy Vehicle Assembly KPI Dashboard in Power BI
How Does the KPI Trend Page Help Analysis?
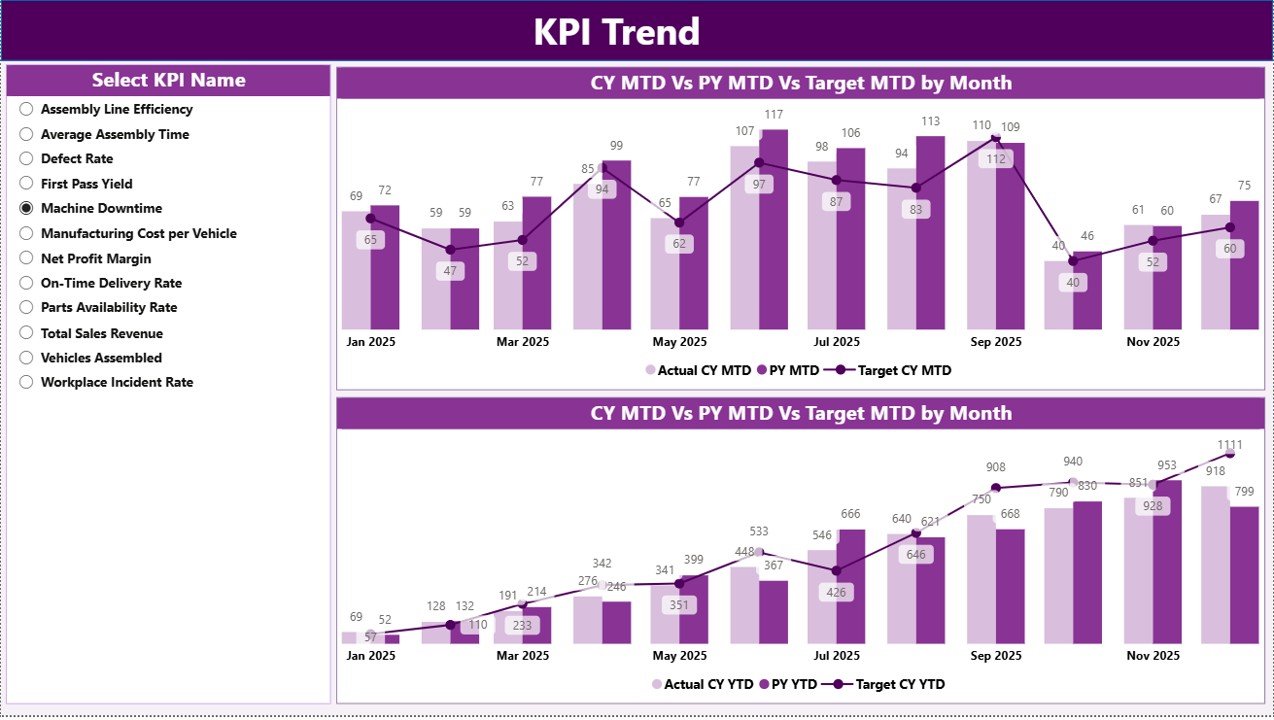
While the summary page shows current performance, the KPI Trend Page focuses on historical analysis.
Key Features of the Trend Page
-
KPI selection slicer on the left
-
Two combo charts
-
Comparison of:
-
Current Year Actual
-
Previous Year Actual
-
Target values
-
Why Trend Analysis Matters
Trend analysis answers important operational questions:
-
Is productivity improving?
-
Are targets realistic?
-
Does performance fluctuate seasonally?
Therefore, managers gain deeper insights beyond monthly numbers.
What Is the KPI Definition Drill-Through Page?
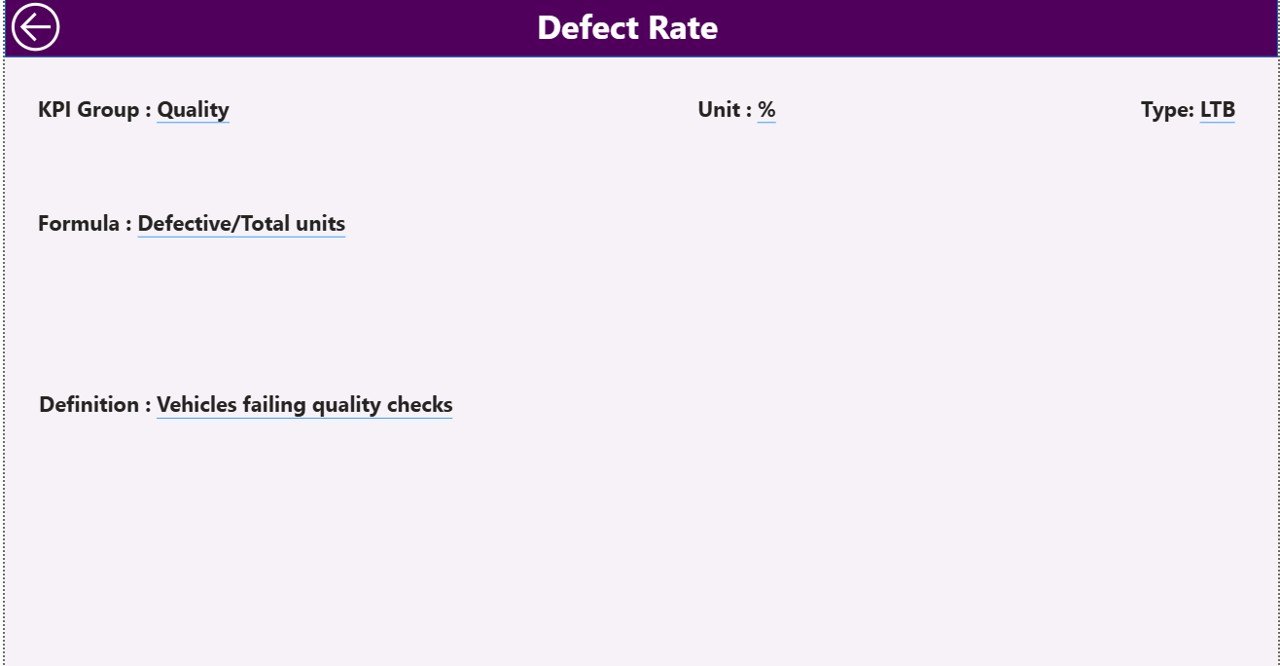
The KPI Definition Page works as a hidden drill-through page.
Users can navigate from the summary page to view detailed KPI information such as:
-
KPI Formula
-
KPI Definition
-
Measurement logic
-
KPI Type
A back button allows users to return instantly to the main dashboard.
Because of this feature, organizations maintain transparency and consistency in KPI interpretation.
How Does the Excel Data Source Work?
The dashboard uses an Excel file as its data source. This approach makes implementation simple and flexible.
The Excel file contains three worksheets.
1. Input_Actual Sheet
Users enter:
-
KPI Name
-
Month (first date of month)
-
MTD values
-
YTD values
Once updated, Power BI reflects changes automatically.
2. Input_Target Sheet
This sheet stores target values:
-
KPI Name
-
Month
-
MTD Target
-
YTD Target
Therefore, the dashboard compares performance against goals.
Click to Purchases Heavy Vehicle Assembly KPI Dashboard in Power BI
3. KPI Definition Sheet
This sheet defines KPI structure:
-
KPI Number
-
KPI Group
-
KPI Name
-
Unit
-
Formula
-
Definition
-
Type (LTB / UTB)
Because definitions remain centralized, reporting becomes standardized.
Advantages of Heavy Vehicle Assembly KPI Dashboard in Power BI
Organizations gain multiple operational and strategic benefits.
🚀 Improved Decision Making
Managers access real-time insights, which helps them act quickly.
📊 Centralized Performance Monitoring
All KPIs appear in one dashboard instead of multiple reports.
⏱ Faster Reporting
Automation reduces manual calculations and reporting delays.
🎯 Better Target Tracking
Visual indicators clearly show achievement status.
📈 Trend Visibility
Historical comparisons support strategic planning.
🔍 Increased Transparency
Standard KPI definitions eliminate confusion.
💰 Cost Optimization
Early problem detection prevents operational losses.
How Does This Dashboard Improve Manufacturing Performance?
The dashboard connects operational data with business outcomes.
For example:
-
Production delays become visible immediately.
-
Quality issues appear through KPI deviations.
-
Managers adjust workflows faster.
-
Teams align with production targets.
Consequently, assembly efficiency improves continuously.
Best Practices for the Heavy Vehicle Assembly KPI Dashboard in Power BI
To achieve maximum value, organizations should follow proven practices.
1. Define KPIs Clearly
Always document formulas and definitions before implementation.
2. Update Data Regularly
Daily or weekly updates ensure accurate insights.
3. Use Meaningful KPI Groups
Group KPIs into categories such as:
-
Production
-
Quality
-
Efficiency
-
Safety
-
Delivery
4. Monitor Both MTD and YTD
Short-term and long-term views provide balanced analysis.
5. Validate Data Accuracy
Incorrect data leads to incorrect decisions.
6. Train Users Properly
Ensure managers understand slicers and drill-through features.
7. Review KPIs Periodically
Business goals change; KPIs should evolve accordingly.
How to Implement the Dashboard Step by Step?
Step 1: Prepare KPI Structure
Define KPIs relevant to heavy vehicle assembly operations.
Step 2: Populate KPI Definition Sheet
Enter formulas and KPI types.
Step 3: Input Actual Data
Fill monthly performance values.
Step 4: Enter Targets
Add benchmark values in the target sheet.
Step 5: Refresh Power BI
Update visuals instantly.
Step 6: Analyze Performance
Use slicers and trend charts for insights.
Common KPIs Used in Heavy Vehicle Assembly
Organizations typically track:
-
Assembly Cycle Time
-
Production Output
-
Defect Rate
-
Rework Percentage
-
Labor Productivity
-
Downtime Hours
-
On-Time Delivery Rate
-
First Pass Yield
-
Equipment Utilization
-
Safety Incident Rate
These KPIs collectively measure operational success.
Why Choose Power BI for Manufacturing KPI Dashboards?
Power BI offers several advantages compared to traditional reporting tools.
-
Interactive visualizations
-
Automatic data refresh
-
Drill-through analytics
-
Scalable reporting
-
Easy Excel integration
-
User-friendly interface
Therefore, manufacturers adopt Power BI as their primary analytics platform.
Challenges Without a KPI Dashboard
Click to Purchases Heavy Vehicle Assembly KPI Dashboard in Power BI
Organizations that avoid structured dashboards often face:
-
Delayed reporting
-
Manual errors
-
Poor visibility
-
Slow decision cycles
-
Inconsistent KPI definitions
However, a centralized dashboard eliminates these issues effectively.
Future of KPI Dashboards in Heavy Vehicle Manufacturing
Manufacturing analytics continues to evolve rapidly.
In the future, dashboards will include:
-
AI-based predictions
-
Real-time IoT integration
-
Automated alerts
-
Predictive maintenance analytics
Therefore, adopting KPI dashboards today prepares organizations for smart manufacturing.
Conclusion
The Heavy Vehicle Assembly KPI Dashboard in Power BI provides a powerful and practical solution for monitoring manufacturing performance. It combines structured Excel data with interactive analytics, allowing organizations to track KPIs efficiently.
Because the dashboard delivers real-time insights, managers improve decision-making, enhance productivity, and achieve operational goals faster. Moreover, visual indicators and trend analysis simplify complex manufacturing data into actionable intelligence.
As manufacturing becomes increasingly data-driven, organizations that adopt KPI dashboards position themselves for sustainable growth and operational excellence.
Frequently Asked Questions (FAQs)
1. What is a KPI dashboard in heavy vehicle assembly?
A KPI dashboard is a visual reporting tool that tracks production performance indicators using interactive analytics.
2. Why use Power BI for KPI dashboards?
Power BI provides automation, interactive visuals, and real-time analysis capabilities.
3. Can beginners use this dashboard?
Yes. The dashboard uses Excel as a data source, so users only need basic Excel knowledge.
4. How often should data be updated?
Organizations should update data monthly or weekly depending on reporting needs.
5. What does LTB and UTB mean?
LTB means Lower the Better, while UTB means Upper the Better.
6. Can I customize KPIs?
Yes. Users can modify KPI definitions and targets easily through Excel.
7. Does the dashboard support historical comparison?
Yes. It compares current performance with previous year data.
8. Is this dashboard suitable for all manufacturing industries?
Although designed for heavy vehicle assembly, organizations can adapt it to other manufacturing sectors.
Visit our YouTube channel to learn step-by-step video tutorials