In today’s fast-moving financial markets, commodities trading requires speed, accuracy, and data-driven decision-making. Traders, brokers, and financial analysts continuously monitor trade values, brokerage costs, settlement status, and profit & loss performance. However, many organizations still rely on scattered spreadsheets and manual reports. As a result, they struggle to track trading performance efficiently.
Therefore, businesses increasingly adopt structured dashboards that transform raw trading data into meaningful insights. One powerful solution is the Commodities Trading Dashboard in Excel — a ready-to-use analytical system designed to monitor and analyze commodity trading performance through interactive visual reporting.
Click to Purchases Commodities Trading Dashboard in Excel
In this comprehensive article, you will learn everything about the Commodities Trading Dashboard in Excel, including its features, structure, advantages, implementation strategy, best practices, and frequently asked questions.
What Is a Commodities Trading Dashboard in Excel?
A Commodities Trading Dashboard in Excel is an interactive reporting tool that helps traders and organizations analyze commodity transactions using structured data visualization.
Instead of reviewing long trade reports manually, users can instantly understand:
-
Trade performance
-
Brokerage expenses
-
Settlement progress
-
Profit and loss trends
-
Regional and counterparty analysis
Because Excel remains one of the most widely used business tools, companies can implement this dashboard quickly without investing in expensive software.
Moreover, the dashboard converts trading data into charts, KPI cards, and dynamic comparisons, which makes decision-making faster and more accurate.
Why Do Commodity Traders Need a Trading Dashboard?
Commodity markets operate with high volatility. Consequently, traders must monitor performance continuously. Without a centralized dashboard, teams often face several challenges:
-
Data scattered across multiple files
-
Delayed reporting
-
Limited visibility into trade profitability
-
Difficulty tracking settlement progress
-
Manual calculation errors
However, a structured Excel dashboard solves these issues by providing real-time analytical visibility.
Additionally, decision-makers gain clarity about trading outcomes, which helps them optimize strategies and reduce risks.
Key Features of the Commodities Trading Dashboard in Excel
The Commodities Trading Dashboard in Excel is a ready-to-use solution built within the Excel desktop application. It includes multiple analytical pages connected through a smart navigation system.
Page Navigator
Located on the left side, the Page Navigator allows users to switch easily between analytical pages. Therefore, users can explore insights without searching through worksheets manually.
This improves workflow efficiency and enhances the user experience.
Dashboard Structure – What Pages Are Included?
The dashboard contains five analytical pages along with supporting data sheets.
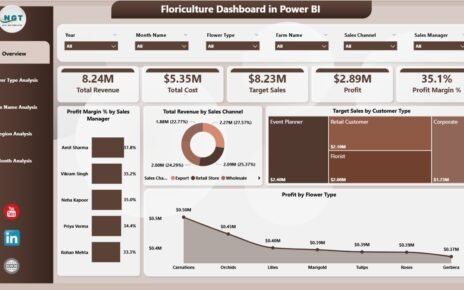
1. Overview Page – The Central Trading Control Panel

The Overview Page acts as the main dashboard where users get a complete snapshot of trading performance.
Key Elements:
-
Right-side slicers for filtering data
-
Four KPI cards for quick insights
-
Interactive charts
Charts Included:
-
Total Trade by Contract Type
-
In-Progress Settlement %
-
Total Trade by Exchange
-
Brokerage by Trader Name
Because all major metrics appear in one place, traders quickly understand overall performance.
Furthermore, slicers allow instant filtering by trading dimensions, which improves analysis speed.
2. Counterparty Analysis – Who Drives Trading Performance?

Counterparties play a critical role in commodity trading success. Therefore, this page focuses on analyzing trading relationships.
Charts Included:
-
Quantity (Tons) by Counterparty
-
Trade Value by Counterparty
-
Brokerage by Counterparty
-
Profit & Loss (PnL) by Counterparty
With this analysis, organizations can identify:
-
High-value counterparties
-
Risk exposure levels
-
Most profitable trading partners
As a result, traders can strengthen profitable relationships while managing risky ones.
3. Contract Type Analysis – Which Contracts Perform Best?

Commodity trades often involve different contract types such as futures, spot, or forward contracts. Hence, performance analysis by contract type becomes essential.
Charts Included:
-
Trade Value by Contract Type
-
Brokerage by Contract Type
-
PnL by Contract Type
-
In-Process Settlement % by Contract Type
This page helps traders evaluate which contract structures deliver better returns.
Additionally, users can optimize contract strategies based on performance trends.
Click to Purchases Commodities Trading Dashboard in Excel
4. Region Analysis – Where Does Profit Come From?

Geographical performance matters significantly in global commodities trading. Therefore, this page analyzes trading performance by region.
Charts Included:
-
Trade Value by Region
-
Brokerage by Region
-
PnL by Region
-
In-Process Settlement % by Region
Because regional markets behave differently, traders can compare profitability across locations and adjust strategies accordingly.
5. Month Analysis – How Does Performance Change Over Time?

Trading performance changes throughout the year due to market cycles and seasonal demand.
Charts Included:
-
Trade Value by Month
-
Brokerage by Month
-
Total Trade by Month
This analysis enables users to:
-
Identify seasonal trends
-
Monitor trading growth
-
Forecast future performance
Consequently, traders make proactive decisions instead of reactive ones.
Supporting Sheets in the Dashboard
Click to Purchases Commodities Trading Dashboard in Excel
Support Sheet
The Support Sheet stores backend calculations and reference data required for dashboard functionality.
It ensures smooth automation and accurate reporting.
Data Sheet
The Data Sheet acts as the primary data input area.
Users can:
-
Enter trade transactions
-
Update brokerage details
-
Record settlement status
-
Maintain trading records
Once data updates, the dashboard automatically refreshes insights.
How Does the Commodities Trading Dashboard Improve Decision-Making?
A trading dashboard transforms raw numbers into actionable intelligence.
Key Decision Benefits
-
Faster trade evaluation
-
Clear profitability tracking
-
Improved settlement monitoring
-
Better brokerage cost control
-
Data-driven trading strategies
Moreover, visual analytics eliminate guesswork and increase confidence in decisions.
Advantages of Commodities Trading Dashboard in Excel
Using this dashboard provides several operational and strategic advantages.
✅ Centralized Data Management
-
Stores all trading information in one place
-
Eliminates multiple spreadsheets
✅ Real-Time Performance Monitoring
-
Instantly view trading outcomes
-
Quickly identify losses or gains
✅ Improved Profitability Analysis
-
Tracks PnL across regions and counterparties
-
Supports smarter trading decisions
✅ Easy Customization
-
Modify charts and KPIs easily
-
Adapt dashboard to business needs
✅ Cost-Effective Solution
-
Uses Microsoft Excel
-
No additional software required
✅ User-Friendly Interface
-
Navigation buttons simplify usage
-
Visual charts improve understanding
How to Use the Commodities Trading Dashboard in Excel?
Click to Purchases Commodities Trading Dashboard in Excel
Implementing the dashboard requires only a few simple steps.
Step 1: Enter Trading Data
Input trade records into the Data Sheet.
Step 2: Define Trading Dimensions
Include:
-
Contract type
-
Region
-
Counterparty
-
Exchange
-
Trader name
Step 3: Refresh Dashboard
Charts update automatically after data entry.
Step 4: Apply Filters
Use slicers to analyze specific trading scenarios.
Step 5: Analyze Insights
Review charts and KPI cards to evaluate performance.
Best Practices for the Commodities Trading Dashboard in Excel
To achieve maximum value, follow these best practices.
✔ Maintain Clean Data
Always use consistent formats and naming conventions.
✔ Update Data Regularly
Frequent updates ensure accurate insights.
✔ Use Standard KPIs
Define measurable performance indicators.
✔ Monitor Settlement Status
Track pending settlements to reduce risk.
✔ Review Monthly Trends
Analyze performance regularly to identify patterns.
✔ Limit Manual Changes
Avoid editing formulas to prevent reporting errors.
Who Can Benefit from This Dashboard?
Click to Purchases Commodities Trading Dashboard in Excel
Many professionals across the trading ecosystem can use this solution.
Traders
Monitor performance and optimize strategies.
Commodity Brokers
Track brokerage income and trading activity.
Financial Analysts
Evaluate profitability and risk exposure.
Trading Firms
Manage multi-region trading operations efficiently.
Risk Managers
Identify exposure and settlement delays.
Why Choose Excel for Commodity Trading Analytics?
Although many analytics tools exist, Excel remains a preferred choice.
Reasons Include:
-
Familiar interface
-
High flexibility
-
Powerful formulas
-
Easy sharing
-
Low implementation cost
Additionally, Excel dashboards integrate easily with existing workflows.
Future Enhancements You Can Add
You can extend dashboard capabilities further:
-
Power Query automation
-
Live market price integration
-
Risk exposure metrics
-
Trade forecasting models
-
VBA automation
These enhancements can transform Excel into a powerful trading analytics platform.
Conclusion
The Commodities Trading Dashboard in Excel provides a smart and practical way to analyze commodity trading performance. Instead of relying on complex reports, traders gain instant insights through interactive charts and structured analytics.
Moreover, the dashboard improves visibility across contract types, counterparties, regions, and monthly trends. As a result, organizations make faster decisions, control brokerage costs, and improve profitability.
Because the solution works entirely within Excel, businesses can implement it quickly while keeping costs low. Therefore, this dashboard becomes an essential tool for modern commodity trading operations.
Frequently Asked Questions (FAQs)
1. What is a Commodities Trading Dashboard in Excel?
It is an interactive Excel-based tool that analyzes commodity trading data using charts, KPIs, and automated reporting.
2. Who should use this dashboard?
Commodity traders, brokers, analysts, and trading firms can use it to monitor performance and profitability.
3. Do I need advanced Excel skills to use it?
No. The dashboard includes navigation buttons and automated visuals, which make it easy to use.
4. Can I customize the dashboard?
Yes. You can modify charts, KPIs, and data structures according to your business needs.
5. Does the dashboard update automatically?
Yes. Once you update the Data Sheet, charts and metrics refresh automatically.
6. Can this dashboard handle large trading data?
Yes. Excel supports large datasets, especially when structured properly.
7. Is this dashboard suitable for small trading firms?
Absolutely. It works well for both small teams and large trading organizations.
Visit our YouTube channel to learn step-by-step video tutorials