Running a photography business involves much more than taking beautiful pictures. You must manage bookings, track payments, monitor editing progress, evaluate client satisfaction, and analyse marketing performance. However, many photographers still depend on scattered spreadsheets or manual tracking systems. As a result, they lose valuable insights and struggle to make fast decisions.
Therefore, businesses increasingly adopt Photography Dashboard in Power BI solutions to organize and analyse their operational data in one place.
A Photography Dashboard in Power BI transforms raw booking and financial data into interactive visual insights. Instead of reviewing multiple files, photographers and studio managers instantly understand performance, profitability, and customer trends through dynamic reports.
In this detailed guide, you will learn everything about the Photography Dashboard in Power BI — including features, benefits, structure, advantages, best practices, and frequently asked questions.
Click to buy Photography Dashboard in Power BI
What Is a Photography Dashboard in Power BI?
A Photography Dashboard in Power BI is an interactive business intelligence solution designed to monitor photography business performance using visual analytics and KPIs.
Instead of manually calculating metrics, the dashboard automatically analyzes:
- Booking performance
- Revenue and cost tracking
- Editing productivity
- Customer satisfaction ratings
- Lead source effectiveness
- Monthly financial trends
Because Power BI provides dynamic visuals and slicers, users quickly filter data by package, shoot type, month, or marketing source.
As a result, decision-making becomes faster, smarter, and data-driven.
Why Do Photography Businesses Need a Dashboard?
Photography studios handle multiple moving parts every day. For example, teams manage shoots, editing timelines, client payments, and marketing channels simultaneously. Without structured analytics, businesses often face confusion.
How Does a Photography Dashboard Improve Business Performance?
A Power BI dashboard converts operational data into actionable insights. Consequently, photographers understand what works and what needs improvement.
Key Improvements Include
- Faster performance monitoring
- Better financial planning
- Improved customer experience
- Accurate booking analysis
- Better marketing ROI tracking
- Real-time trend identification
Moreover, visual analytics reduce manual reporting efforts significantly.
Key Features of the Photography Dashboard in Power BI
This ready-to-use dashboard contains 5 interactive pages inside the Power BI Desktop application. Each page focuses on a specific area of business performance.
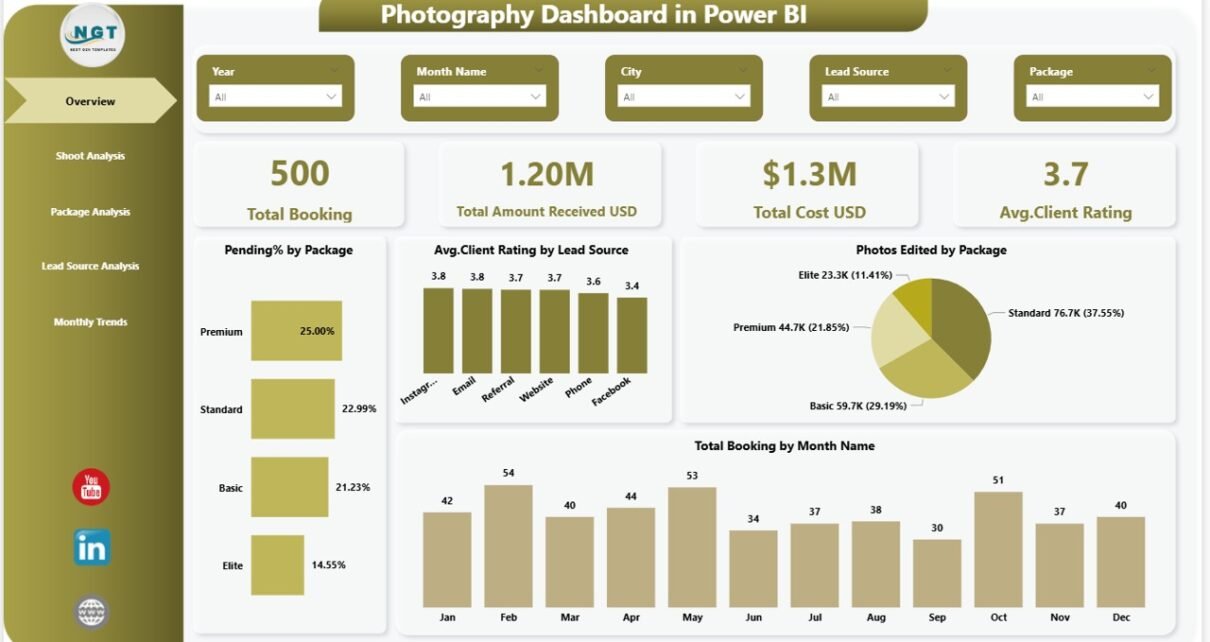
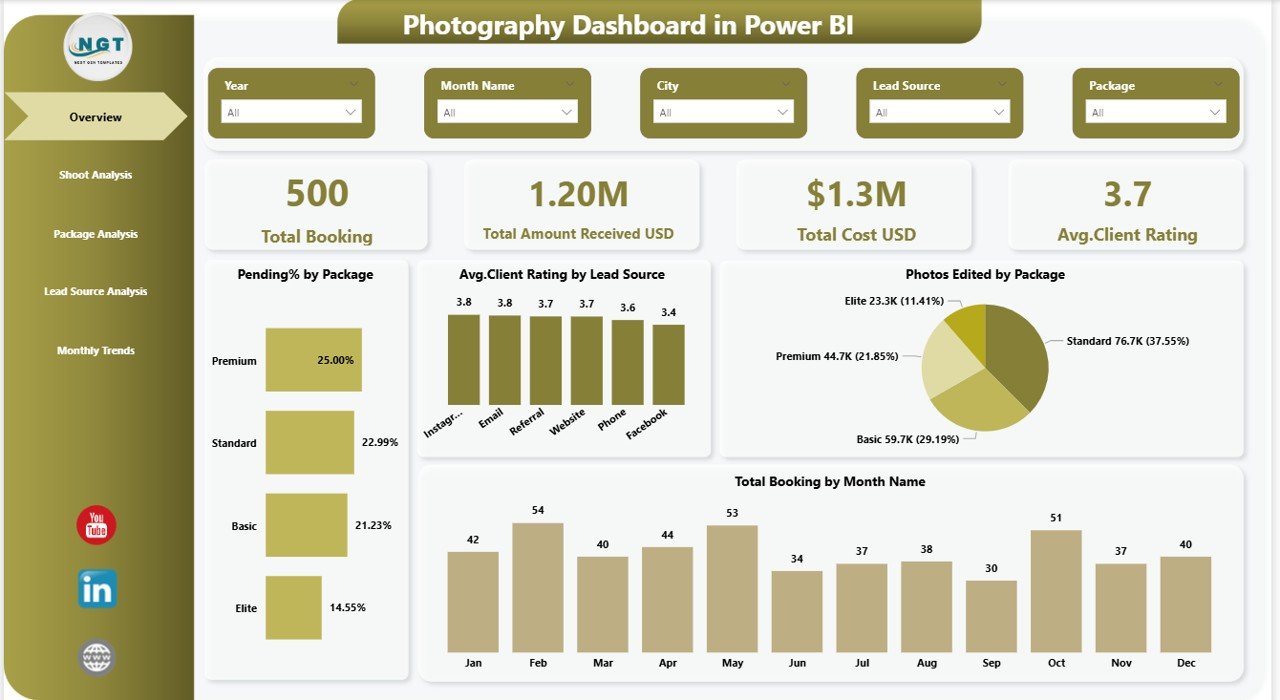
Overview Page – What Is Happening in the Business?
The Overview Page acts as the main control center of the dashboard. It provides a quick snapshot of overall performance.
KPI Cards Displayed
- Total Bookings
- Total Amount Received (USD)
- Total Cost (USD)
- Average Client Rating
These cards instantly show business health.
Charts Included
- Pending % by Package
- Average Client Rating by Lead Source
- Photos Edited by Package
- Total Bookings by Month Name
Why This Page Matters
Because managers see high-level KPIs immediately, they quickly identify whether performance improves or declines.
Click to buy Photography Dashboard in Power BI
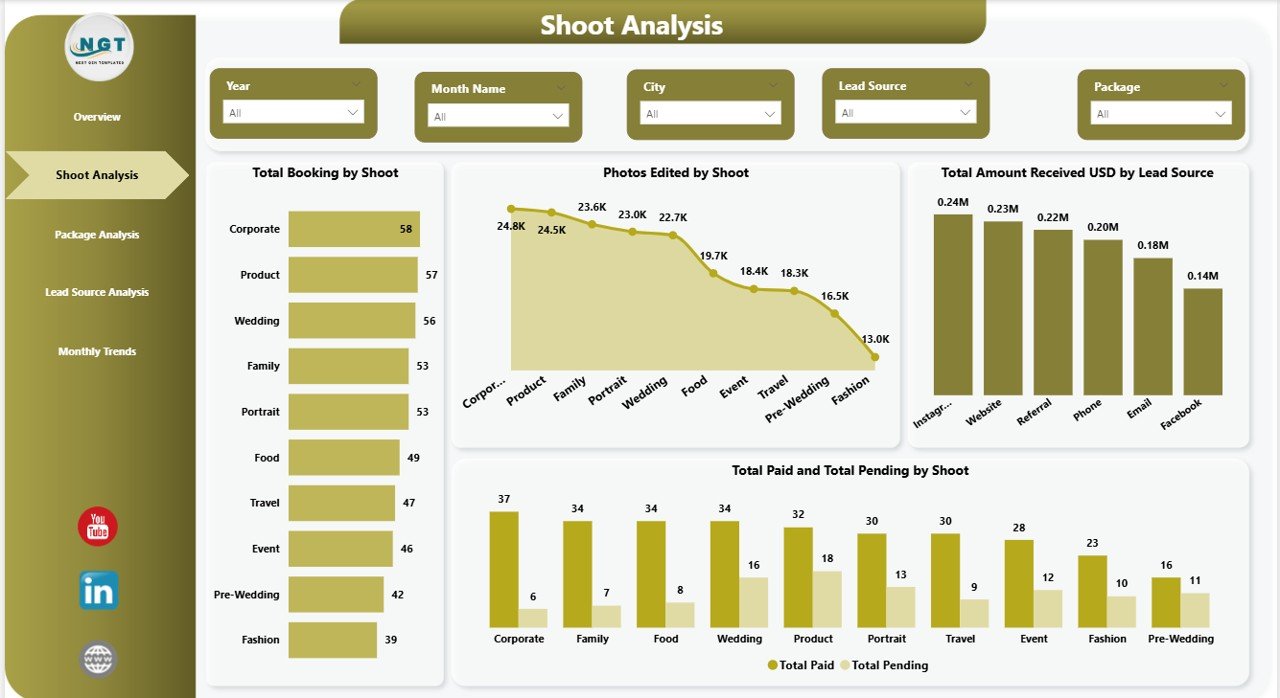
Shoot Analysis – Which Shoots Perform Best?
The Shoot Analysis Page focuses on performance by shoot type.
Visual Insights Available
- Total Booking by Shoot Type
- Photos Edited by Shoot
- Total Amount Received (USD) by Lead Source
- Total Paid vs Total Pending by Shoot
Business Value
This page helps answer important questions:
- Which shoot generates maximum revenue?
- Which shoot type has pending payments?
- Where does editing workload increase?
Therefore, studios allocate resources more efficiently.
Click to buy Photography Dashboard in Power BI
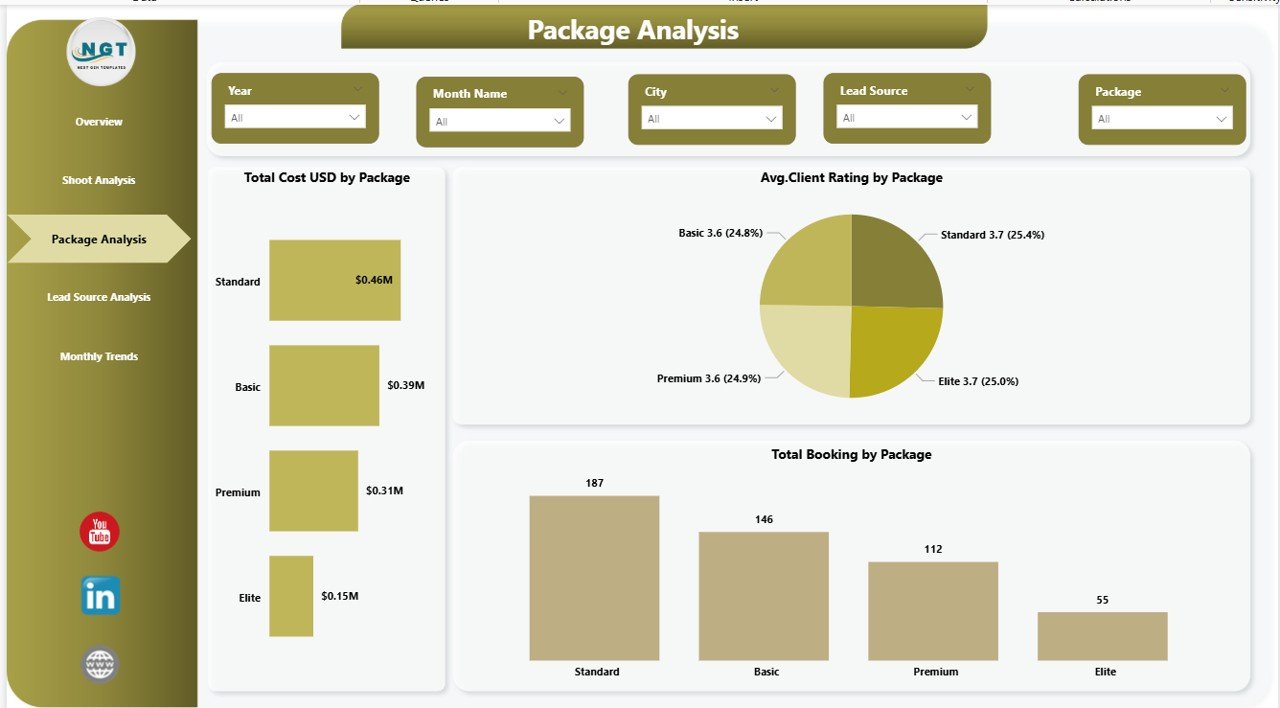
Package Analysis – Which Packages Drive Profit?
Photography businesses often offer multiple packages such as wedding, portrait, corporate, or event coverage. However, not every package performs equally.
Charts Included
- Total Cost (USD) by Package
- Average Customer Satisfaction % by Package
- Total Booking by Package
Insights You Can Discover
- Most profitable package
- Highest satisfaction package
- Packages needing improvement
Consequently, pricing strategies become data-driven.
Click to buy Photography Dashboard in Power BI
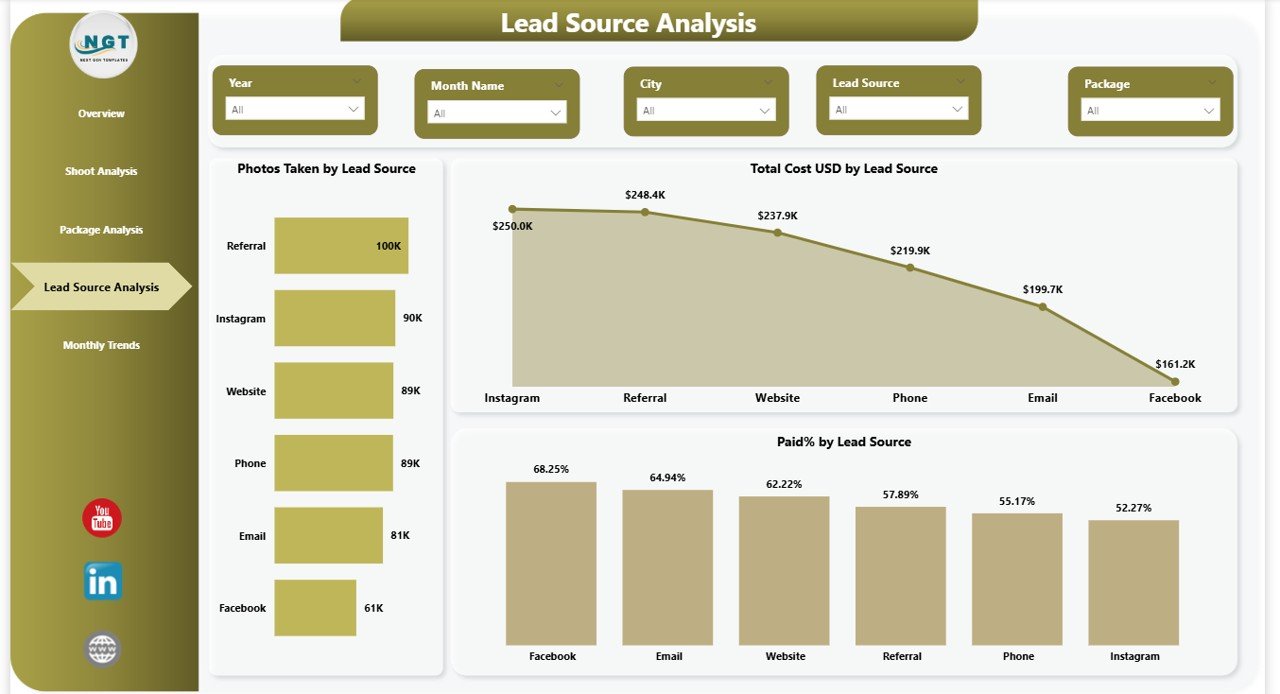
Lead Source Analysis – Where Do Clients Come From?
Marketing success depends on understanding lead sources. Therefore, this page analyzes customer acquisition channels.
Charts Available
- Photos Taken by Lead Source
- Total Cost (USD) by Lead Source
- Paid % by Lead Source
Why This Analysis Matters
You can identify:
- Best-performing marketing channels
- High-cost acquisition sources
- Lead sources generating faster payments
As a result, marketing budgets improve significantly.
Click to buy Photography Dashboard in Power BI
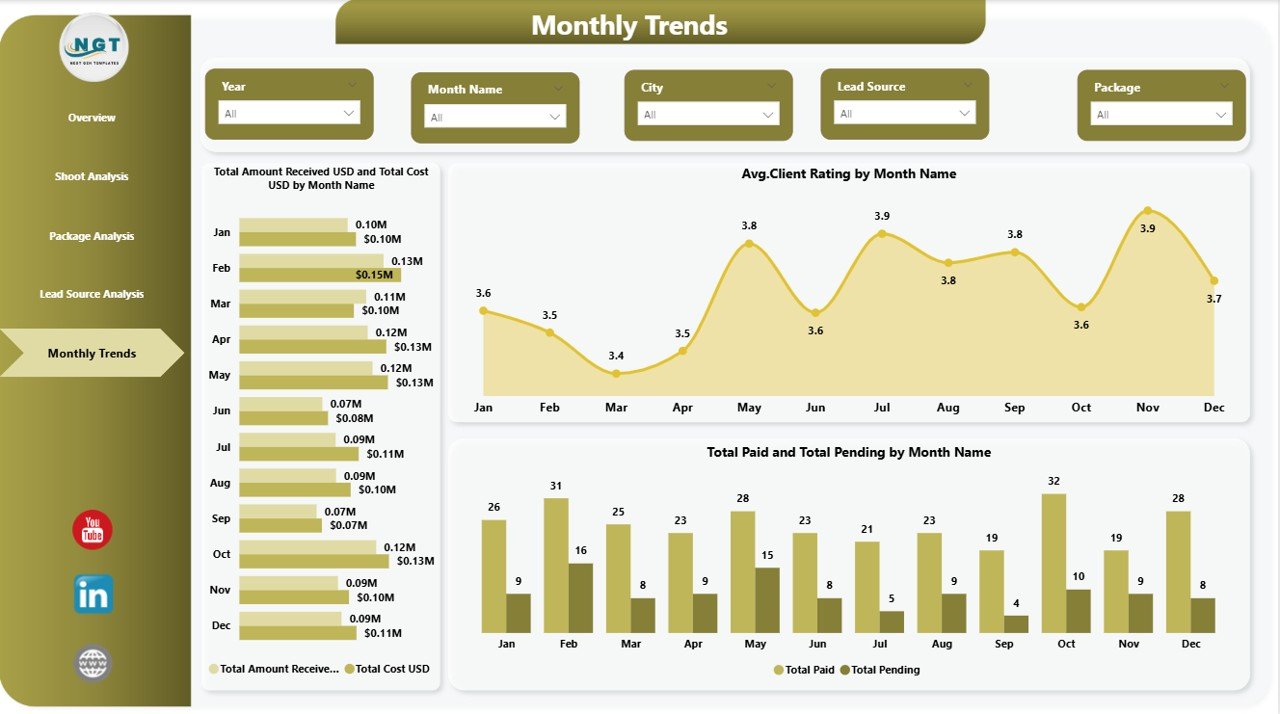
Monthly Trends – How Is Performance Changing Over Time?
The Monthly Trends Page helps users analyze time-based performance patterns.
Charts Included
- Total Amount Received vs Total Cost by Month
- Average Customer Satisfaction % by Month
- Total Paid vs Total Pending by Month
Benefits of Monthly Analysis
- Detect seasonal demand
- Track revenue growth trends
- Monitor customer satisfaction changes
- Plan future campaigns effectively
Therefore, businesses move from reactive decisions to proactive planning.
Click to buy Photography Dashboard in Power BI
What KPIs Should a Photography Dashboard Track?
A strong dashboard focuses on measurable indicators.
Financial KPIs
- Total Revenue
- Total Cost
- Profit Margin
- Paid vs Pending Amount
Operational KPIs
- Total Bookings
- Photos Edited
- Shoot Completion Rate
Customer KPIs
- Client Satisfaction Score
- Average Rating
- Repeat Clients
Marketing KPIs
- Lead Source Conversion Rate
- Booking by Marketing Channel
- Acquisition Cost
Tracking these KPIs ensures complete business visibility.
Advantages of Photography Dashboard in Power BI
Using a Power BI dashboard provides several business advantages.
Centralized Data Management
All business information stays in one interactive platform.
Real-Time Performance Tracking
You instantly monitor bookings, payments, and editing progress.
Better Financial Control
Revenue and cost comparisons improve budgeting decisions.
Improved Client Experience
You track satisfaction trends and resolve issues faster.
Data-Driven Marketing Decisions
Lead source analysis reveals the best marketing channels.
Time Savings
Automation eliminates manual reporting work.
How Does Power BI Make Photography Analytics Powerful?
Power BI offers advanced capabilities that traditional spreadsheets cannot match.
Interactive Features
- Dynamic slicers and filters
- Drill-down analysis
- Automatic calculations
- Visual storytelling
Because users interact with visuals directly, insights become easier to understand.
Who Can Use a Photography Dashboard?
This dashboard benefits multiple professionals.
Ideal Users Include
- Photography studio owners
- Wedding photographers
- Event photography companies
- Freelance photographers
- Media production teams
- Photography agencies
Even small studios gain professional analytics using this dashboard.
How to Implement a Photography Dashboard in Power BI?
Implementation remains simple and structured.
Step 1: Collect Data
Gather booking, payment, and client information.
Step 2: Prepare Excel Data Source
Organize data into structured tables.
Step 3: Connect Excel to Power BI
Import data using Power BI Desktop.
Step 4: Load Dashboard Template
Apply visuals and KPIs.
Step 5: Refresh Data Regularly
Update insights automatically.
As a result, reporting becomes seamless.
Best Practices for the Photography Dashboard in Power BI
Following best practices ensures maximum dashboard effectiveness.
Keep Data Clean
Maintain consistent naming formats and accurate entries.
Update Data Regularly
Frequent updates provide reliable insights.
Focus on Important KPIs
Avoid overcrowding dashboards with unnecessary metrics.
Use Filters Smartly
Allow users to analyze data by shoot, package, or month.
Monitor Trends Frequently
Review dashboards weekly or monthly.
Align KPIs with Business Goals
Track metrics that directly impact growth.
How Can Photographers Use Insights to Grow Their Business?
Data insights directly influence business success.
For example:
- Increase investment in high-performing lead sources.
- Improve packages with low satisfaction scores.
- Reduce costs in low-profit shoots.
- Optimize editing workflows during busy seasons.
Therefore, analytics transforms creative businesses into scalable enterprises.
Future of Photography Analytics with Power BI
Photography businesses increasingly rely on analytics. In the future, dashboards will integrate:
- AI-based performance predictions
- Automated booking forecasting
- Customer behavior analysis
- Smart pricing optimization
Therefore, early adoption provides a competitive advantage.
Conclusion
A Photography Dashboard in Power BI changes how photography businesses manage performance. Instead of guessing results, studios rely on clear visual insights.
Because the dashboard centralizes bookings, finances, marketing, and customer satisfaction, users quickly understand business performance from multiple perspectives.
Moreover, interactive visuals make analysis simple even for non-technical users. As a result, photographers save time, improve profitability, and deliver better client experiences.
If you want to grow your photography business using data-driven decisions, implementing a Photography Dashboard in Power BI becomes a smart and future-ready step.
Frequently Asked Questions (FAQs)
- What is a Photography Dashboard in Power BI?
It is an interactive analytics dashboard that tracks photography business KPIs such as bookings, revenue, costs, and customer satisfaction.
- Do I need technical knowledge to use this dashboard?
No. Power BI dashboards use visual interfaces, so beginners can easily understand insights.
- Can freelance photographers use this dashboard?
Yes. Freelancers benefit from organized performance tracking and financial monitoring.
- How often should I update the dashboard?
You should update data weekly or monthly for accurate insights.
- Can I customize KPIs?
Yes. Power BI allows full customization based on business needs.
- What data source does the dashboard use?
Typically, the dashboard connects to structured Excel files.
- Does this dashboard help increase profits?
Yes. It identifies profitable packages, effective lead sources, and cost-saving opportunities.
- Is Power BI better than Excel dashboards?
Power BI offers more interactive visuals, automation, and advanced analytics capabilities.
Watch the step-by-step video tutorial:
Click to buy Photography Dashboard in Power BI
Visit our YouTube channel to learn step-by-step video tutorials