In today’s competitive fashion industry, boutique owners must make fast and accurate decisions to stay profitable. Fashion trends change quickly, customer preferences evolve constantly, and competition increases every day. Therefore, boutique managers need a powerful system that helps them track sales performance, monitor profitability, and analyze business trends in real time.
However, many fashion boutiques still depend on manual reports, disconnected spreadsheets, or basic accounting summaries. As a result, business owners struggle to understand which products sell best, which locations perform well, and where profits actually come from.
To solve these challenges, businesses increasingly adopt smart dashboards. One of the most practical and effective solutions is the Fashion Boutiques Dashboard in Excel — a ready-to-use analytical tool designed to transform raw sales data into meaningful insights.
In this comprehensive guide, you will learn everything about the Fashion Boutiques Dashboard in Excel, including its features, structure, benefits, best practices, and implementation strategies.
Click to Purchases Fashion Boutiques Dashboard in Excel
What Is a Fashion Boutiques Dashboard in Excel?
A Fashion Boutiques Dashboard in Excel is an interactive business intelligence tool that helps boutique owners monitor performance using structured visual reports and Key Performance Indicators (KPIs).
Instead of reviewing multiple reports separately, users can analyze revenue, profit margins, product performance, and customer segments from a single dashboard.
Because Excel provides flexibility and automation, businesses can easily update data and instantly view refreshed insights. Moreover, decision-makers gain clarity without investing in expensive software.
Why Do Fashion Boutiques Need a Dashboard?
Fashion retail operates in a fast-moving environment. Therefore, businesses must track performance continuously.
A dashboard helps boutiques:
-
Monitor daily and monthly sales trends
-
Identify high-performing products
-
Analyze boutique-wise performance
-
Control operational costs
-
Improve profit margins
-
Make data-driven decisions
Consequently, boutique owners move from guesswork to strategic planning.
Why Excel Is Perfect for Fashion Boutique Analytics?
Many businesses choose Excel because it combines simplicity with powerful analytics capabilities.
Key Reasons Excel Works Well
-
Easy data entry and updates
-
Interactive charts and slicers
-
Automated calculations
-
Cost-effective solution
-
No advanced technical knowledge required
-
Customizable reporting structure
Furthermore, Excel dashboards allow businesses to scale analytics gradually as operations grow.
Key Features of the Fashion Boutiques Dashboard in Excel
The Fashion Boutiques Dashboard includes a structured layout designed specifically for retail analytics.
Page Navigator
Located on the left side, the Page Navigator allows users to move easily between analytical pages. As a result, users access insights quickly without searching through worksheets.
Dashboard Structure: 5 Analytical Pages Explained
The dashboard contains five powerful analytical pages, each focusing on a different business perspective.
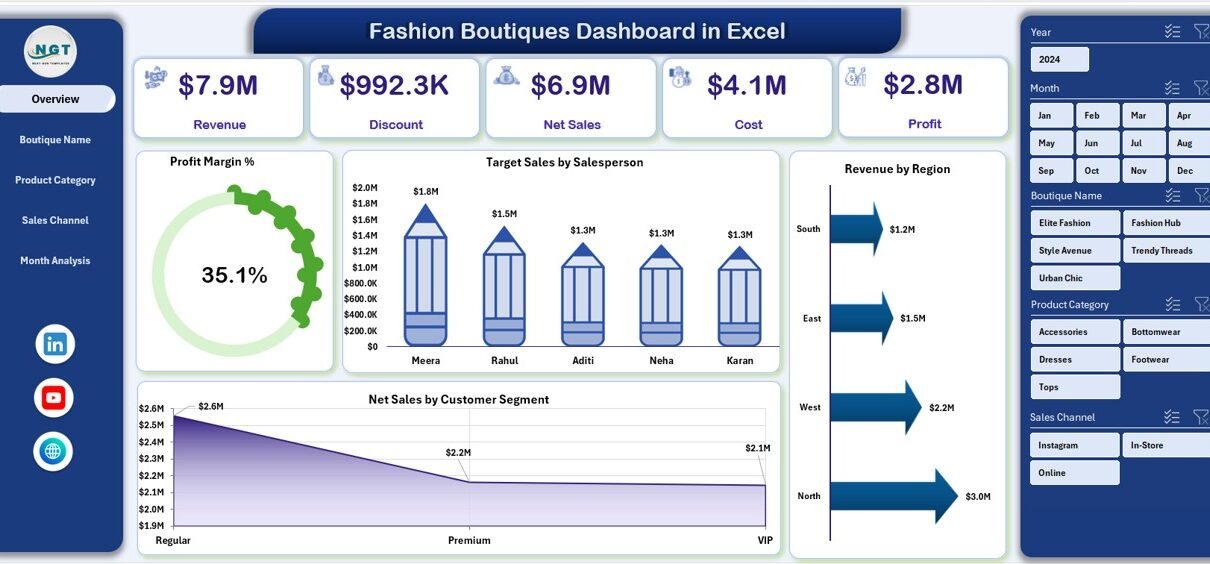
1. Overview Page – The Business Performance Snapshot
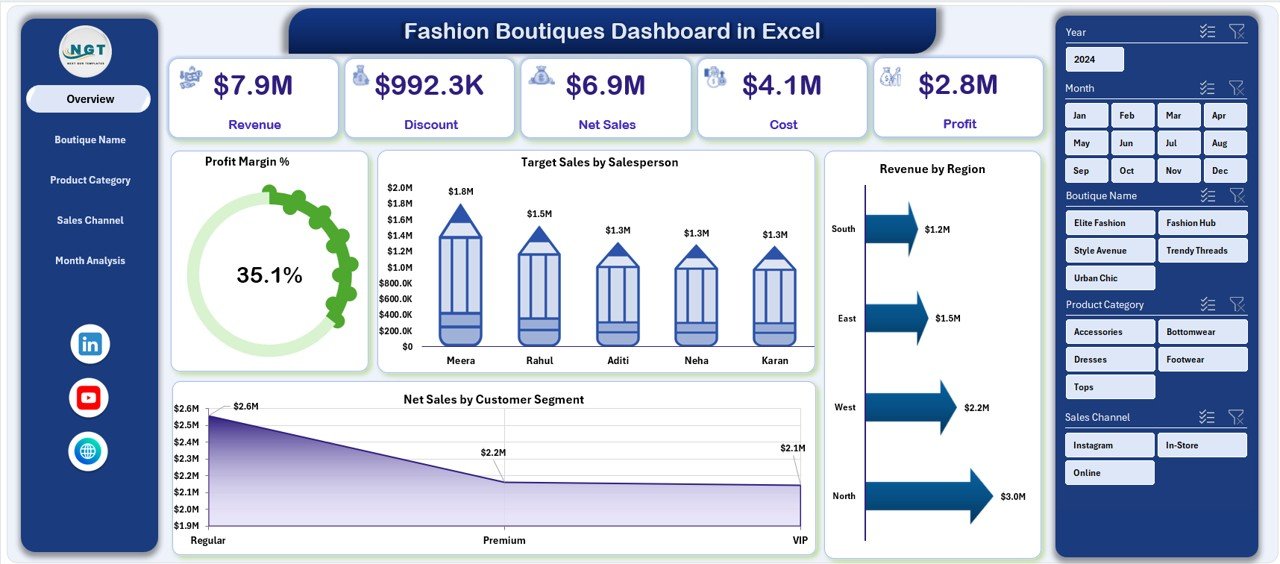
The Overview Page acts as the central control panel of the dashboard.
What You See on This Page
-
Right-side slicers for filtering data
-
Four KPI cards showing performance highlights
-
Visual charts summarizing business health
Charts Included
-
Profit Margin %
-
Target Sales by Salesperson
-
Revenue by Region
-
Net Sales by Customer Segment
Because this page combines multiple metrics, managers instantly understand overall performance.
Moreover, executives can identify trends within seconds, which improves decision-making speed.
Click to Purchases Fashion Boutiques Dashboard in Excel
2. Boutique Name Analysis – Which Store Performs Best?
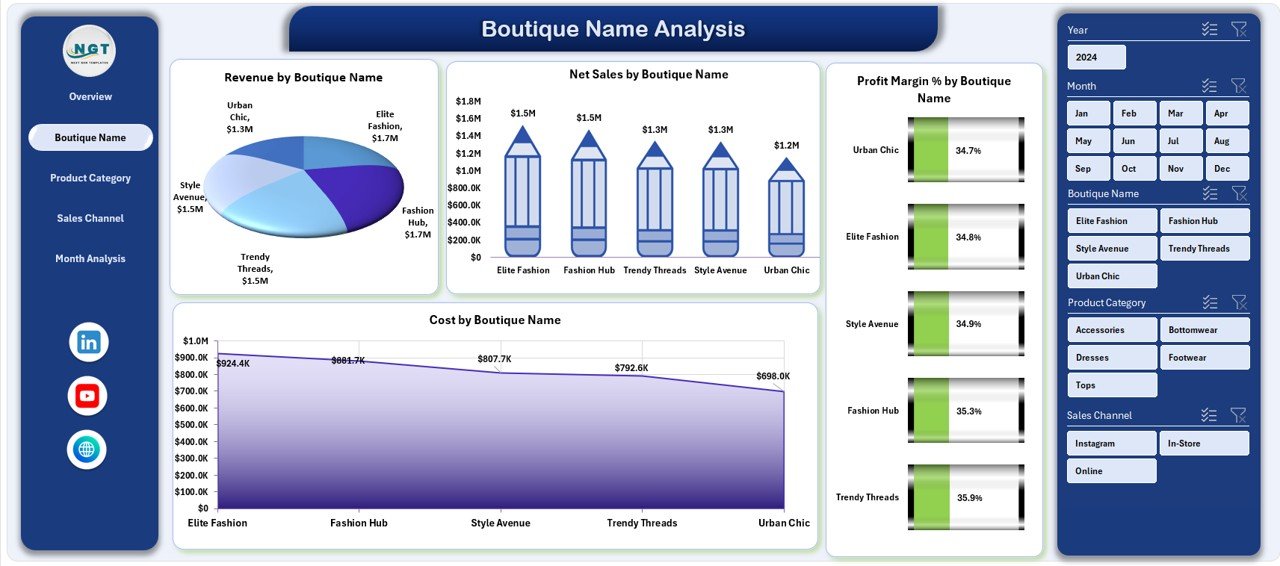
Retail chains often operate multiple boutiques. Therefore, performance comparison becomes essential.
The Boutique Name Analysis Page helps managers evaluate each boutique individually.
Charts Available
-
Revenue by Boutique Name
-
Net Sales by Boutique Name
-
Profit Margin % by Boutique Name
-
Cost by Boutique Name
With this analysis, businesses can:
-
Identify top-performing boutiques
-
Detect underperforming locations
-
Optimize inventory distribution
-
Improve operational efficiency
As a result, management allocates resources more effectively.
3. Product Category Analysis – Understanding Fashion Trends
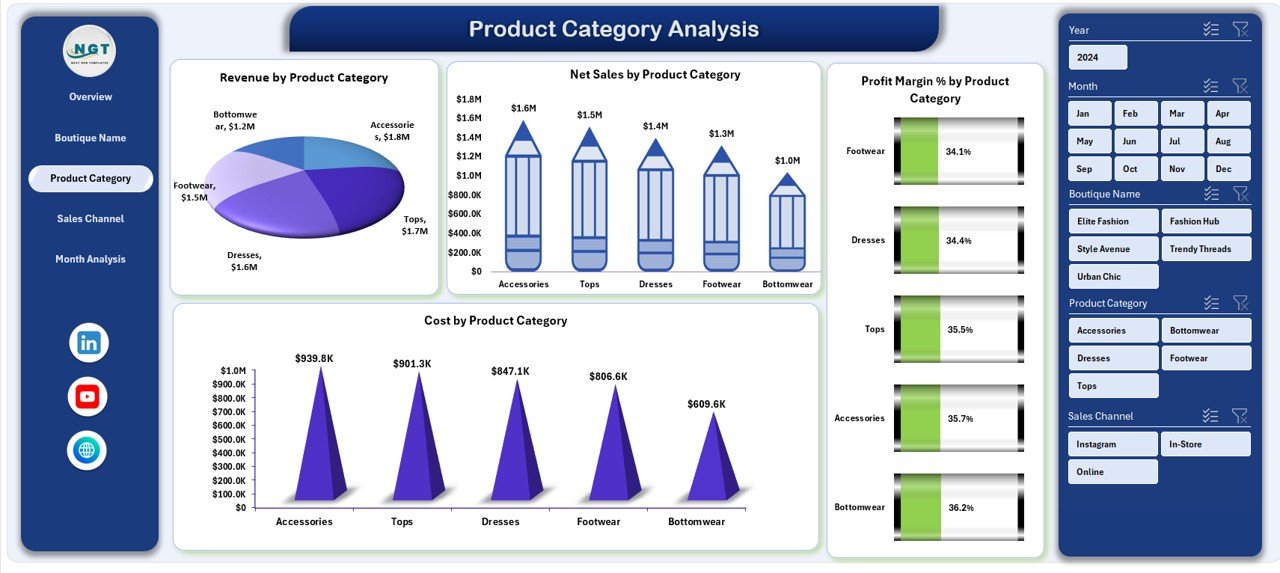
Fashion success heavily depends on product categories such as dresses, accessories, footwear, or seasonal collections.
This page focuses on category-level insights.
Charts Included
-
Revenue by Product Category
-
Net Sales by Product Category
-
Profit Margin % by Product Category
-
Cost by Product Category
Because fashion trends change quickly, category analysis helps boutiques adapt faster.
For example:
-
Increase stock for trending products
-
Reduce slow-moving inventory
-
Improve pricing strategies
Consequently, businesses maintain better profitability.
4. Sales Channel Analysis – Where Do Sales Come From?
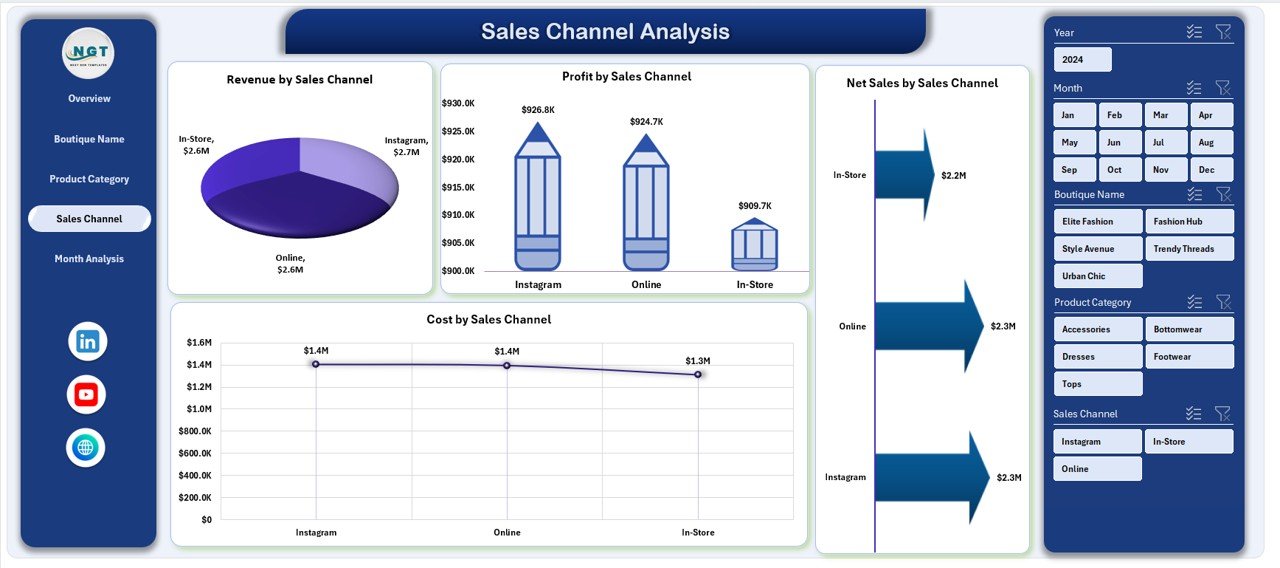
Modern boutiques sell through multiple channels:
-
Physical stores
-
Online websites
-
Social media platforms
-
Marketplace platforms
The Sales Channel Analysis Page evaluates performance across channels.
Charts Available
-
Revenue by Sales Channel
-
Net Sales by Sales Channel
-
Profit by Sales Channel
-
Cost by Sales Channel
This analysis allows businesses to:
-
Compare online vs offline sales
-
Optimize marketing investments
-
Improve channel profitability
-
Strengthen omnichannel strategy
Therefore, boutiques invest in channels that deliver maximum returns.
Click to Purchases Fashion Boutiques Dashboard in Excel
5. Month Analysis – Tracking Business Trends Over Time
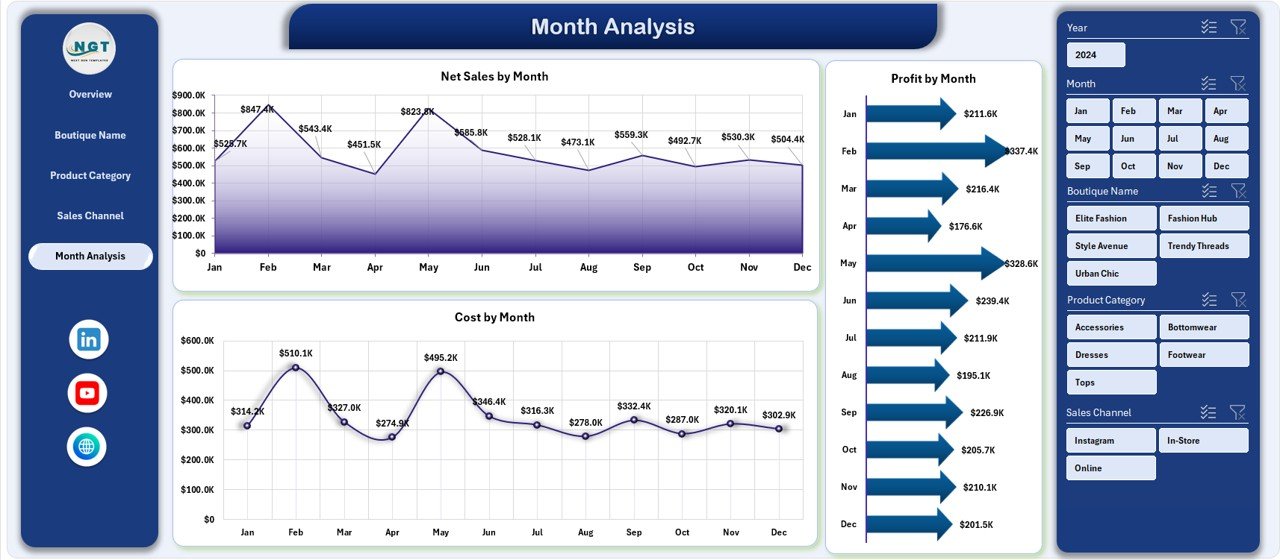
Seasonality plays a major role in fashion retail. Sales fluctuate during festivals, holidays, and seasonal launches.
The Month Analysis Page provides time-based insights.
Charts Included
-
Net Sales by Month
-
Profit Margin by Month
-
Cost by Month
Because this page shows trends over time, businesses can forecast demand more accurately.
Additionally, managers plan promotions and inventory in advance.
Supporting Sheets Behind the Dashboard
Support Sheet
The support sheet manages background calculations and structured references that drive dashboard visuals. Although users rarely interact with it directly, it ensures smooth automation.
Data Sheet
The Data Sheet acts as the primary data source.
Users can:
-
Enter sales transactions
-
Update boutique details
-
Add product information
-
Refresh dashboard automatically
Therefore, maintaining clean data becomes essential for accurate reporting.
How Does the Fashion Boutiques Dashboard Improve Decision Making?
A dashboard transforms raw data into actionable insights.
Before Using a Dashboard
-
Reports scattered across files
-
Slow analysis process
-
Manual calculations
-
Limited visibility
After Using the Dashboard
-
Centralized analytics
-
Instant insights
-
Automated KPIs
-
Faster decisions
Hence, boutique owners focus more on growth rather than reporting.
Advantages of Fashion Boutiques Dashboard in Excel
Using a structured dashboard provides multiple business benefits.
✅ Better Sales Visibility
Managers instantly view revenue performance across boutiques and channels.
✅ Improved Profit Monitoring
Profit margin tracking helps control costs effectively.
✅ Faster Decision Making
Visual analytics reduce analysis time significantly.
✅ Inventory Optimization
Product category insights guide purchasing decisions.
✅ Performance Accountability
Salesperson targets encourage better performance.
✅ Cost Control
Businesses identify high-cost areas quickly.
✅ Easy Customization
Users can modify fields according to business needs.
Best Practices for the Fashion Boutiques Dashboard in Excel
To achieve maximum value, businesses should follow proven practices.
1. Maintain Clean Data
Always ensure consistent formatting and accurate entries.
2. Update Data Regularly
Frequent updates keep insights relevant.
3. Use Filters Effectively
Apply slicers to analyze specific regions, months, or categories.
4. Track KPIs Consistently
Focus on key metrics instead of excessive data.
5. Review Monthly Trends
Regular analysis helps identify seasonal patterns.
6. Train Staff Members
Ensure team members understand dashboard usage.
7. Backup Data Frequently
Protect business information from loss.
How to Implement the Fashion Boutiques Dashboard Successfully?
Step 1: Prepare Your Data
Collect sales, product, and boutique information.
Step 2: Import Data into Excel
Paste data into the Data Sheet.
Step 3: Refresh Dashboard
Charts update automatically.
Step 4: Apply Filters
Analyze performance using slicers.
Step 5: Monitor Insights
Review dashboards regularly for improvements.
Who Can Benefit from This Dashboard?
The Fashion Boutiques Dashboard serves multiple professionals.
-
Boutique Owners
-
Fashion Retail Managers
-
Sales Managers
-
Financial Analysts
-
Retail Consultants
-
E-commerce Managers
Because it simplifies analytics, both small boutiques and large fashion chains benefit equally.
Common Challenges Fashion Boutiques Face (And How This Dashboard Solves Them)
Challenge: Poor Sales Visibility
➡ Dashboard provides real-time insights.
Challenge: Low Profit Margins
➡ Profit analysis highlights improvement areas.
Challenge: Inventory Mismanagement
➡ Category analysis guides stock planning.
Challenge: Multi-Store Complexity
➡ Boutique comparison simplifies monitoring.
Challenge: Channel Performance Confusion
➡ Sales channel analytics clarify performance.
Future of Fashion Retail Analytics Using Excel Dashboards
Click to Purchases Fashion Boutiques Dashboard in Excel
Retail analytics continues evolving rapidly. However, Excel dashboards remain highly relevant because they offer flexibility and affordability.
In the future, boutiques will increasingly combine:
-
Excel dashboards
-
Automation tools
-
Data visualization
-
Customer analytics
Therefore, businesses that adopt dashboards today gain a competitive advantage tomorrow.
Conclusion
The Fashion Boutiques Dashboard in Excel provides a smart, structured, and user-friendly way to monitor fashion retail performance. Instead of relying on manual reports, boutique owners gain real-time visibility into sales, profit margins, product performance, and business trends.
Moreover, the dashboard improves decision-making, enhances operational efficiency, and supports sustainable growth. Because it combines simplicity with powerful analytics, it becomes an essential tool for modern fashion businesses.
Ultimately, boutiques that use data effectively outperform competitors and adapt faster to changing fashion trends.
Frequently Asked Questions (FAQs)
1. What is a Fashion Boutiques Dashboard in Excel used for?
It helps boutique owners track sales, profit margins, product performance, and business trends using interactive visual reports.
2. Do I need advanced Excel skills to use this dashboard?
No. The dashboard uses a user-friendly design, so beginners can operate it easily.
3. Can I customize the dashboard?
Yes. You can modify categories, boutiques, KPIs, and charts based on business requirements.
4. How often should I update the data?
You should update data daily or weekly for accurate insights.
5. Is this dashboard suitable for small boutiques?
Yes. Both small and large fashion businesses can use it effectively.
6. Can the dashboard analyze online and offline sales?
Yes. The Sales Channel Analysis page compares different sales channels.
7. Does the dashboard support monthly trend analysis?
Yes. The Month Analysis page tracks sales and profit trends over time.
Visit our YouTube channel to learn step-by-step video tutorials