In today’s rapidly evolving technological landscape, brain-computer interfaces (BCI) are transforming the way humans interact with machines. From healthcare innovations to neuroscience research and advanced robotics, BCI systems generate a massive volume of complex data every day. However, when this data remains scattered across spreadsheets, it becomes difficult to track performance, identify trends, and make informed decisions.
So, how can organizations efficiently monitor BCI performance and unlock powerful insights?
👉 The answer is the Brain-Computer Interfaces Dashboard in Power BI.
This ready-to-use, interactive dashboard allows you to analyze, visualize, and optimize BCI data in real time. Moreover, it converts raw datasets into meaningful insights using dynamic visuals, KPIs, and filters. As a result, decision-making becomes faster, smarter, and more data-driven.
Click to Purchases Brain-Computer Interfaces Dashboard in Power BI
In this comprehensive guide, you will explore everything about this dashboard, including its features, benefits, use cases, best practices, and more.
📊 What is a Brain-Computer Interfaces Dashboard in Power BI?
A Brain-Computer Interfaces Dashboard in Power BI is an advanced data visualization tool designed to track and analyze key metrics related to BCI systems.
Instead of manually reviewing raw data, you can:
- 📈 Monitor performance metrics in real time
- 🎯 Track accuracy, latency, and signal quality
- 🌍 Analyze geographic distribution of users and devices
- 📊 Compare device performance across manufacturers
- 🔍 Identify trends and improve system efficiency
Therefore, this dashboard helps researchers, engineers, and organizations make data-backed decisions with ease.
🚀 Why Do You Need a BCI Dashboard?
Without a centralized dashboard, BCI data often becomes overwhelming. However, with this Power BI solution, you gain clarity and control.
Here’s why it is essential:
- ✅ You can consolidate data from multiple sources
- ✅ You can reduce manual reporting efforts
- ✅ You can improve operational efficiency
- ✅ You can track real-time performance trends
- ✅ You can enhance decision-making speed
In short, this dashboard transforms complexity into simplicity.
Click to Purchases Brain-Computer Interfaces Dashboard in Power BI
🔑 Key Features of Brain-Computer Interfaces Dashboard in Power BI
This dashboard includes 5 powerful pages, each designed to provide specific insights.
1️⃣ Overview Page – Your Command Center
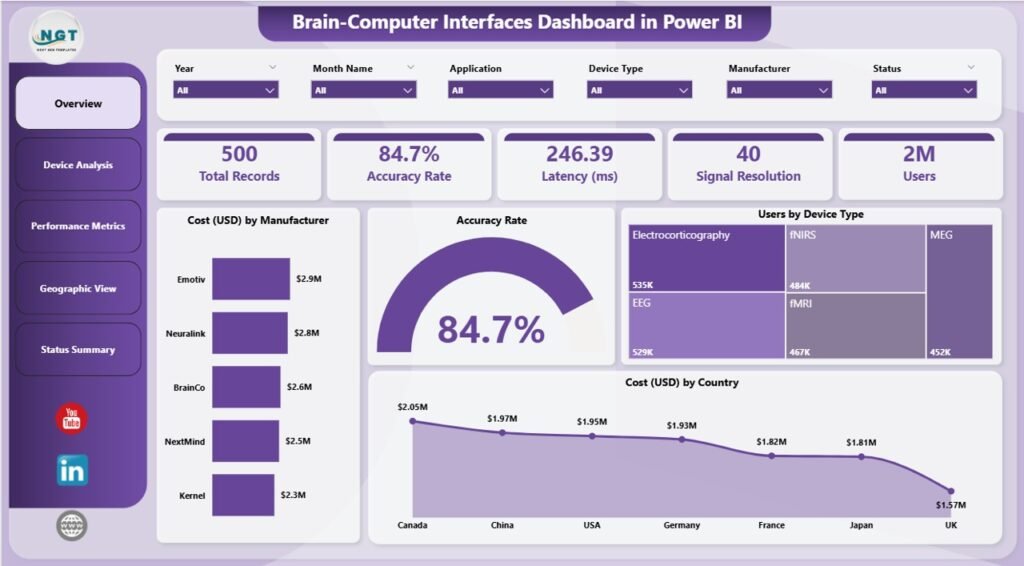
The Overview Page acts as the central hub of the dashboard. It provides a quick snapshot of all key metrics.
Key Highlights:
- 📊 5 KPI Cards:
- Cost by Manufacturer
- Accuracy Rate
- Users by Device Type
- Cost by Country
- 📈 Visual Insights:
- High-level performance indicators
- Easy comparison across metrics
👉 As a result, users can instantly understand overall performance without digging into detailed data.
2️⃣ Device Analysis – Deep Dive into Devices
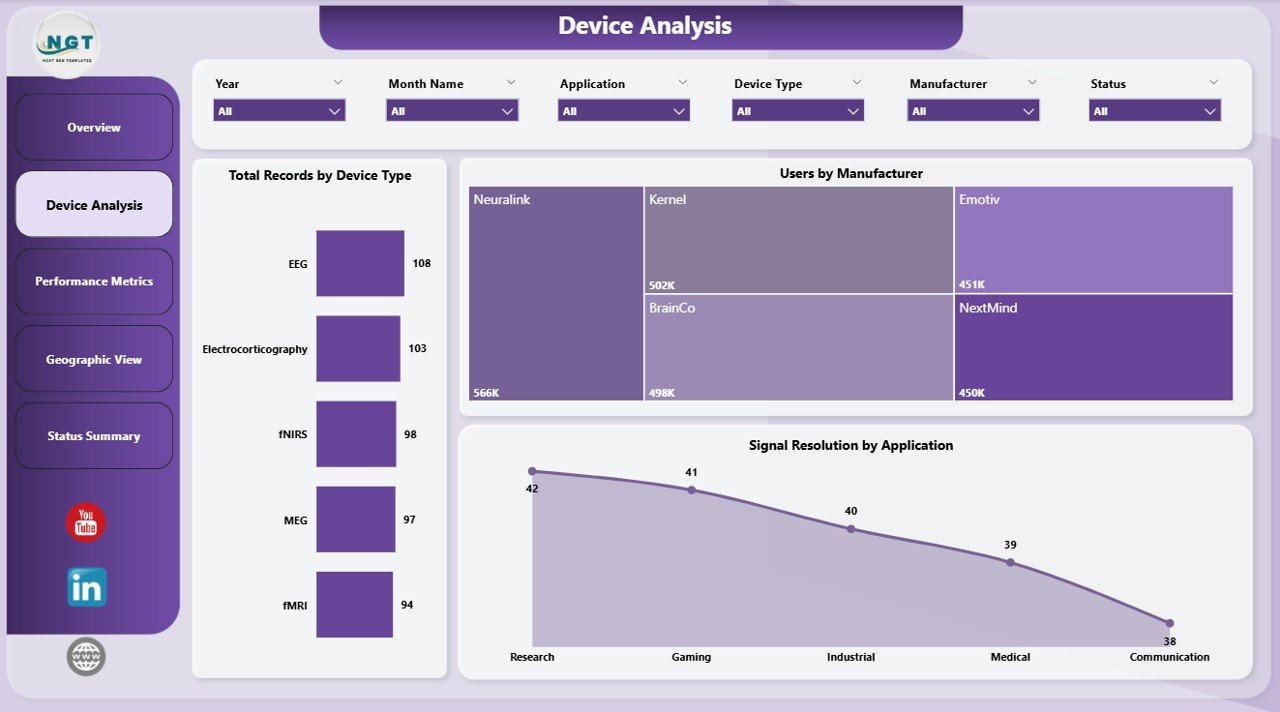
The Device Analysis Page focuses on understanding how different BCI devices perform.
Key Charts:
- 📊 Total Records by Device Type
- 👥 Users by Manufacturer
- 📡 Signal Resolution by Application
👉 Therefore, you can identify which devices perform best and where improvements are needed.
Click to Purchases Brain-Computer Interfaces Dashboard in Power BI
3️⃣ Performance Metrics – Measure What Matters
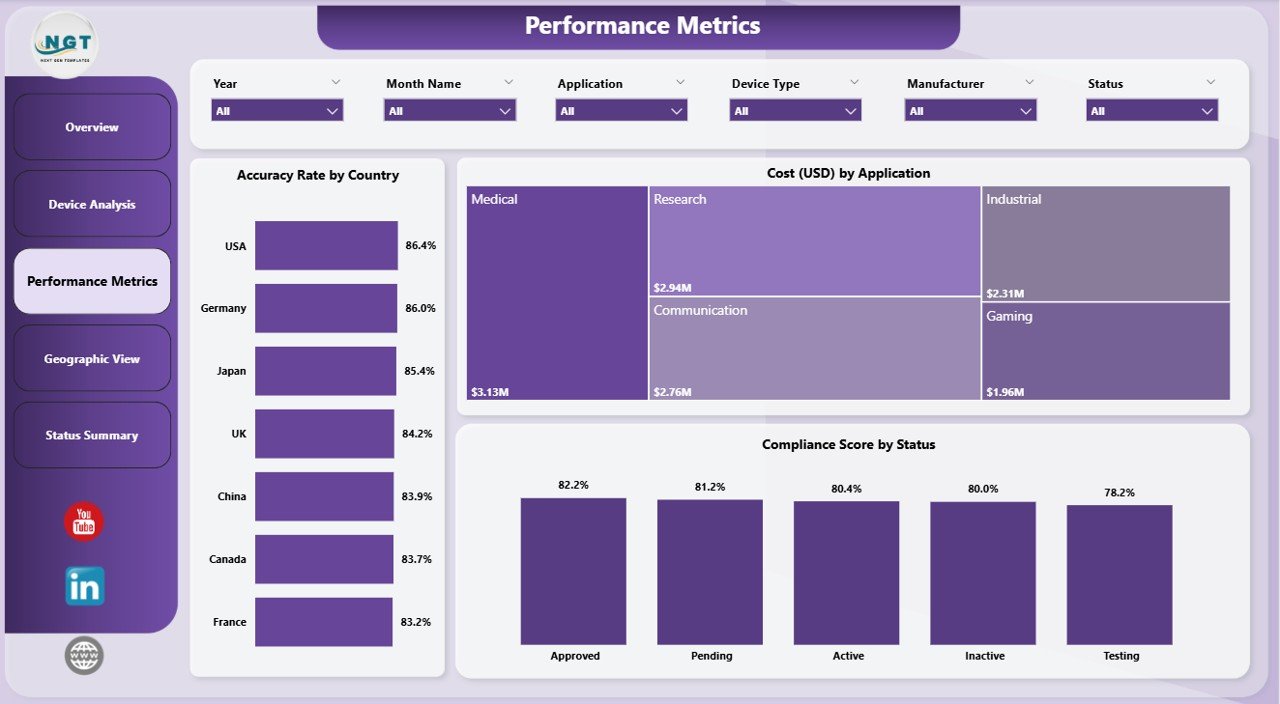
This page highlights the most critical performance indicators.
Key Charts:
- 🌍 Accuracy Rate by Country
- 💰 Cost by Application
- ✅ Compliance Score by Status
👉 Consequently, organizations can monitor efficiency, cost-effectiveness, and compliance in one place.
4️⃣ Geographic View – Location-Based Insights
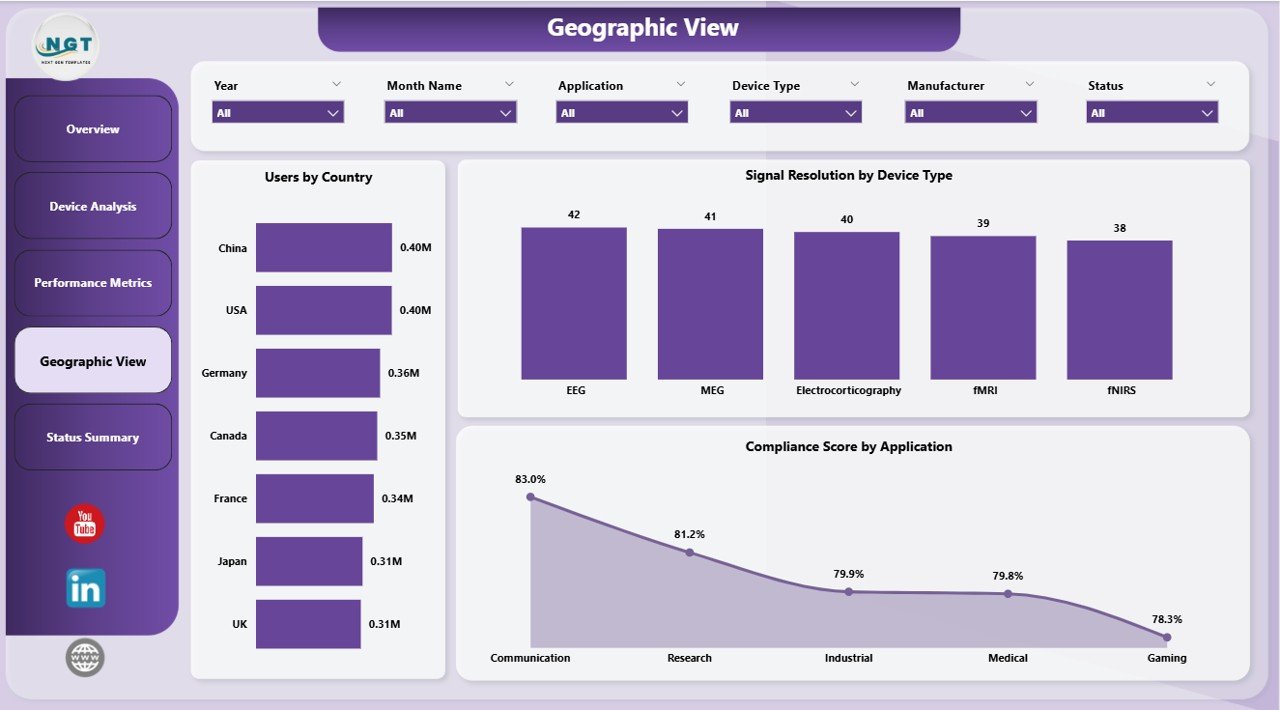
The Geographic View Page provides a global perspective of BCI data.
Key Charts:
- 🌎 Users by Country
- 📡 Signal Resolution by Device Type
- ✅ Compliance Score by Application
👉 This helps you understand regional performance trends and optimize global operations.
5️⃣ Status Summary – Performance Health Check
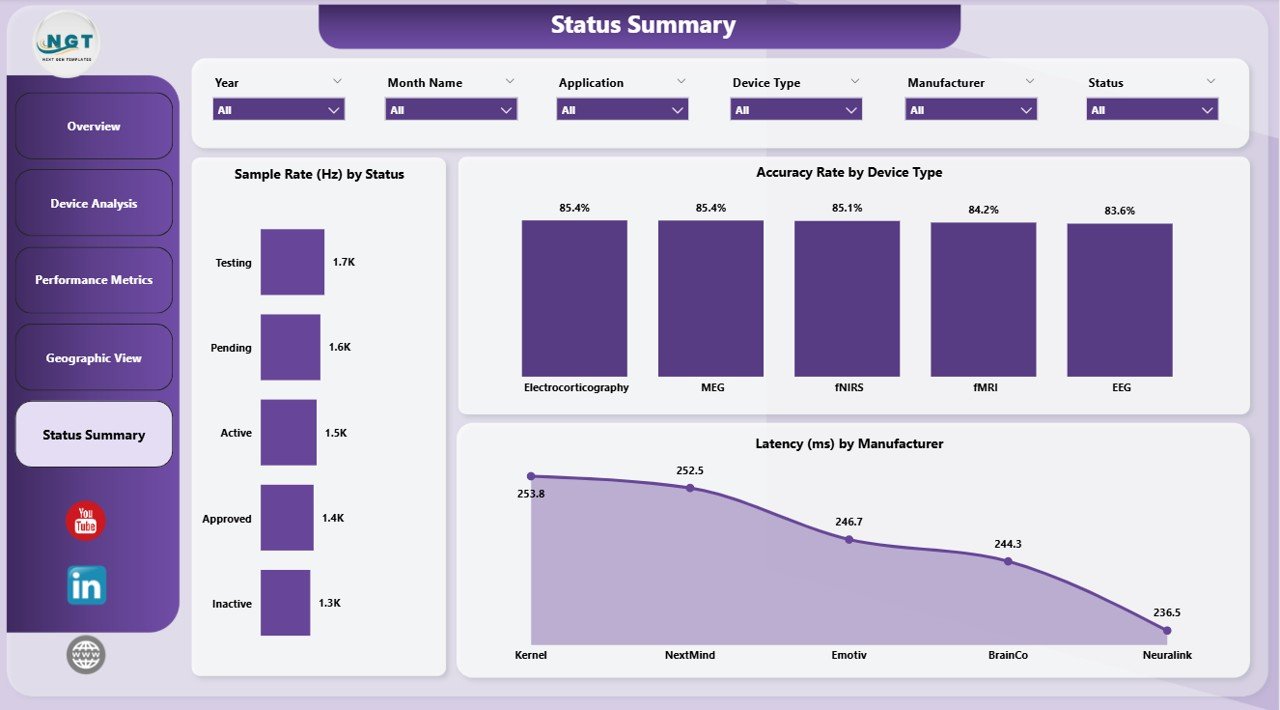
The Status Summary Page focuses on operational health and system performance.
Key Charts:
- 📊 Sample Rate by Status
- 🎯 Accuracy Rate by Device Type
- ⚡ Latency by Manufacturer
👉 As a result, you can quickly identify performance issues and take corrective actions.
🌟 Advantages of Brain-Computer Interfaces Dashboard in Power BI
Using this dashboard offers several powerful benefits.
✅ Improved Data Visibility
- You can view all critical metrics in one place
- You can eliminate scattered data sources
✅ Faster Decision-Making
- You can access real-time insights
- You can respond quickly to performance issues
✅ Enhanced Performance Monitoring
- You can track accuracy, latency, and compliance
- You can identify trends instantly
✅ Better Resource Optimization
- You can analyze cost by application and manufacturer
- You can allocate resources efficiently
✅ User-Friendly Interface
- You can interact with slicers and filters
- You can customize views easily
📈 How Does This Dashboard Improve BCI Operations?
This dashboard not only visualizes data but also enhances operations.
Here’s how:
- 🔍 You can identify underperforming devices
- 📊 You can analyze user engagement trends
- 🌍 You can optimize geographic strategies
- ⚡ You can reduce latency issues
- 🎯 You can improve system accuracy
Therefore, it plays a crucial role in improving both performance and efficiency.
🛠️ Best Practices for the Brain-Computer Interfaces Dashboard in Power BI
To get the most out of this dashboard, you should follow these best practices:
✅ Keep Data Updated
- Always refresh data regularly
- Ensure accuracy and consistency
✅ Use Filters Effectively
- Apply slicers for better analysis
- Focus on specific metrics or regions
✅ Monitor Key KPIs Regularly
- Track accuracy, latency, and compliance
- Identify changes quickly
✅ Customize Based on Needs
- Modify visuals according to your use case
- Add new KPIs if required
✅ Train Your Team
- Ensure users understand dashboard features
- Encourage data-driven decision-making
⚙️ Who Can Benefit from This Dashboard?
This dashboard serves multiple industries and professionals.
👨⚕️ Healthcare Organizations
- Monitor patient-related BCI data
- Improve treatment outcomes
🧪 Research Institutions
- Analyze experimental data
- Track performance metrics
🧑💻 Tech Companies
- Optimize device performance
- Improve product development
🏭 Manufacturers
- Evaluate device efficiency
- Reduce production costs
📊 Use Cases of BCI Dashboard
Click to Purchases Brain-Computer Interfaces Dashboard in Power BI
This dashboard supports various real-world applications.
🔬 Neuroscience Research
- Track brain signal patterns
- Analyze experimental results
🧠 Healthcare Monitoring
- Monitor patient brain activity
- Improve diagnostics
🎮 Gaming & VR
- Analyze user interaction
- Enhance user experience
🤖 Robotics & AI
- Improve machine learning models
- Optimize control systems
🔮 Future of Brain-Computer Interfaces with Power BI
As technology evolves, BCI systems will become more advanced. Therefore, dashboards like this will play a critical role.
भविष्य की संभावनाएँ:
- 🚀 Real-time brain signal analysis
- 🤖 Integration with AI and machine learning
- 🌐 Global connectivity and data sharing
- 📊 Advanced predictive analytics
Thus, combining BCI with Power BI will unlock endless possibilities.
🏁 Conclusion
The Brain-Computer Interfaces Dashboard in Power BI is a powerful tool that transforms complex BCI data into actionable insights. Not only does it simplify data analysis, but it also improves performance monitoring, decision-making, and operational efficiency.
Moreover, with its interactive visuals, multiple analytical pages, and user-friendly interface, this dashboard becomes an essential asset for organizations working in BCI technology.
👉 If you want to unlock the full potential of your BCI data, this dashboard is the perfect solution.
❓ Frequently Asked Questions (FAQs)
1. What is a Brain-Computer Interfaces Dashboard?
A Brain-Computer Interfaces Dashboard is a tool that helps visualize and analyze BCI data using charts, KPIs, and filters.
2. Why should I use Power BI for BCI dashboards?
Power BI provides interactive visuals, real-time data updates, and advanced analytics features.
3. Can I customize this dashboard?
Yes, you can easily modify charts, KPIs, and filters based on your needs.
4. Is this dashboard suitable for beginners?
Yes, the dashboard is user-friendly and easy to use, even for beginners.
5. What data is required for this dashboard?
You need data related to device performance, users, accuracy, cost, and compliance.
6. How often should I update the dashboard?
You should update it regularly to ensure accurate and real-time insights.
7. Can this dashboard handle large datasets?
Yes, Power BI efficiently handles large volumes of data.
Visit our YouTube channel to learn step-by-step video tutorials
Click to Purchases Brain-Computer Interfaces Dashboard in Power BI