In today’s digital world, streaming platforms grow faster than ever. However, managing huge amounts of user data, subscription trends, and content performance can feel overwhelming. So, how can you track everything in one place and make smarter business decisions?
👉 The answer is simple: Video-on-Demand (VoD) Dashboard in Power BI.
Click to buy Video-on-Demand (VoD) Dashboard in Power BI
This powerful dashboard helps you monitor revenue, cost, user behavior, and content performance with clarity. Moreover, it turns complex data into simple visuals so you can act quickly and confidently.
In this article, you will learn everything about the VoD Dashboard in Power BI, including its features, benefits, best practices, and much more.
What is a Video-on-Demand (VoD) Dashboard in Power BI?
A Video-on-Demand (VoD) Dashboard in Power BI is an interactive reporting tool designed to track and analyze streaming platform performance.
Instead of manually reviewing multiple reports, this dashboard allows you to:
- Monitor revenue, cost, and profit in real-time
- Analyze content performance by genre
- Understand user behavior across devices
- Track regional engagement
- View monthly trends and growth
Therefore, it simplifies decision-making and improves business performance.
Why Do You Need a VoD Dashboard in Power BI?
Managing a VoD platform without proper analytics can lead to missed opportunities. However, with a structured dashboard, you gain full control.
Here’s why you need it:
- Track business performance in one place
- Identify top-performing genres and regions
- Improve user engagement strategies
- Optimize subscription plans
- Increase profitability with data-driven insights
As a result, you can scale your streaming business efficiently.
Key Features of Video-on-Demand (VoD) Dashboard in Power BI
This dashboard consists of 5 powerful and fully interactive pages, each designed to provide deep insights.
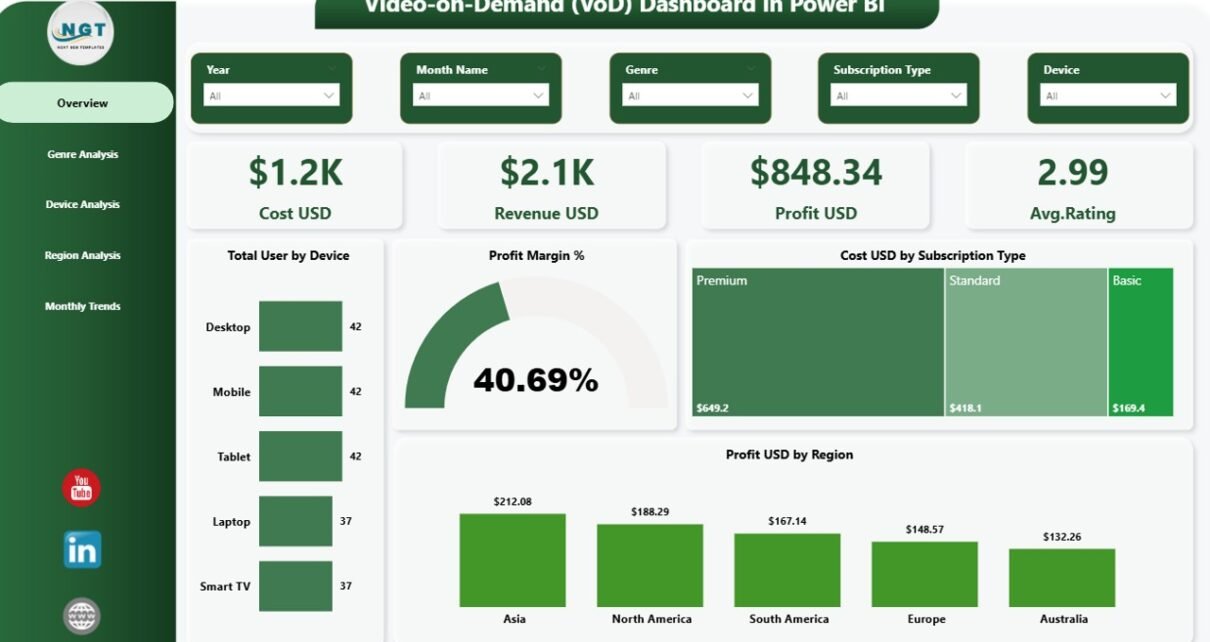
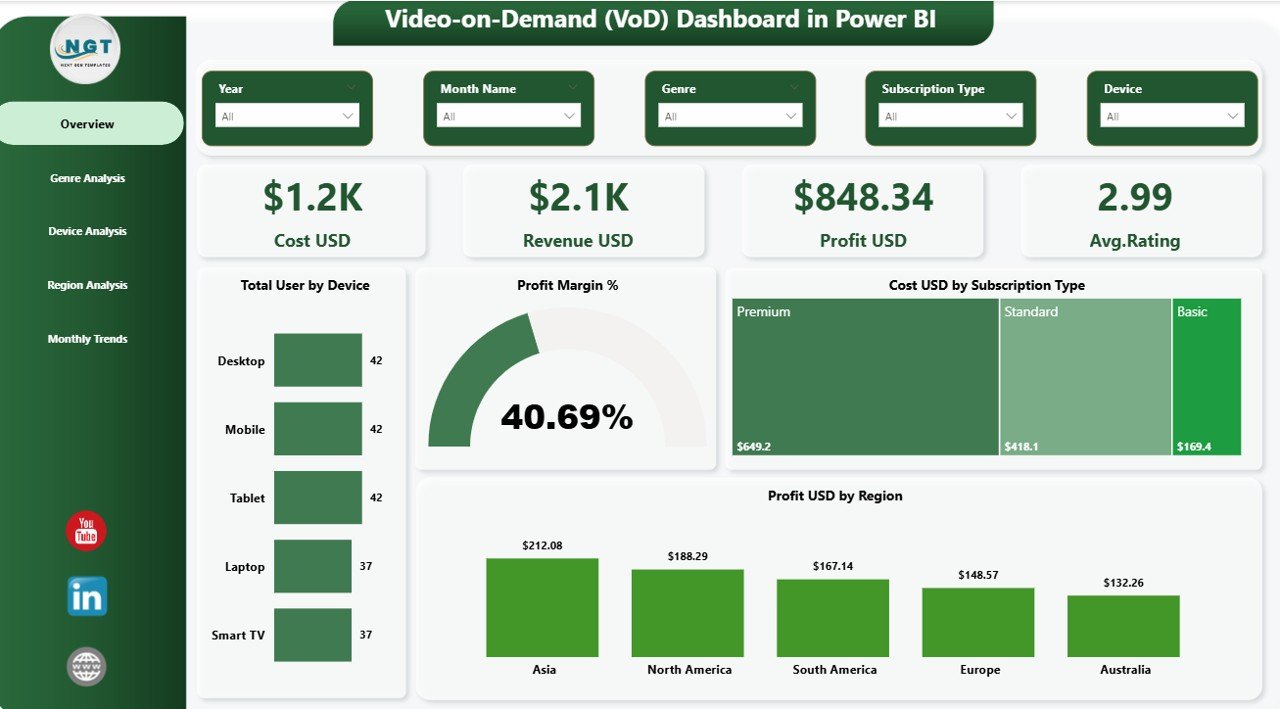
Overview Page – Your Business Snapshot
The Overview Page acts as the central hub of the dashboard. It gives you a quick summary of your platform’s performance.
KPI Cards:
- (USD)
- Revenue (USD)
- Profit (USD)
- Average Rating
These KPIs help you understand overall performance instantly.
Charts Included:
- Total Users by Device
- Profit Margin (%)
- Cost by Subscription Type
- Profit by Region
Filters (Slicers):
- Easily filter data based on different dimensions
Therefore, you get a complete high-level view in seconds.
Click to buy Video-on-Demand (VoD) Dashboard in Power BI
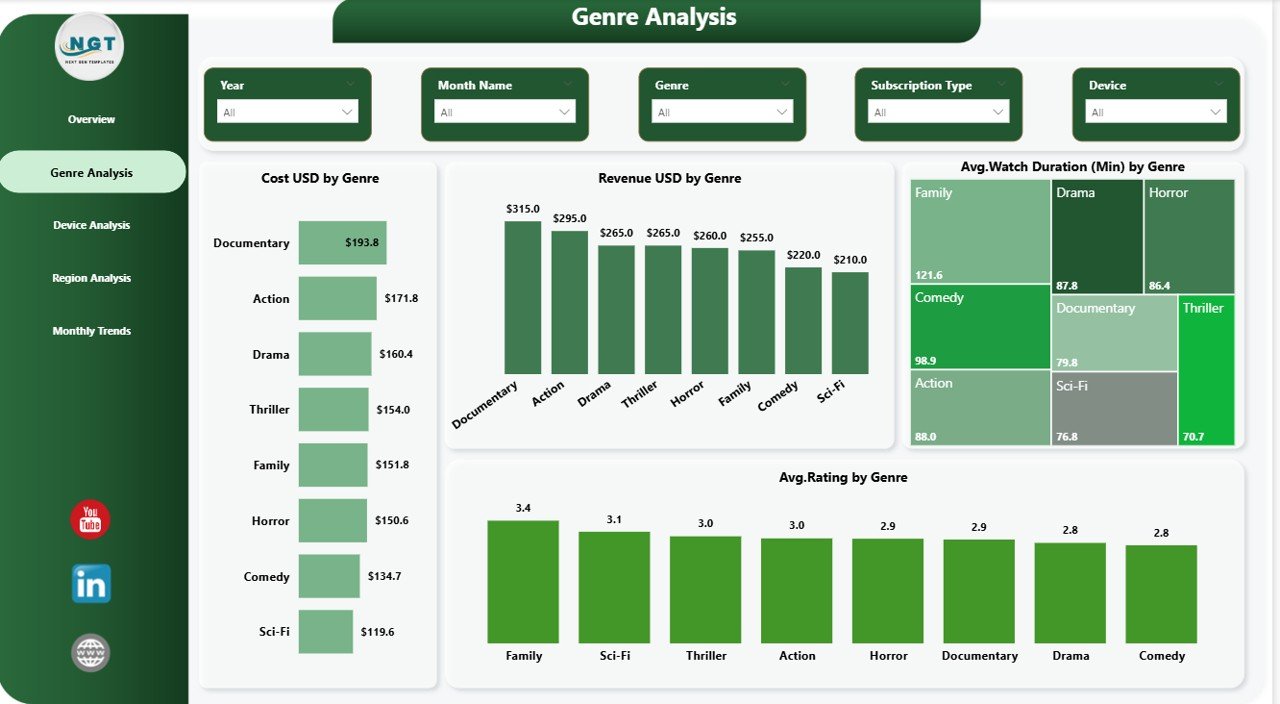
Genre Analysis – Which Content Performs Best?
Content is the heart of any VoD platform. So, analyzing genres becomes essential.
Charts Included:
- Cost by Genre
- Revenue by Genre
- Average Watch Duration (Minutes) by Genre
- Average Rating by Genre
With this page, you can:
- Identify popular genres
- Allocate budget wisely
- Improve content strategy
As a result, you deliver what your audience truly wants.
Click to buy Video-on-Demand (VoD) Dashboard in Power BI
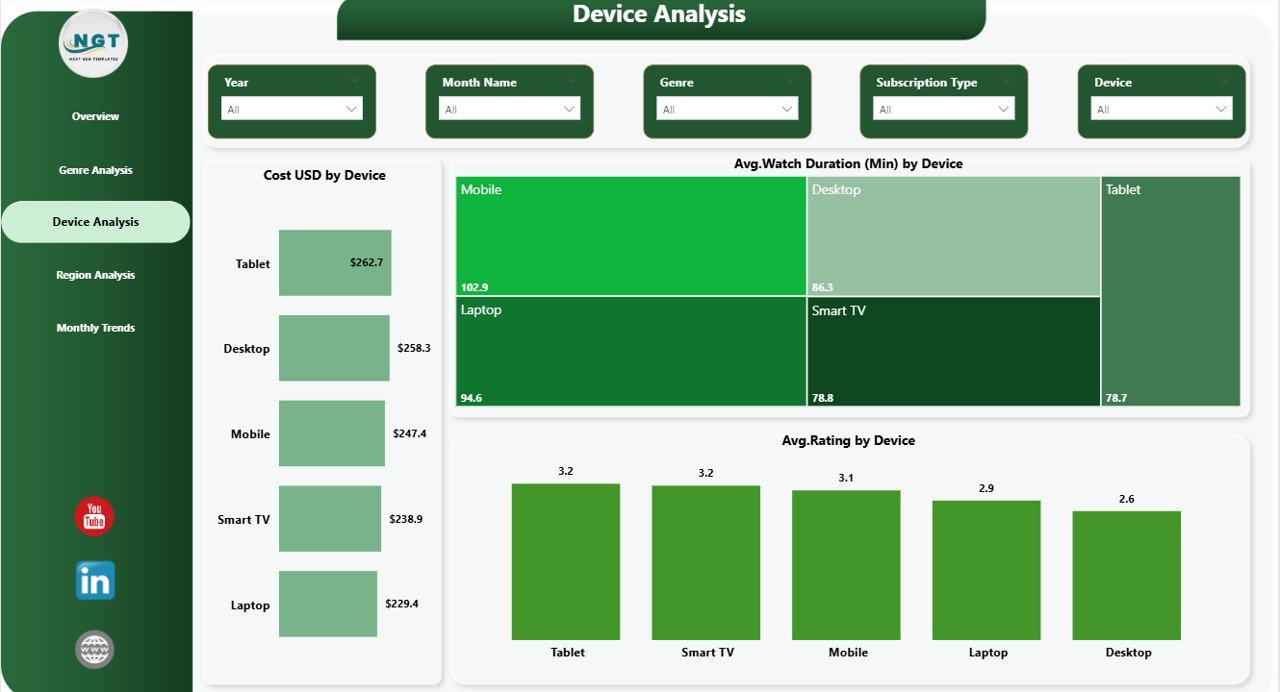
Device Analysis – Where Are Users Watching?
Users consume content on different devices. Therefore, understanding device usage is critical.
🔹 Charts Included:
- Cost by Device
- Average Watch Duration by Device
- Average Rating by Device
Slicers Available:
- Filter data easily for deeper insights
This helps you:
- Optimize user experience across devices
- Focus on high-performing platforms
- Improve app performance
Click to buy Video-on-Demand (VoD) Dashboard in Power BI
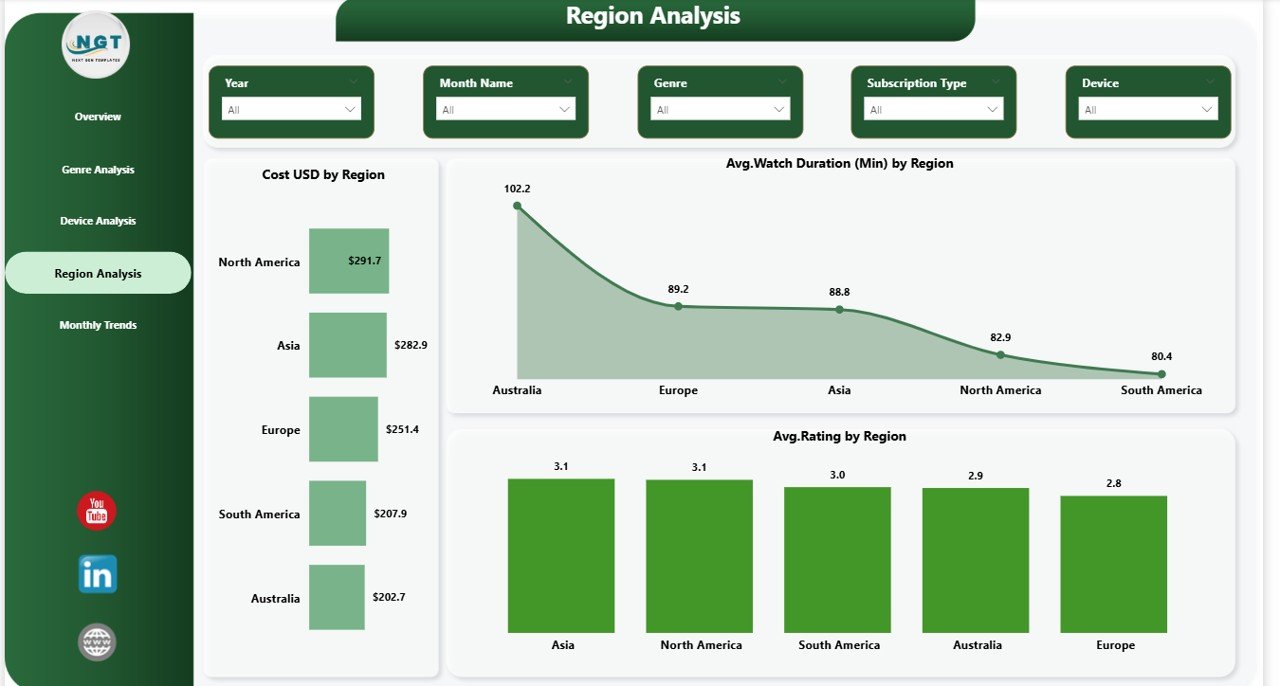
Region Analysis – Where Is Your Audience?
Expanding globally requires understanding regional performance.
Charts Included:
- Cost by Region
- Average Watch Duration by Region
- Average Rating by Region
Slicers:
- Filter by region and other parameters
With this page, you can:
- Identify high-performing markets
- Plan regional marketing strategies
- Improve localization efforts
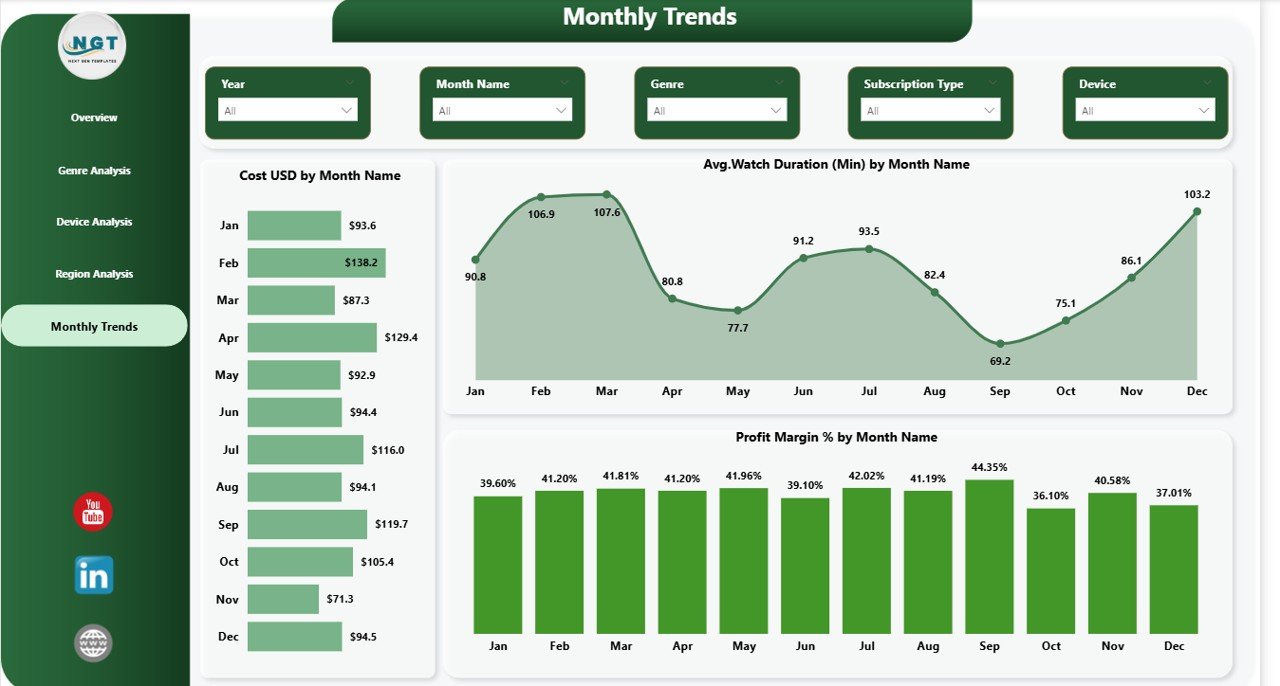
Monthly Trend – How Is Your Business Growing?
Tracking trends over time helps you plan better.🔹 Charts Included:
- Cost by Month
- Average Watch Duration by Month
- Profit Margin (%) by Month
Slicers:
- Select specific time periods
Therefore, you can:
- Identify seasonal trends
- Measure growth
- Forecast future performance
Click to buy Video-on-Demand (VoD) Dashboard in Power BI
Advantages of Video-on-Demand (VoD) Dashboard in Power BI
Using a VoD dashboard provides multiple benefits. Let’s explore them.
1. Centralized Data Management
- All data stays in one place
- No need to switch between multiple files
2. Real-Time Insights
- Instantly view updated data
- Make faster decisions
3. Better Content Strategy
- Identify top-performing genres
- Focus on high-demand content
4. Improved User Experience
- Analyze device usage
- Optimize platform performance
5. Increased Profitability
- Track revenue and cost
- Improve profit margins
6. Easy Customization
- Modify dashboard as per business needs
- Add new KPIs anytime
How Does the VoD Dashboard Work?
Understanding how the dashboard works helps you use it effectively.
Step-by-Step Process:
- Data Input
- Import data into Power BI
- Data Transformation
- Clean and structure data
- Visualization
- Create charts and KPIs
- Analysis
- Use slicers and filters
- Decision Making
- Take action based on insights
Therefore, the entire process becomes smooth and efficient.
How Can Businesses Use This Dashboard Effectively?
Different stakeholders can use this dashboard in various ways.
For Business Owners:
- Monitor overall performance
- Track profit and revenue
For Content Teams:
- Analyze genre performance
- Plan new content
For Marketing Teams:
- Identify target regions
- Optimize campaigns
For Technical Teams:
- Improve device performance
- Fix user experience issues
What KPIs Should You Track in a VoD Dashboard?
Tracking the right KPIs ensures success.
Key KPIs Include:
- Revenue (USD)
- Cost (USD)
- Profit (USD)
- Average Rating
- Watch Duration
- Profit Margin (%)
- Users by Device
- Regional Performance
These KPIs give you a complete business overview.
Best Practices for the Video-on-Demand (VoD) Dashboard in Power BI
To get the best results, follow these best practices:
Keep the Dashboard Simple
- Avoid clutter
- Use clean visuals
Use Interactive Filters
- Add slicers for better analysis
- Allow users to explore data
Focus on Key Metrics
- Highlight important KPIs
- Avoid unnecessary data
Update Data Regularly
- Ensure accuracy
- Maintain consistency
Use Clear Labels
- Make charts easy to understand
- Avoid confusion
Optimize Performance
- Reduce loading time
- Use efficient data models
Opportunities for Improvement in VoD Dashboard
Even the best dashboards can improve. Here’s how:
Add Predictive Analytics
- Forecast future trends
- Improve planning
Integrate AI Insights
- Use smart recommendations
- Enhance decision-making
Include Customer Segmentation
- Analyze user groups
- Improve personalization
Enhance Visualization
- Use advanced charts
- Improve storytelling
How Does Power BI Enhance VoD Analytics?
Power BI offers powerful features that improve your dashboard experience.
Key Capabilities:
- Interactive Visualizations
- Real-Time Data Updates
- Drill-Down Analysis
- Data Integration from Multiple Sources
Therefore, Power BI becomes the perfect tool for VoD analytics.
Conclusion
The Video-on-Demand (VoD) Dashboard in Power BI is a game-changing solution for streaming platforms. It simplifies data analysis, improves decision-making, and enhances overall performance.
With features like Overview, Genre Analysis, Device Analysis, Region Analysis, and Monthly Trends, you gain complete visibility into your business.
Moreover, by following best practices and continuously improving the dashboard, you can unlock even greater value.
So, if you want to grow your VoD platform, this dashboard is a must-have tool.
Frequently Asked Questions (FAQs)
1. What is a VoD dashboard in Power BI?
A VoD dashboard in Power BI is a tool that helps track and analyze streaming platform performance using interactive visuals.
2. Who can use this dashboard?
Business owners, analysts, content teams, and marketers can use it to improve decision-making.
3. What data is required for this dashboard?
You need data related to users, revenue, cost, watch time, ratings, and regions.
4. Can I customize the dashboard?
Yes, you can easily modify KPIs, charts, and filters based on your needs.
5. Is Power BI suitable for VoD analytics?
Yes, Power BI provides powerful visualization and data analysis features.
6. How often should I update the dashboard?
You should update it regularly, preferably daily or weekly, to maintain accuracy.
7. What are the key benefits of using this dashboard?
It improves performance tracking, enhances decision-making, and increases profitability.
Visit our YouTube channel to learn step-by-step video tutorials
Click to buy Video-on-Demand (VoD) Dashboard in Power BI