Crypto Portfolio Dashboard in Excel
Crypto Portfolio Dashboard in Excel is a powerful, professionally designed cryptocurrency analytics template that helps investors, traders, and portfolio managers track their entire crypto portfolio from a single Excel workbook. Whether you hold Bitcoin, Ethereum, altcoins, or a mix of tokens across multiple exchanges, this dashboard gives you instant visibility into Total Investment, Total Current Value, Total Fees, and ROI % — all updated dynamically through pivot tables and slicers. This is one of the most feature-rich Excel Dashboard Templates available for cryptocurrency portfolio management.
In this blog post, we will walk you through every page of the Crypto Portfolio Dashboard in Excel, explain the key features, charts, and KPIs, and show you how to get started with your own data. If you are looking for the best way to track crypto investments in Excel, this template has everything you need.
Key Features of the Crypto Portfolio Dashboard in Excel
- 5 Interactive Dashboard Pages — Overview, Portfolio Analysis, Performance, Exchange Analysis, and Risk Overview provide 360-degree visibility into your crypto holdings
- 5 Key Financial KPIs — Track Total Records, Total Investment, Total Current Value, Total Fees, and ROI % at a glance from the Overview page
- 12+ Professional Charts — Each dashboard page features multiple visualizations covering investment trends, performance metrics, exchange comparisons, and risk analysis
- Dynamic Slicers — Filter the entire dashboard instantly by Wallet Type, Exchange, Category, Risk Level, and other dimensions
- Pivot-Powered Engine — All charts are connected to pivot tables that auto-refresh when you update your data in the Data Sheet
- Win Rate % Tracking — Monitor your overall trading success rate directly on the Overview page
- Multi-Exchange Support — Track investments across Binance, Coinbase, Kraken, and any other exchange
- Risk Assessment — Evaluate portfolio risk by analyzing ROI and Gain/Loss across different risk levels
Dashboard Pages Explanation
1. Overview Page
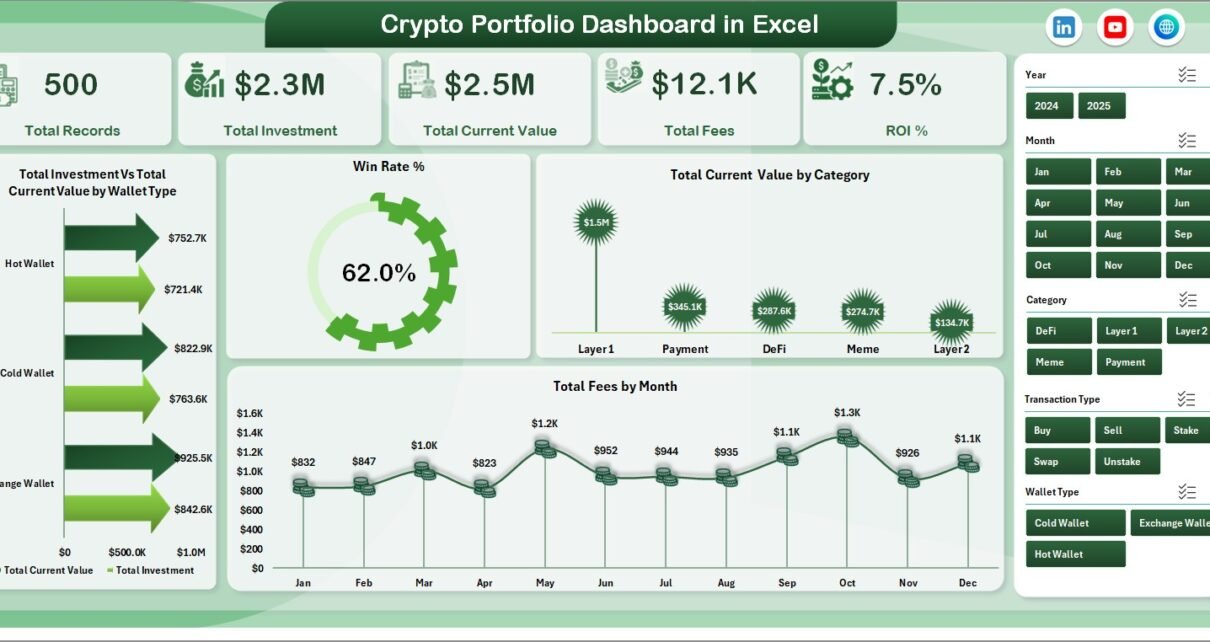
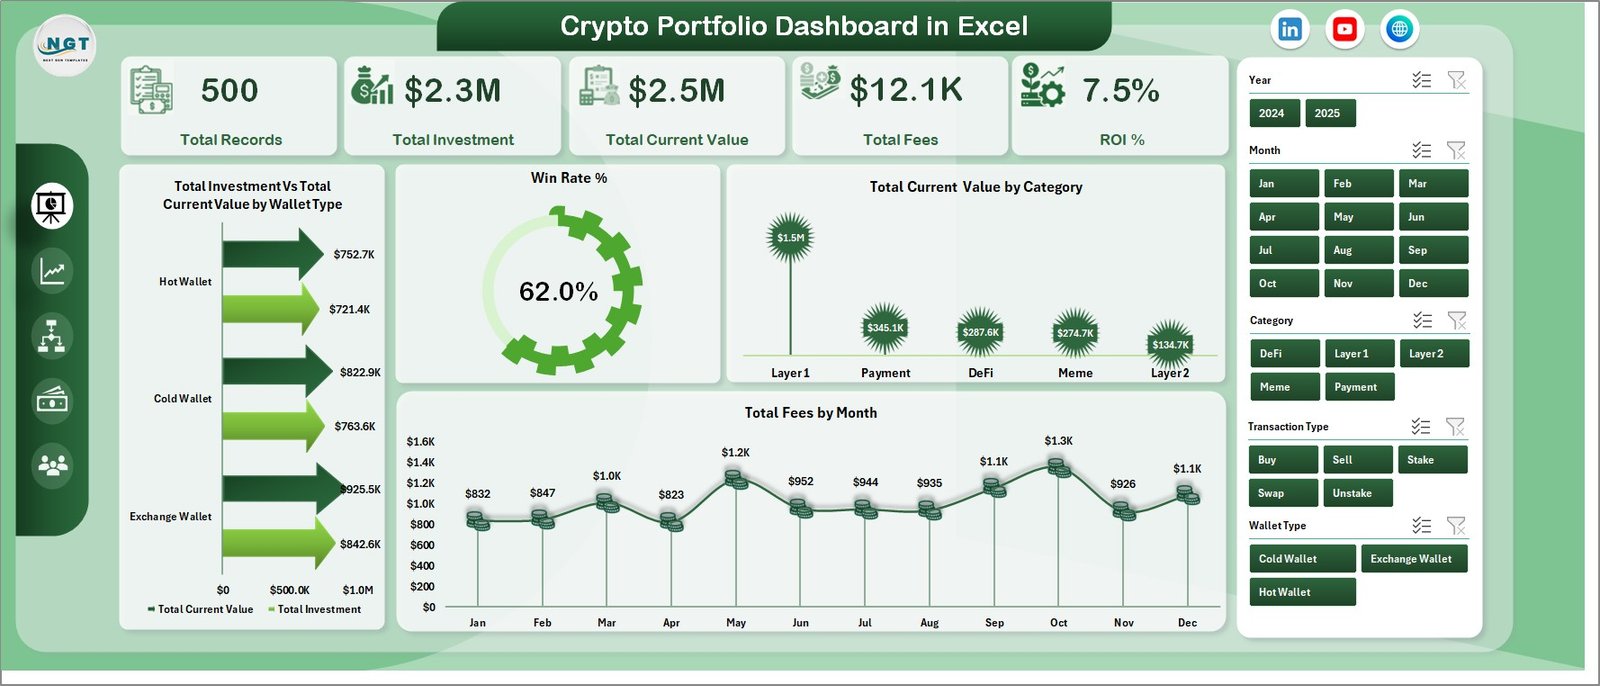
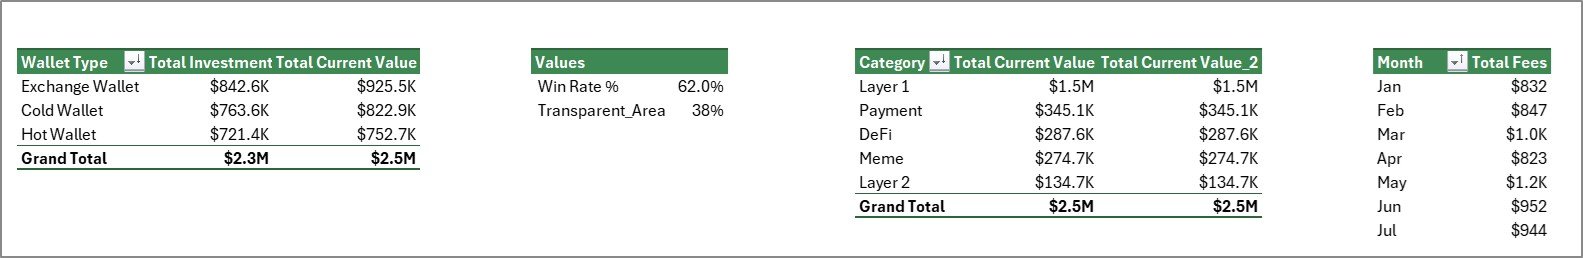
The Overview page serves as the command center of your Crypto Portfolio Dashboard in Excel. At the top, you will find 5 KPI cards displaying Total Records, Total Investment, Total Current Value, Total Fees, and ROI %. These cards give you an immediate snapshot of your entire crypto portfolio health.
Below the KPI cards, the Overview page features four key charts. The Total Investment Vs Total Current Value by Wallet Type chart compares how much you invested versus the current market value across different wallet types such as hot wallets, cold wallets, and exchange wallets. The Win Rate % chart shows your overall percentage of profitable trades. The Total Current Value by Category chart breaks down your holdings by cryptocurrency category. Finally, the Total Fees by Month chart helps you track how much you are spending on transaction fees over time.
Multiple slicers are available on this page allowing you to filter the entire dashboard by various dimensions for quick, targeted analysis.
Crypto Portfolio Dashboard in Excel
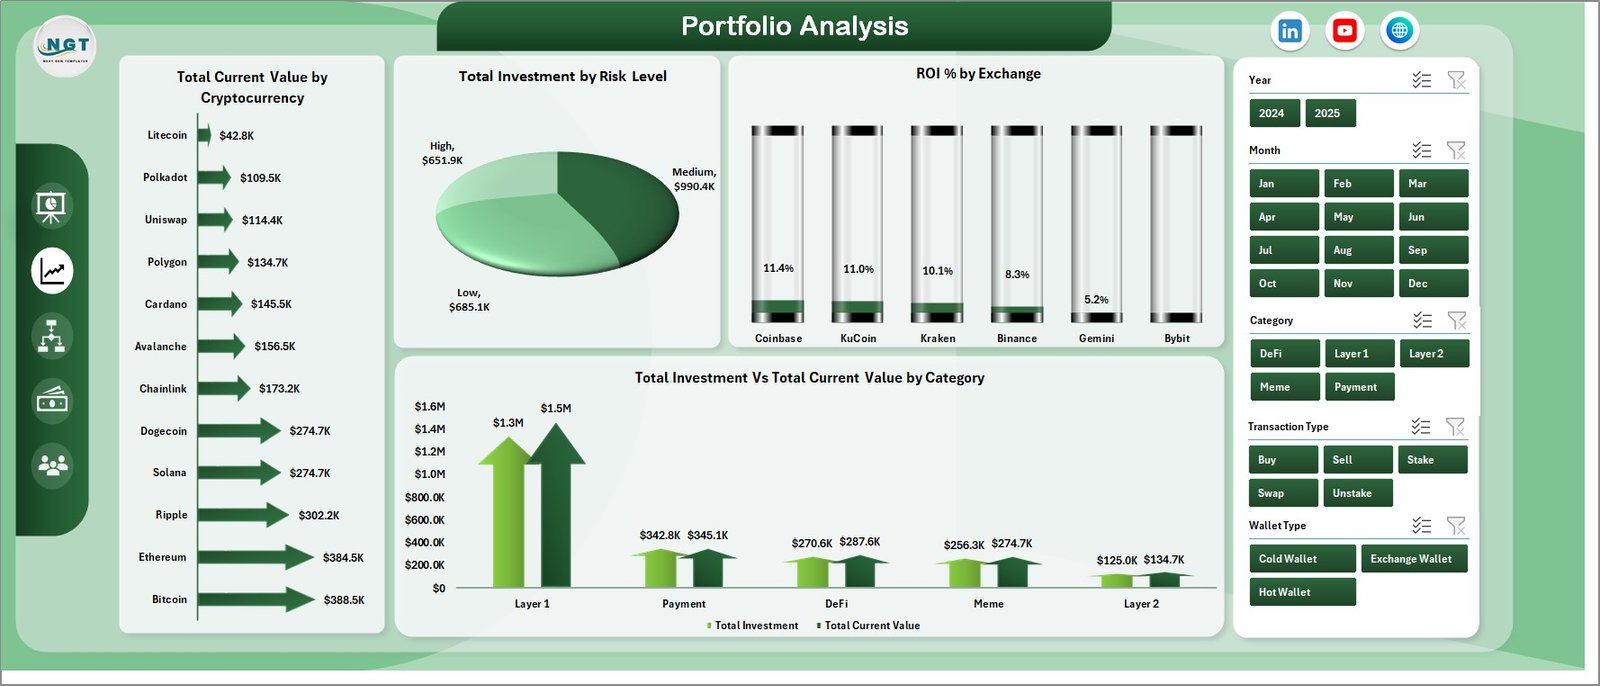
2. Portfolio Analysis
The Portfolio Analysis page provides a deeper look into your investment distribution and returns. It features four analytical charts: Total Current Value by Cryptocurrency shows which coins hold the most value in your portfolio, Total Investment by Risk Level reveals how your capital is allocated across low, medium, and high risk assets, ROI % by Exchange helps you identify which exchanges deliver the best returns, and Total Investment Vs Total Current Value by Category compares your original investment against current value across different crypto categories.
Portfolio Analysis
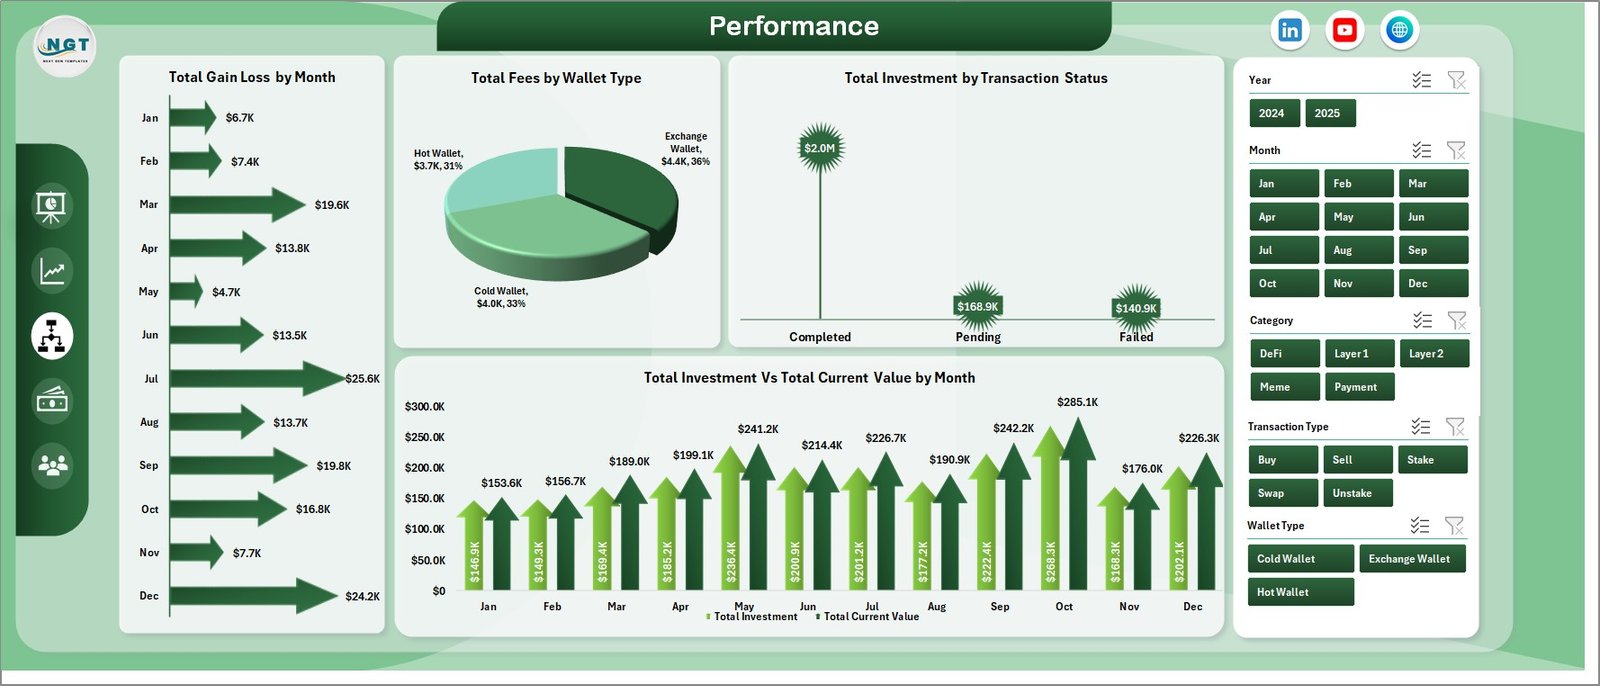
3. Performance
The Performance page focuses on time-based trends and transaction-level insights. Total Gain/Loss by Month tracks your monthly profit and loss patterns, helping you spot seasonal trends. Total Fees by Wallet Type shows fee distribution across your wallets. Total Investment by Transaction Status breaks down your investments by their current status. Total Investment Vs Total Current Value by Month gives you a month-over-month comparison of invested capital versus current market value.
Performance
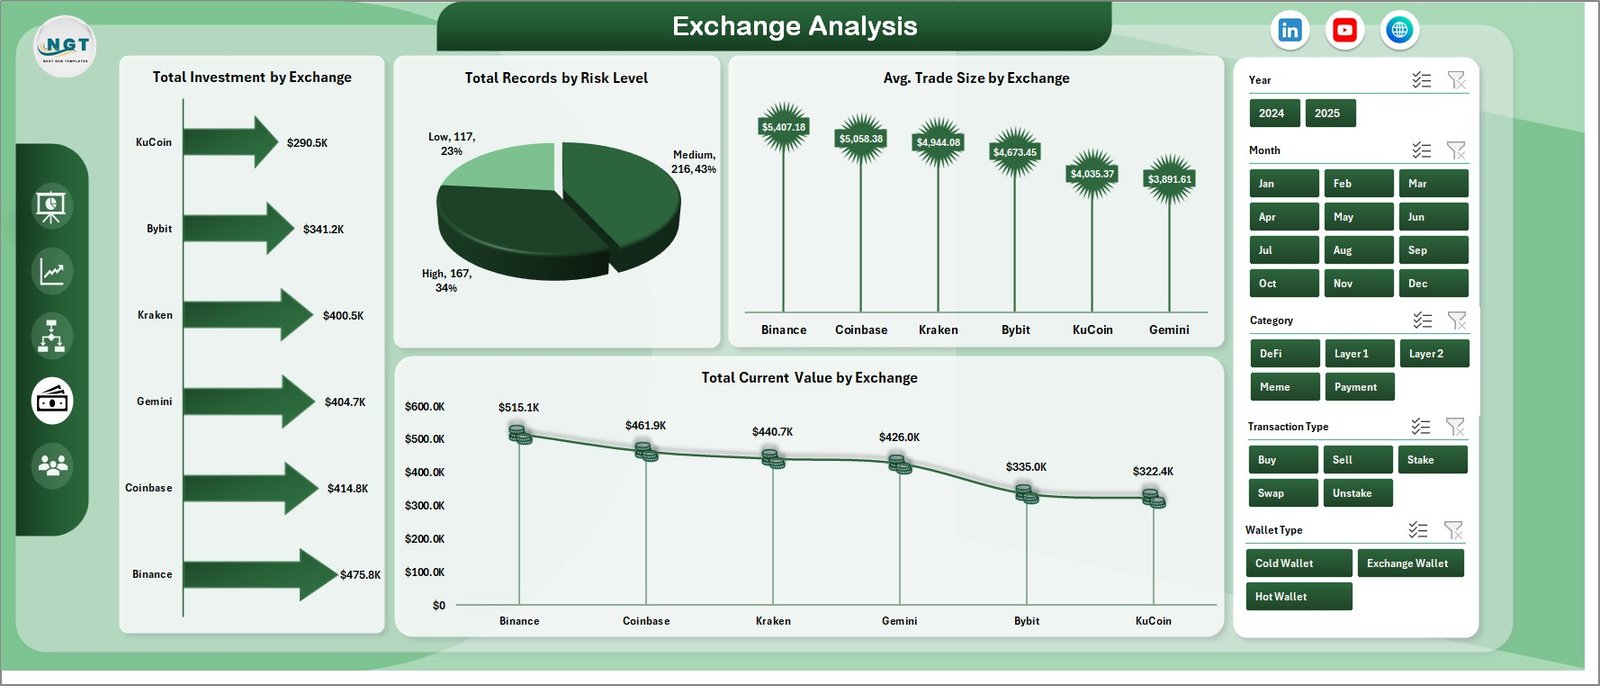
4. Exchange Analysis
The Exchange Analysis page is designed for traders who use multiple platforms. Total Investment by Exchange shows capital distribution across exchanges. Total Records by Risk Level indicates how many transactions fall into each risk category. Avg. Trade Size by Exchange reveals your average trade value per platform, useful for understanding trading behavior. Total Current Value by Exchange shows your current holdings value on each exchange.
Exchange Analysis
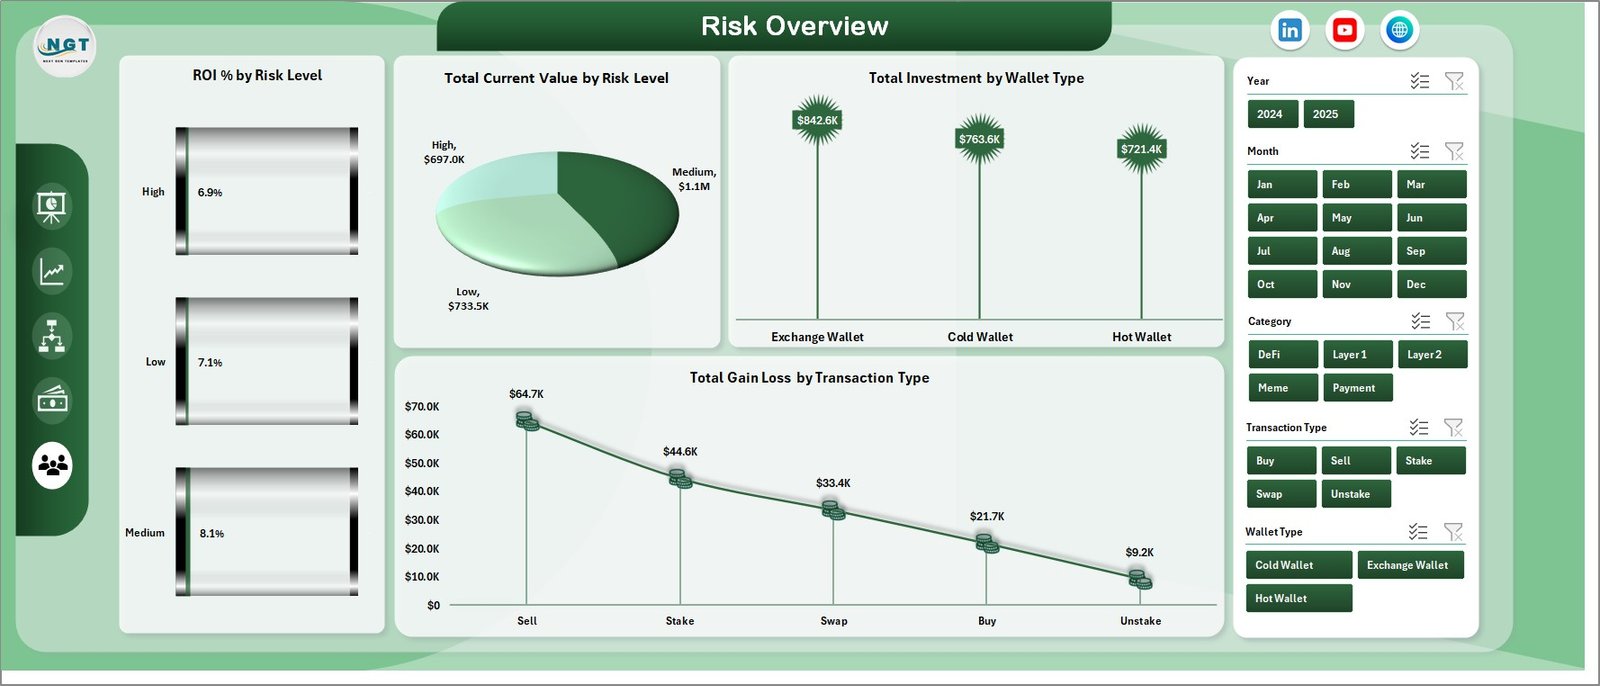
5. Risk Overview
The Risk Overview page helps you evaluate and manage portfolio risk. ROI % by Risk Level shows returns for each risk tier, Total Current Value by Risk Level reveals capital exposure by risk category, Total Investment by Wallet Type provides another lens on diversification, and Total Gain/Loss by Transaction Type breaks down profits and losses by how transactions were executed. This page is essential for anyone serious about managing downside risk in their crypto portfolio.
Risk Overview
6. Data Sheet
The Data Sheet is where you enter all your crypto transaction data. Simply add your records in the same format as the sample data provided — including fields like cryptocurrency name, exchange, wallet type, investment amount, current value, fees, transaction type, risk level, and date. The dashboard reads directly from this sheet.
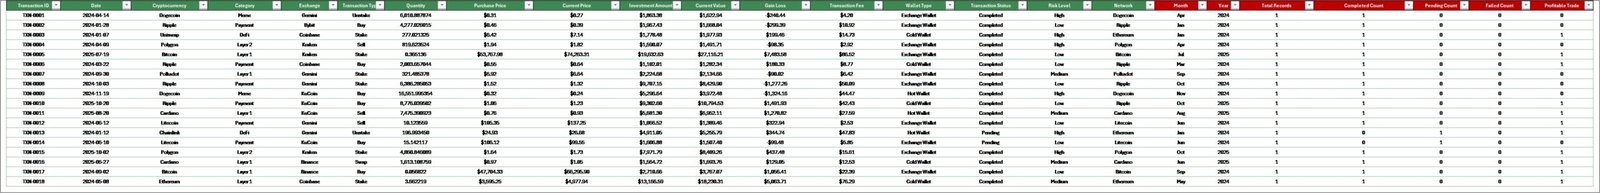
Data Sheet Tab
7. Support Sheet
The Support Sheet contains all the pivot tables that dynamically power every chart in the dashboard. After updating your data in the Data Sheet, simply go to the Data tab in the Excel Ribbon and click Refresh All. Every pivot table will recalculate and every chart will update automatically. You can keep this sheet hidden during regular use.
Support Sheet Tab
Advantages of Crypto Portfolio Dashboard in Excel
- All-in-One Tracking — No need for multiple tools or apps when you can track everything from investments to risk in a single Excel file
- No Internet Required — Unlike web-based crypto trackers, this dashboard works entirely offline in Microsoft Excel
- Full Data Ownership — Your transaction data stays on your computer with complete privacy and control
- Professional Visualizations — Clean, modern charts designed for presentations, reports, and personal analysis
- Scalable — Add as many transaction records as you need and the pivot engine handles the rest
Opportunities for Improvement
- Adding real-time API integration for live crypto prices would enhance accuracy
- A tax reporting summary page could help investors prepare for capital gains filing
- Historical price trend charts for individual coins would provide deeper technical analysis
- Adding a watchlist or alerts section for target buy/sell prices would benefit active traders
Best Practices
- Update Data Regularly — Enter new transactions promptly and click Refresh All to keep the dashboard current
- Use Consistent Naming — Ensure cryptocurrency names, exchanges, and wallet types match exactly to avoid duplicate entries in pivot tables
- Back Up Your File — Keep copies of your dashboard file to prevent data loss
- Explore Slicers — Use the dynamic slicers on the Overview page to drill into specific segments of your portfolio
- Hide the Support Sheet — Keep it hidden for a cleaner experience but do not delete it as it powers all the charts
Explore Relevant Templates
- Net Worth Tracker in Excel — Track your complete financial net worth including all assets and liabilities
- Personal Finance KPI Scorecard in Excel — Monitor savings goals, expenses, and financial health with KPI scorecards
- Debt Management KPI Scorecard in Excel — Track debt repayment progress with clear visual KPIs
- Small Business CFO Dashboard in Excel — Complete financial analytics for small business owners and CFOs
- Blockchain & Cryptocurrency Dashboard in Excel — Another powerful crypto analytics template with blockchain metrics
Frequently Asked Questions
What is the best Excel template for tracking a crypto portfolio?
The Crypto Portfolio Dashboard in Excel is one of the best templates available for tracking cryptocurrency investments. It includes 5 interactive dashboard pages, 12+ charts, dynamic slicers, and tracks key metrics like Total Investment, Current Value, ROI %, and Win Rate % across multiple exchanges and wallet types.
How do I track my cryptocurrency investments in Excel?
Enter your transaction data in the Data Sheet tab with details like cryptocurrency name, exchange, wallet type, investment amount, and current value. Then click Refresh All in the Data tab to update all pivot tables and charts automatically. The dashboard provides instant visual analysis across 5 pages.
Can I use this crypto dashboard to compare performance across exchanges?
Yes. The Exchange Analysis page is specifically designed for multi-exchange comparison. It shows Total Investment by Exchange, Avg. Trade Size by Exchange, Total Current Value by Exchange, and Total Records by Risk Level to help you evaluate which platforms deliver the best results.
Does this template work with Excel on Mac?
This template is optimized for Microsoft Excel desktop on Windows. While it may open on Mac, some features like slicers and pivot chart formatting may behave differently. For the best experience, use Excel 2016 or later on Windows.
How often should I update my crypto portfolio data?
For active traders, updating daily or after each significant trade is recommended. For long-term holders, weekly or monthly updates are sufficient. After each update, click Refresh All in the Data tab to recalculate all dashboard metrics.
Is my crypto data secure in this Excel template?
Yes. The Crypto Portfolio Dashboard in Excel runs entirely offline on your computer. Your data never leaves your device, unlike cloud-based portfolio trackers. You maintain full ownership and control of your financial information.
Conclusion
The Crypto Portfolio Dashboard in Excel is a must-have tool for anyone serious about managing their cryptocurrency investments professionally. With 5 interactive dashboard pages, 12+ charts, dynamic slicers, and a pivot-powered engine, it delivers everything you need to track performance, analyze risk, compare exchanges, and monitor ROI — all from a single Excel file.
Click here to Purchase the Crypto Portfolio Dashboard in Excel
Visit our YouTube channel for step-by-step video tutorials: Youtube.com/@PK-AnExcelExpert