Drone Farming Startups Dashboard in Excel is built for agritech founders, drone service operators, agriculture consultants, and startup analysts who need a clear way to track drone farming performance without building an Excel reporting system from scratch. A drone farming startup may run hundreds of field operations across spraying, mapping, scouting, seeding, crop monitoring, and regional farm visits. This dashboard turns those records into KPI cards, slicers, charts, and trend views so managers can review revenue, operating cost, net profit, total area covered, total operations, completion percentage, incident percentage, and average satisfaction in one workbook.
For official guidance on the platform, see Microsoft Excel Help & Learning.
Key Features of Drone Farming Startups Dashboard in Excel
- 5 KPI cards on the Overview page for Total Revenue, Net Profit, Total Area Covered, Total Operations, and Avg. Satisfaction.
- 5 dashboard pages covering Overview, Service Analysis, Regional Insights, Startup Performance, and Monthly Trend.
- Service-type analysis for profit margin, satisfaction, operation count, revenue, and operating cost.
- Regional reporting for area covered, margin, satisfaction, and startup revenue by geography.
- Startup benchmarking for net profit, completion percentage, incident percentage, and monthly profit movement.
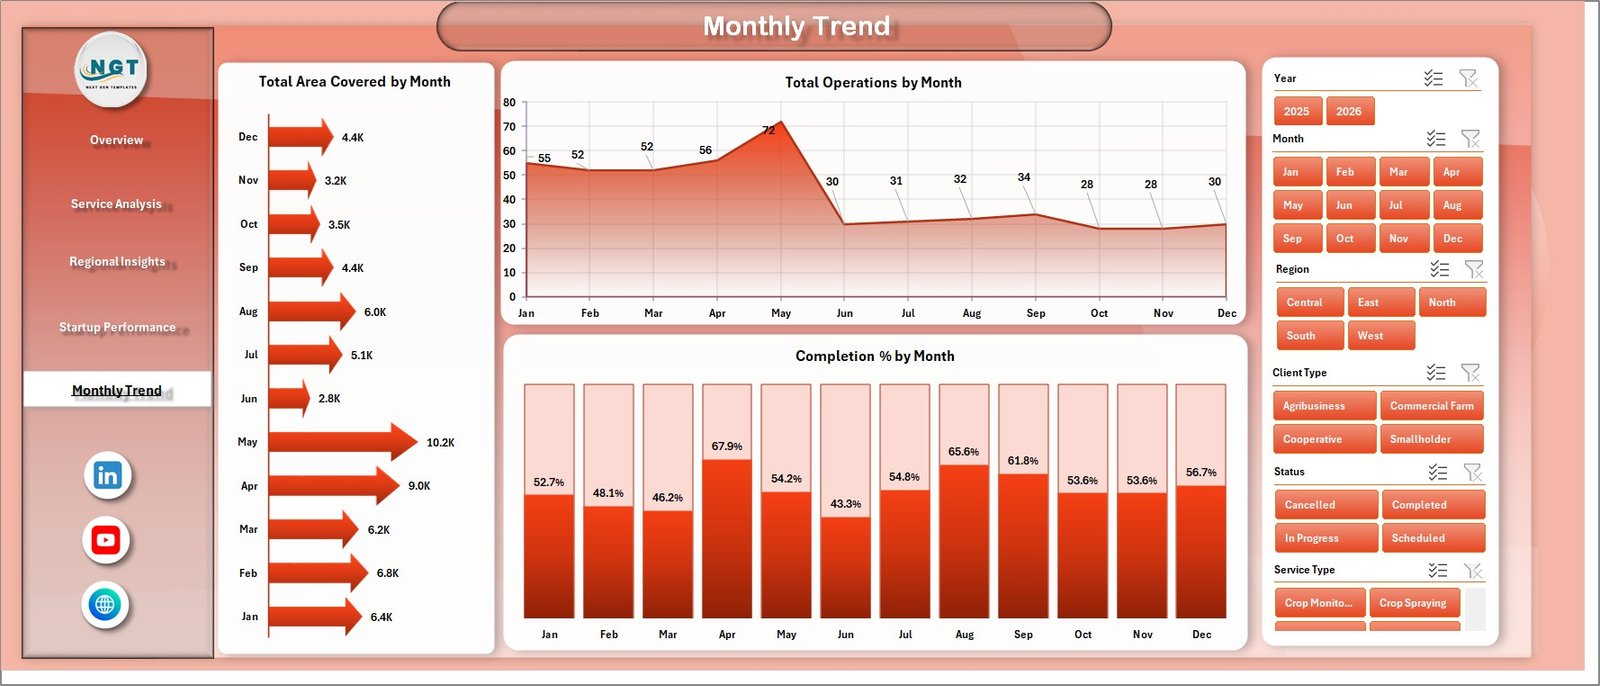
- Monthly trend tracking for total area covered, total operations, and completion percentage.
- Editable Data sheet where users can add their own records in the same format.
- Support sheet with pivot tables so users can click Data > Refresh All after updating the data.
Dashboard Pages Explanation
1. Overview Page
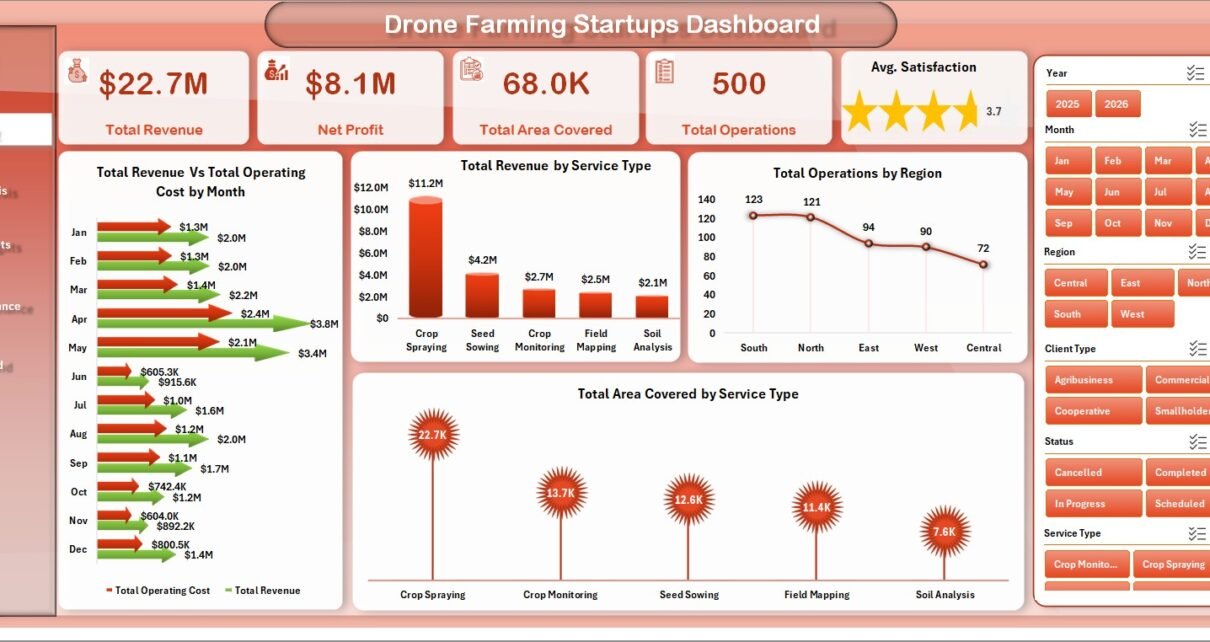
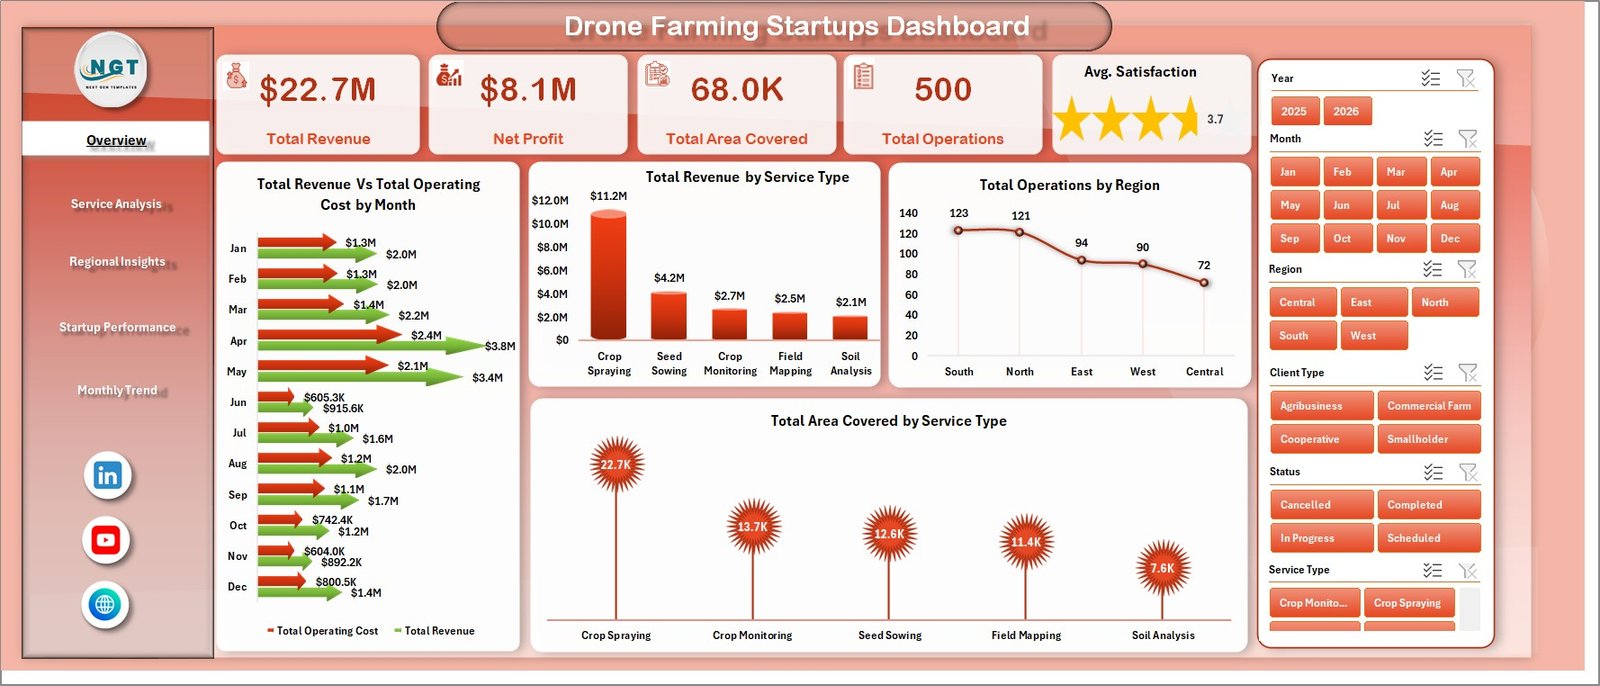
The Overview Page gives a high-level summary of the full drone farming startup operation. The top KPI cards show Total Revenue, Net Profit, Total Area Covered, Total Operations, and Avg. Satisfaction, helping leaders understand the health of the business before drilling into services, regions, startups, or monthly patterns.
Total Revenue Vs Total Operating Cost by Month: This chart compares income against service delivery cost over time. It helps founders see whether monthly growth is profitable or being absorbed by pilot hours, equipment cost, travel, maintenance, and field operations.
Total Revenue by Service Type: This visual ranks service categories by revenue contribution. It helps teams identify whether spraying, mapping, crop scouting, seeding, or monitoring services are driving the strongest commercial results.
Total Operations by Region: This chart shows where most drone farming work is being performed. It is useful for assigning equipment, planning pilot availability, and deciding which regions need more sales coverage.
Total Area Covered by Service Type: This chart connects services with field scale. It helps users understand which services cover the largest farm area and whether high-area services are also producing enough revenue.
2. Service Analysis
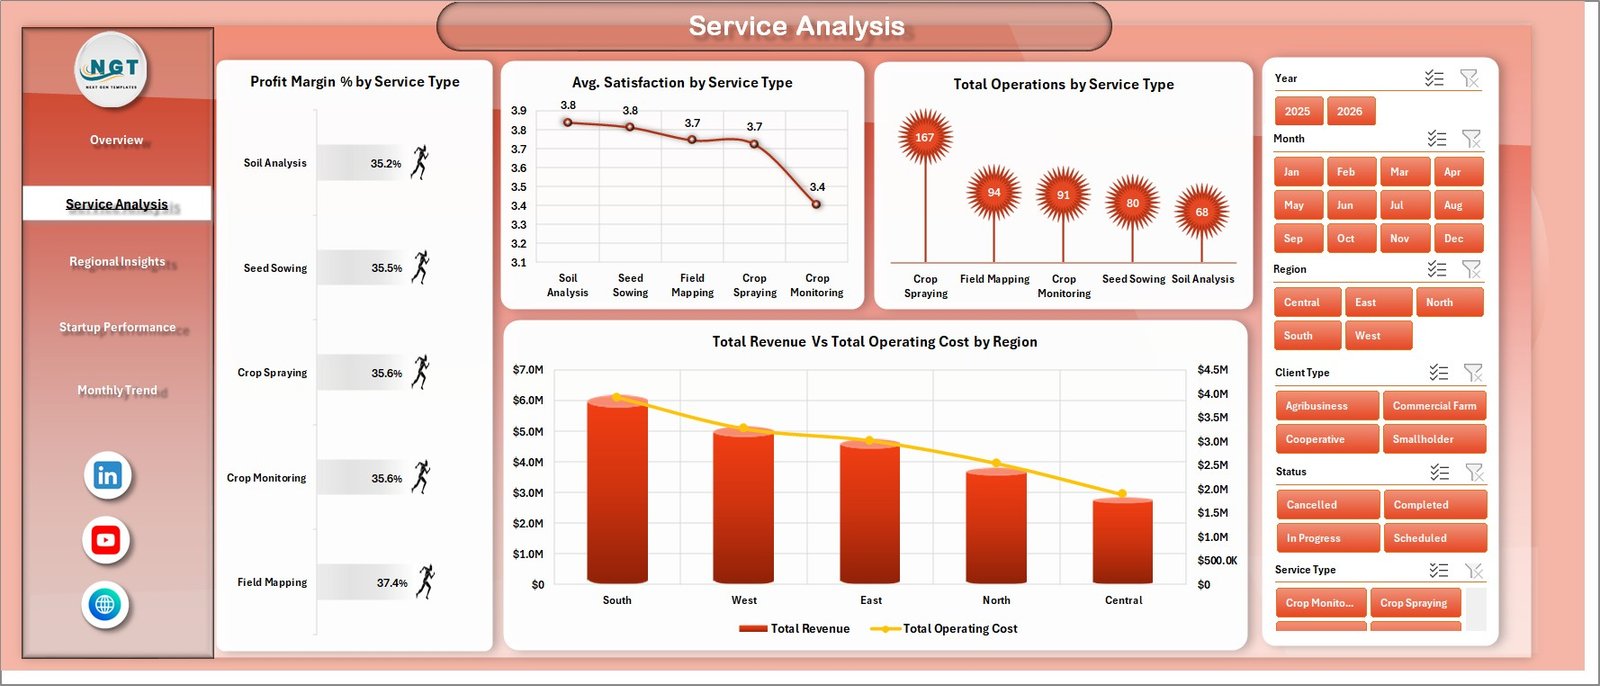
The Service Analysis page focuses on service categories. Profit Margin % by Service Type shows which offerings protect margin, while Avg. Satisfaction by Service Type helps measure customer experience. Total Operations by Service Type shows activity volume, and Total Revenue Vs Total Operating Cost by Region connects revenue with the cost of delivery in each market.
3. Regional Insights
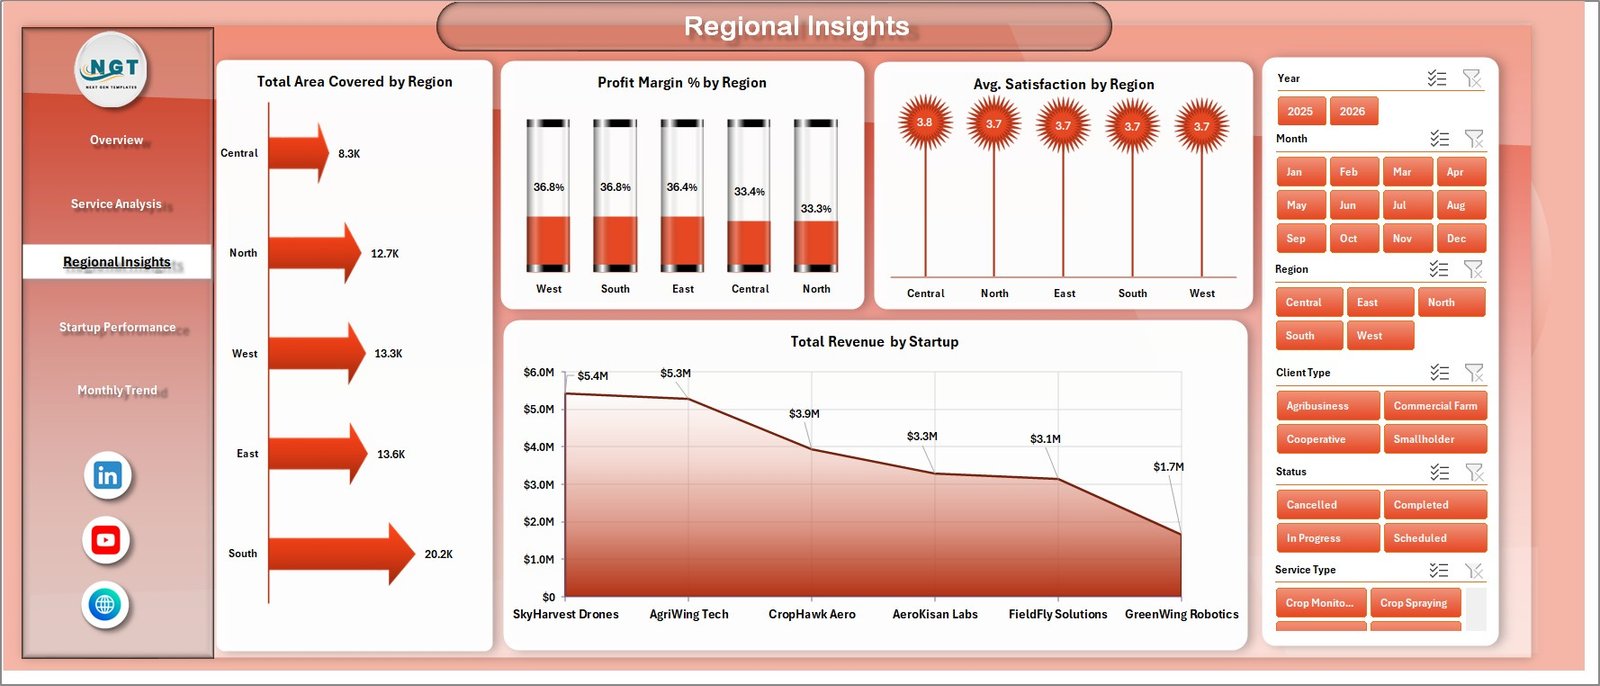
The Regional Insights page compares operating performance across territories. Total Area Covered by Region shows field scale, Profit Margin % by Region highlights profitability, Avg. Satisfaction by Region shows service quality, and Total Revenue by Startup helps compare startup contribution in each market context.
4. Startup Performance
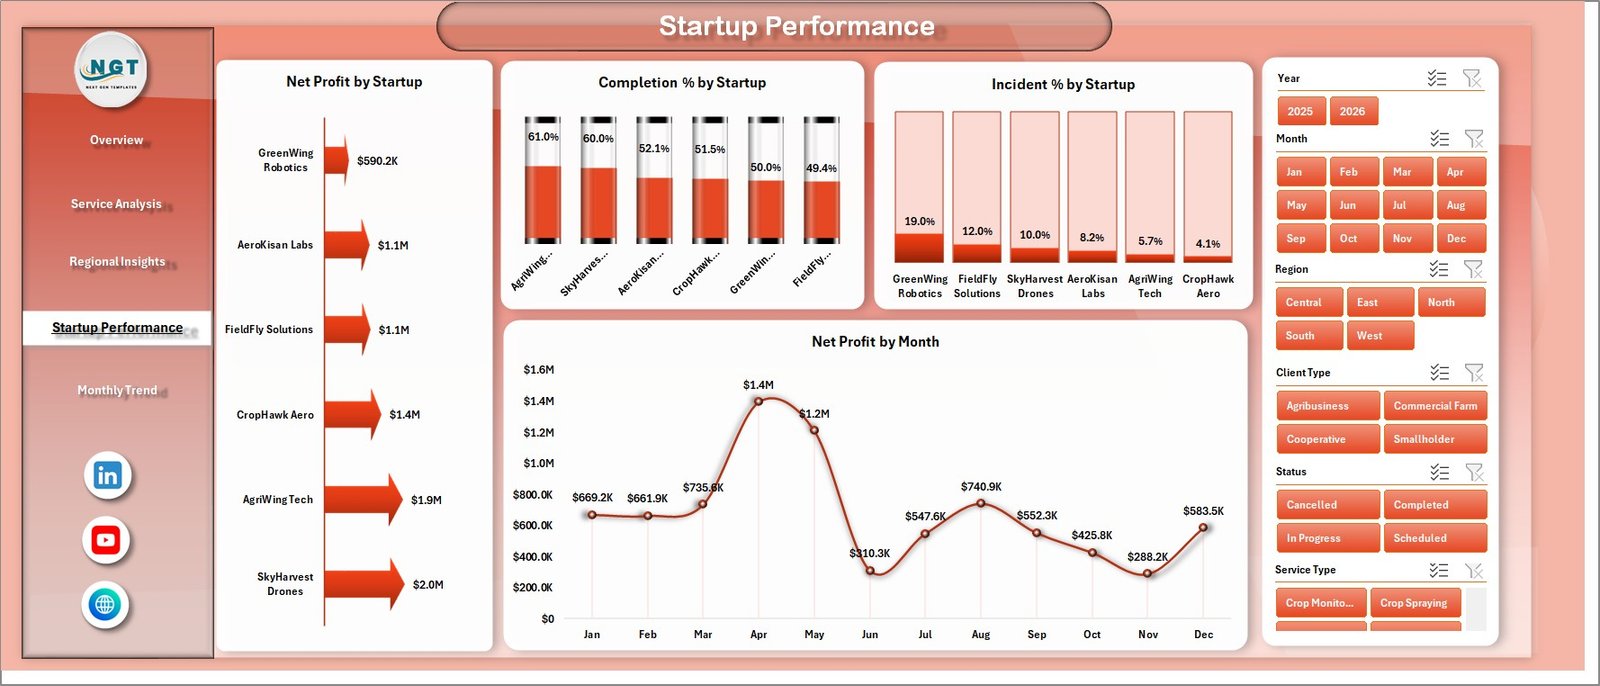
The Startup Performance page is useful when comparing multiple drone farming startups or business units. Net Profit by Startup shows financial contribution, Completion % by Startup highlights delivery reliability, Incident % by Startup flags operational risk, and Net Profit by Month shows whether performance is improving or slipping over time.
5. Monthly Trend
The Monthly Trend page helps users read seasonality and workload movement. Total Area Covered by Month shows scale, Total Operations by Month shows activity volume, and Completion % by Month shows whether the team is maintaining delivery quality as demand changes.
6. Data Sheet Tab
The Data sheet is the input area for the workbook. Users should add new records in the same column format, keep field names consistent, and refresh the workbook after updating data. This keeps dashboard cards, charts, slicers, and pivots aligned.

7. Support Sheet
The Support sheet contains multiple pivot tables used to create the dashboard dynamically. After updating the Data sheet, users can go to the Data tab in the Excel Ribbon and click Refresh All. The pivots and charts will refresh, and the sheet can be hidden for cleaner workbook navigation.

Drone Farming Startups Dashboard in Excel vs. Google Sheets vs. Paid Farm SaaS – Feature Comparison
| Feature | Drone Farming Startups Dashboard in Excel | Google Sheets alternative | Paid farm management SaaS |
|---|---|---|---|
| Cost | $17.99 one-time | Low one-time or free | Recurring subscription |
| Platform | Microsoft Excel | Browser-based spreadsheet | Vendor cloud platform |
| Setup time | Paste data and refresh | Paste data and share | Requires onboarding |
| Real-time team collaboration | Limited through shared files | Native collaboration | Usually included |
| Mobile access | Limited through Excel mobile | Good through Sheets app | Usually included |
| Customizable fields | Editable workbook | Editable sheet | Limited by vendor settings |
| Share with link | Possible through OneDrive | Native | Usually included |
| Year-1 cost at 5 users | $17.99 plus any Microsoft licensing | Usually low | Often hundreds or thousands |
| Drone farming analytics | Pre-built Excel pages | Must be built or adapted | Depends on vendor plan |
Who Should Use This Template
This template is useful for drone farming startups, farm-service operators, agritech accelerators, agriculture consultants, rural operations managers, and Excel users who already maintain structured service records. It works well when the goal is to analyze field operations, service performance, region results, startup comparisons, and monthly delivery trends.
It is not meant to replace flight planning software, drone control systems, GIS mapping platforms, maintenance compliance systems, or live telemetry dashboards. It is best used as a reporting layer after operational data has been exported or entered into Excel.
Real-World Use Cases
Aarav, agritech founder: Aarav reviews Total Revenue vs Total Operating Cost by Month before monthly investor updates. The chart helps him explain whether growth is translating into net profit or being consumed by delivery cost.
Meera, operations manager: Meera checks Completion % by Startup and Incident % by Startup after each field cycle. She uses the dashboard to identify teams that need route planning, pilot training, or equipment maintenance support.
Daniel, agriculture consultant: Daniel compares Total Area Covered by Region and Avg. Satisfaction by Region for multiple clients. This gives him a practical way to recommend where drone services should expand next.
Advantages of Drone Farming Startups Dashboard in Excel
- Fast setup: Users can start from a ready-made workbook instead of designing charts and pivots manually.
- Business visibility: Revenue, cost, profit, service volume, and satisfaction are visible in one file.
- Operational review: Completion percentage and incident percentage help connect financial results with delivery quality.
- Excel flexibility: Users can edit the workbook, adjust charts, add fields, and extend the data model if needed.
- Low ownership cost: The template is a one-time download rather than a recurring subscription.
Opportunities for Improvement
As a template, the dashboard depends on clean source data. Users should keep service type names, region names, startup names, dates, revenue, operating cost, completion fields, incident fields, and satisfaction scores consistent. Advanced users may extend it with pilot utilization, drone model, crop type, farm size, weather, battery cycles, maintenance cost, or customer renewal fields.
Best Practices
- Keep one row per operation or service record so pivot tables summarize correctly.
- Use consistent service type and region names to avoid duplicate slicer values.
- Review operating cost together with revenue, not separately.
- Track completion percentage and incident percentage every month to catch delivery risk early.
- Keep the Support sheet hidden after setup so users do not accidentally edit pivot tables.
- Click Data > Refresh All after every data update.
Explore Relevant Templates
You can purchase the Drone Farming Startups Dashboard in Excel from NextGenTemplates. You may also want to review related templates such as Garden Center Dashboard in Excel, Vertical Farming Dashboard in Power BI, and the full Excel Dashboard Templates category.
Frequently Asked Questions
What is the Drone Farming Startups Dashboard in Excel?
It is an Excel dashboard template for tracking drone farming startup revenue, operating cost, net profit, area covered, operation count, satisfaction, completion percentage, incidents, services, regions, startups, and monthly trends.
What KPI cards are included on the Overview page?
The Overview page includes Total Revenue, Net Profit, Total Area Covered, Total Operations, and Avg. Satisfaction cards.
Can I add my own data?
Yes. Add or replace records in the Data sheet using the same format, then click Data > Refresh All to update the dashboard.
What pages are included?
The workbook includes Overview, Service Analysis, Regional Insights, Startup Performance, Monthly Trend, Data Sheet, and Support Sheet tabs.
Can I hide the Support sheet?
Yes. The Support sheet contains the pivot tables that power the dashboard and can be hidden after setup.
Is this dashboard a drone flight management system?
No. It is an Excel analytics dashboard for operational and financial records. It does not control drones, manage live flights, or replace GIS and compliance tools.
About the Author
Built by PK – Microsoft Certified Professional with 15+ years of Excel, Google Sheets, and Power BI experience. Founder of NextGenTemplates, reaching 300K+ subscribers across YouTube channels. Every template is hand-built and tested before release.
Conclusion
The Drone Farming Startups Dashboard in Excel gives agritech teams a practical way to review drone farming revenue, cost, profit, field coverage, service performance, region performance, startup delivery quality, and monthly trends. It is a useful starting point for teams that want fast Excel-based analytics before investing in larger custom systems.
Visit our YouTube channel for step-by-step Excel tutorials: Youtube.com/@PKAnExcelExpert.
Click here to purchase Drone Farming Startups Dashboard in Excel