Geothermal projects can run continuously for decades, but the reporting work around them is often less elegant: revenue in one spreadsheet, plant generation in another, capacity planning in a third, and sustainability metrics waiting for month-end cleanup. The Geothermal Energy Dashboard in Excel brings these reporting views into one workbook with five dashboard pages, four executive cards, 17 chart views, slicers, a Data Sheet, and a pivot-powered Support Sheet.
This template is designed for renewable energy analysts, geothermal plant managers, finance teams, sustainability reporting leads, and contractors who need clear recurring reporting without a custom BI implementation. You can replace the sample data, click Data > Refresh All, and review production, financial, reliability, and carbon offset insights from a familiar Microsoft Excel environment.
Click to purchase Geothermal Energy Dashboard in Excel
Key Features of Geothermal Energy Dashboard in Excel
- Five dashboard pages: Overview, Production, Financials, Reliability, and Sustainability.
- Four executive KPI cards: Total Revenue, Net Profit, Total Generation, and Total Capacity.
- Seventeen analysis charts: Review plant output, revenue, profitability, technology mix, downtime risk, project status, inspections, and carbon offset.
- Multiple slicers: Filter dashboard pages quickly by available fields such as region, country, plant, technology, resource type, contractor, status, month, and risk level.
- Structured Data Sheet: Replace the sample geothermal records in a consistent table format.
- Pivot-driven Support Sheet: Refresh all dashboard visuals through Excel’s built-in refresh command.
- Editable Excel workbook: Adjust fields, slicers, charts, labels, and colors based on your reporting needs.
Dashboard Pages Explanation
1. Overview Page
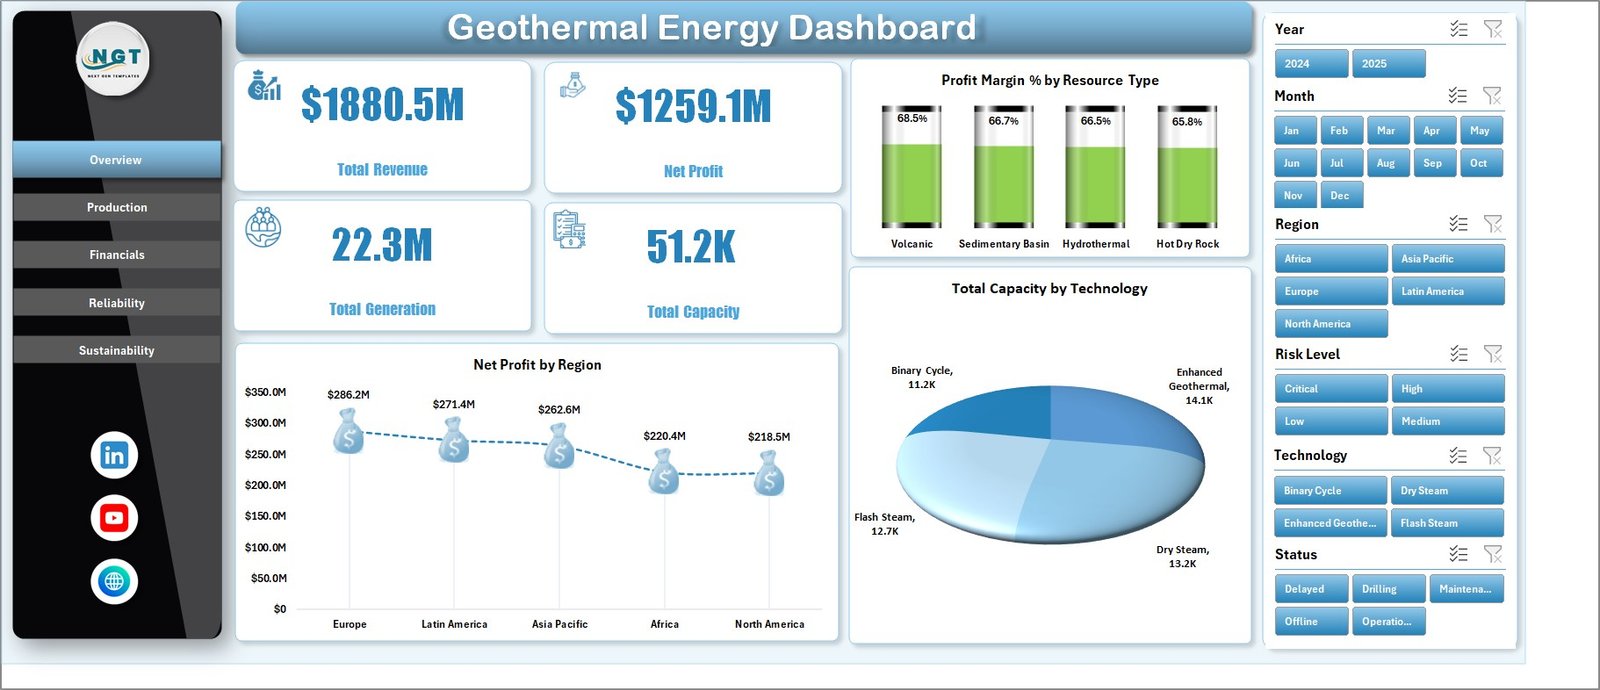
The Overview page gives leadership a high-level snapshot of geothermal performance. Total Revenue and Net Profit summarize financial results, while Total Generation and Total Capacity show production scale and available plant capacity.
Net Profit by Region: This chart shows which regions contribute the most profit. It helps users compare regional performance and identify areas where cost, generation, or pricing may need closer review.
Profit Margin % by Resource Type: This chart compares margin by geothermal resource category. It helps teams understand which resource types are producing stronger financial returns.
Total Capacity by Technology: This chart breaks capacity across geothermal technologies. It supports planning conversations around flash, binary, dry steam, or other technology groups.
2. Production
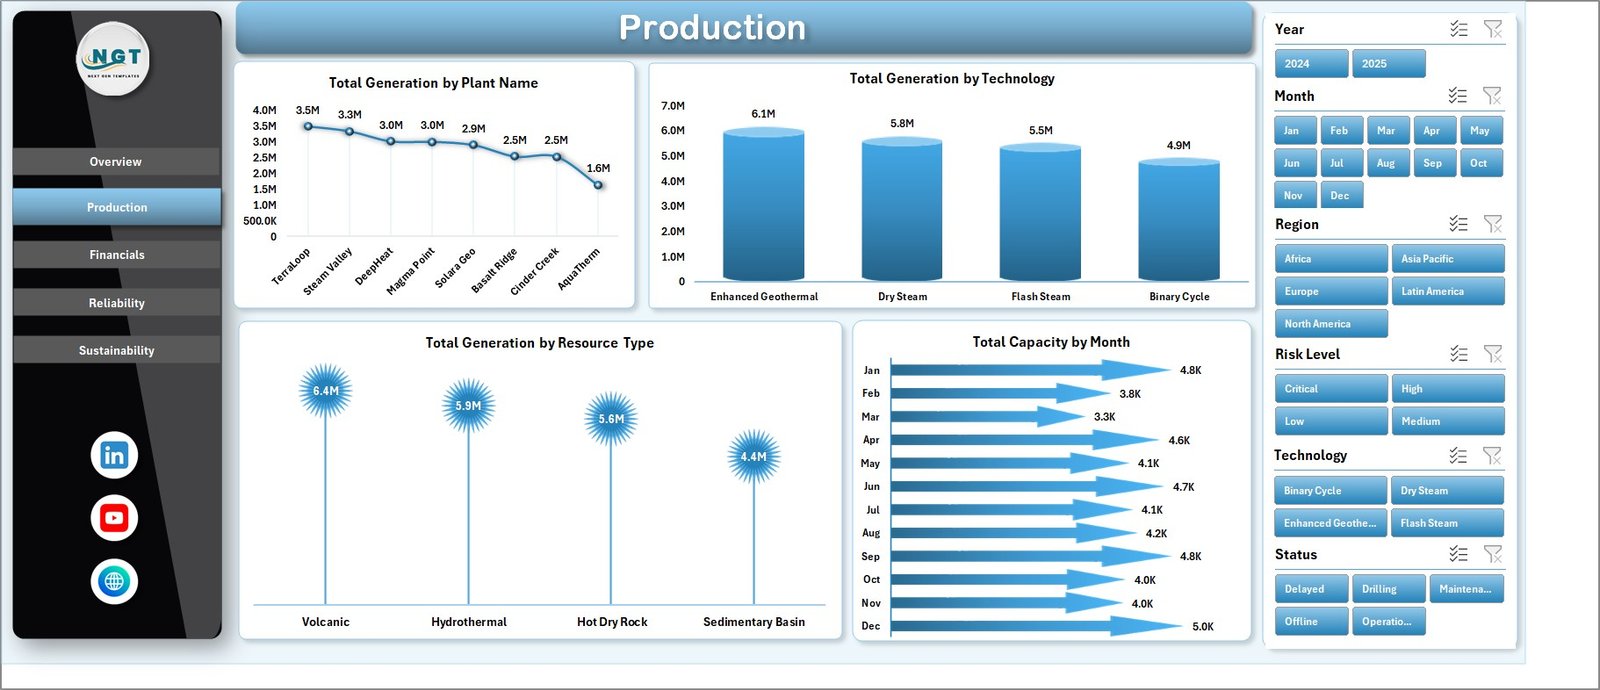
The Production sheet focuses on geothermal output and installed capacity. Total Generation by Plant Name highlights high-output plants. Total Generation by Technology compares output across technical approaches. Total Generation by Resource Type explains how each geothermal resource category contributes. Total Capacity by Month helps users monitor capacity movement over time.
3. Financials
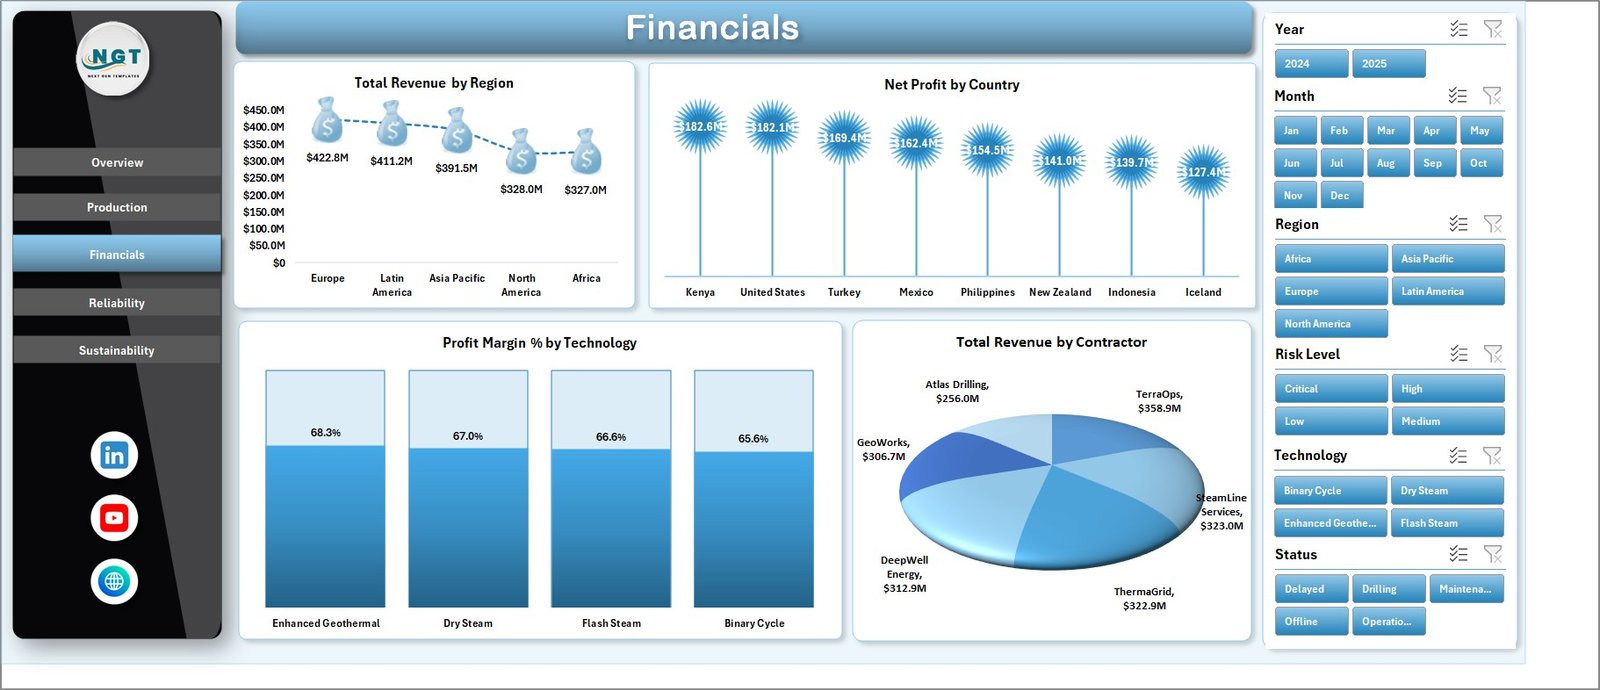
The Financials page is built for revenue and profitability review. Total Revenue by Region compares market contribution by geography. Net Profit by Country shows which countries are more profitable. Profit Margin % by Technology helps compare economics by plant technology, and Total Revenue by Contractor supports contractor and partner performance discussions.
4. Reliability
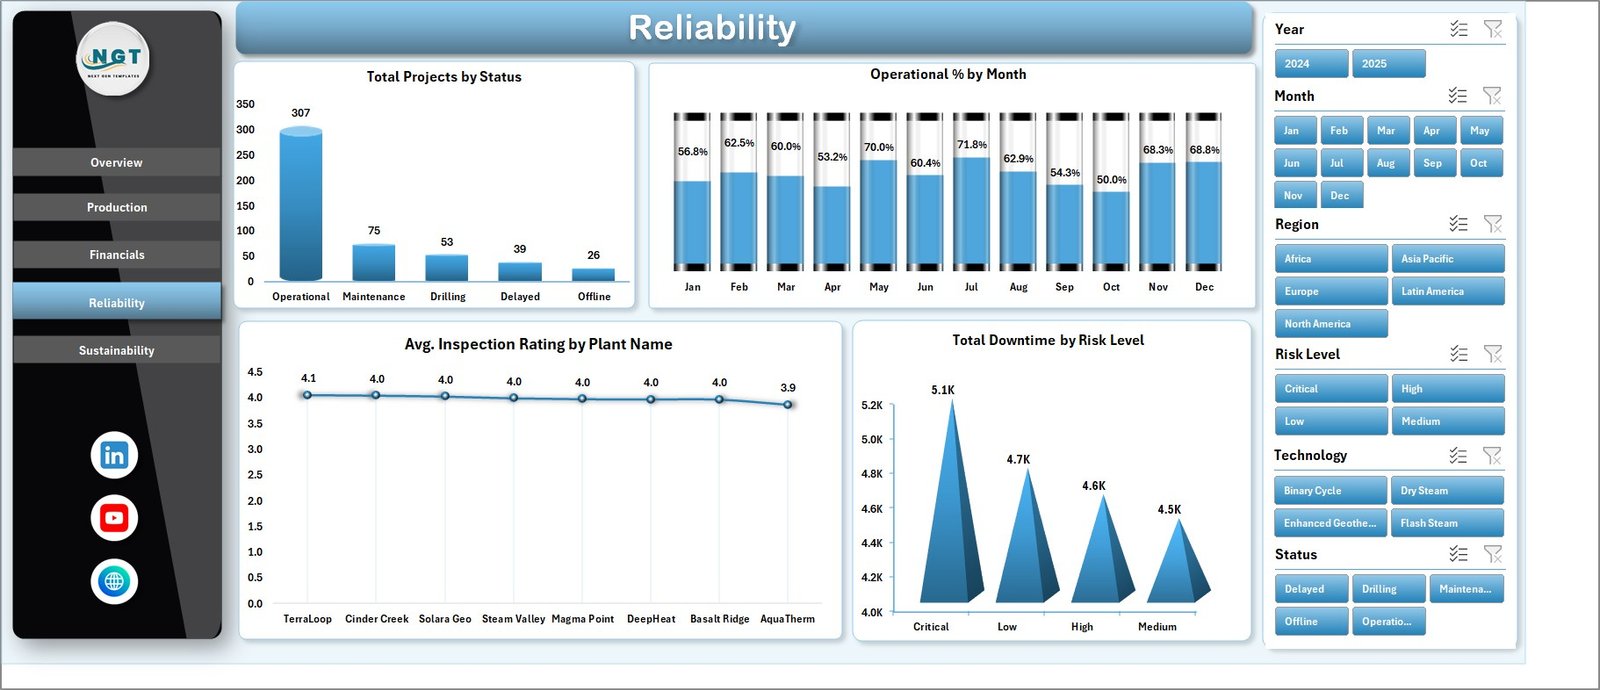
The Reliability page helps teams connect operational health with risk. Total Projects by Status shows how the geothermal project portfolio is distributed. Operational % by Month tracks availability over time. Avg. Inspection Rating by Plant Name compares plant condition, while Total Downtime by Risk Level highlights risk groups that need attention.
5. Sustainability
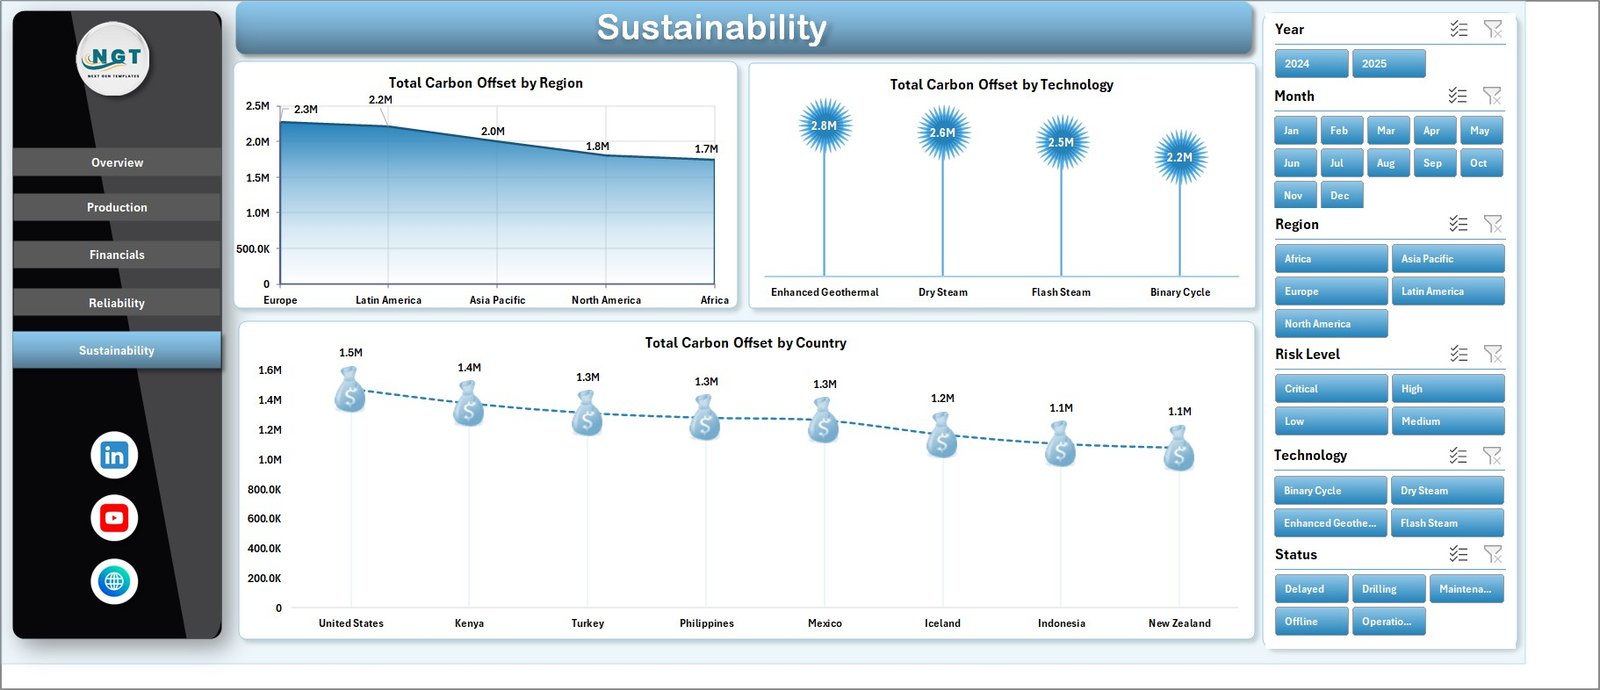
The Sustainability page tracks carbon offset contribution. Total Carbon Offset by Region compares sustainability impact geographically. Total Carbon Offset by Technology shows how technology choices influence environmental outcomes, and Total Carbon Offset by Country supports country-level ESG reporting.
6. Data Sheet Tab
The Data Sheet is where users add geothermal plant data in the same format as the sample records. Keep the column headers consistent, paste or type your own data, and refresh the workbook to update all dashboard pages.

7. Support Sheet
The Support Sheet contains the pivot tables used to create the dashboard dynamically. After updating the Data Sheet, go to the Data tab in the Excel Ribbon and click Refresh All. All pivots and charts refresh together, and you can keep this sheet hidden for day-to-day users.

Geothermal Energy Dashboard in Excel vs. Google Sheets vs. Paid Energy SaaS – Feature Comparison
| Feature | This Excel Dashboard | Google Sheets Alternative | Paid Energy SaaS |
|---|---|---|---|
| Cost | $17.99 one-time | Low tool cost, custom build time | Monthly or annual subscription |
| Platform | Microsoft Excel | Browser-based spreadsheet | Vendor cloud platform |
| Setup time | Replace records and refresh pivots | Build formulas and charts manually | Implementation and onboarding |
| Real-time team collaboration | Possible through OneDrive or SharePoint | Native browser collaboration | Usually seat-based |
| Mobile access | Possible through Excel mobile or cloud storage | Available in browser and mobile app | Usually available through vendor app |
| Customizable fields | Fully editable workbook | Editable if custom-built | Limited by vendor settings |
| Share with link | Possible through Microsoft cloud storage | Built in | Usually login controlled |
| Year-1 cost at 5 users | $17.99 plus existing Excel access | Low license cost, higher build time | Often hundreds or thousands |
| Geothermal analysis pages | Included across five dashboard pages | Requires custom setup | Depends on plan and data access |
Who Should Use This Template
This dashboard is useful for geothermal plant managers, energy and utility companies, renewable energy analysts, country managers, operations teams, finance controllers, contractors, ESG reporting teams, and consultants who need structured Excel reporting for geothermal generation, capacity, revenue, margin, reliability, inspection, downtime, and carbon offset metrics.
It is not designed to replace SCADA, plant control systems, real-time telemetry, automated meter infrastructure, or audited financial systems. It works best as a reporting dashboard when the source data is already structured.
Real-World Use Cases
Priya, operations manager: Priya reviews Overview and Reliability every month to brief leadership on generation, capacity, operational percentage, inspection rating, and downtime risk.
Marcus, renewable finance analyst: Marcus uses Financials to compare revenue by region, profit by country, margin by technology, and contractor contribution before preparing reporting packs.
Asha, ESG reporting lead: Asha refreshes the Sustainability tab to explain carbon offset by region, country, and technology for stakeholder updates.
Advantages of Geothermal Energy Dashboard in Excel
- It saves time compared with building a geothermal dashboard from scratch.
- It keeps production, financial, reliability, and sustainability views in one workbook.
- It gives leaders a high-level summary while supporting deeper plant-level analysis.
- It is editable, so teams can adapt charts, slicers, fields, and labels.
- It supports recurring monthly reporting without a separate dashboard subscription.
Opportunities for Improvement
Larger geothermal operators may connect the workbook to Power Query, a central database, or an automated plant data export. Teams may also extend the dashboard with well-level data, heat rate, steam flow, reservoir pressure, maintenance work orders, planned vs unplanned outages, or budget variance.
Best Practices
- Keep plant names, region names, countries, technologies, contractors, and resource types consistent.
- Validate Total Revenue, Net Profit, Total Generation, and Total Capacity after every refresh.
- Review reliability and financial results together so high generation does not hide downtime risk.
- Use slicers during review meetings to answer follow-up questions quickly.
- Keep the Support Sheet hidden for regular users, but do not delete it because it powers the dashboard.
Explore Relevant Templates
- Geothermal Energy Dashboard in Excel
- Geothermal Energy KPI Dashboard in Excel
- Energy & Utility Dashboard in Excel
- Solar Energy Dashboard in Excel
- ESG Environmental Dashboard in Excel
For official Excel guidance, see Microsoft Excel help and learning.
Frequently Asked Questions
What KPI cards are included?
The Overview page includes Total Revenue, Net Profit, Total Generation, and Total Capacity cards.
How many dashboard pages are included?
The workbook includes five dashboard pages plus a Data Sheet and Support Sheet, making seven sheet tabs in total.
Can I use my own geothermal plant data?
Yes. Replace the sample rows in the Data Sheet, keep the same format, and refresh the workbook.
Does this dashboard require macros?
No. It is built with Excel tables, slicers, pivot tables, and charts.
Can I customize the dashboard?
Yes. You can edit charts, slicers, fields, labels, colors, formulas, and worksheet names.
Does this replace geothermal plant monitoring software?
No. It is an Excel reporting template, not a live plant monitoring or control system.
About the Author
Built by PK – Microsoft Certified Professional with 15+ years of Excel, Google Sheets, and Power BI experience. Founder of NextGenTemplates, reaching 300K+ subscribers across YouTube channels. Every template is hand-built and tested before release.
Conclusion
The Geothermal Energy Dashboard in Excel gives geothermal teams a practical way to turn plant, financial, reliability, and sustainability data into clear reporting. With KPI cards, slicers, five dashboard pages, a Data Sheet, and a Support Sheet, it helps teams review generation, capacity, profit, downtime, inspection rating, contractor revenue, and carbon offset without starting from a blank workbook.
Visit our YouTube channel to learn step-by-step Excel, Power BI, and dashboard tutorials.
Click to Purchase Geothermal Energy Dashboard in Excel