Last updated: July 9, 2026. Micro breweries and pubs run on fast-moving sales, thin margins, changing customer demand, and service timing that can shift from one month to the next. The Micro Breweries Pubs Dashboard in Power BI helps owners, pub managers, taproom supervisors, and food and beverage analysts review revenue, cost, pints sold, target achievement, profit, quality, wait time, and trends in one editable .pbix report.
This template is built for teams that want Power BI reporting without starting from a blank file or paying for a large custom BI project. You can open the file in Power BI Desktop, replace the sample source with your own structured data, refresh the model, and use slicers to review the business by pub, region, city, brew style, product, event type, sales channel, customer segment, month, quarter, and year.
Click here to purchase the Micro Breweries Pubs Dashboard in Power BI
Key Features of Micro Breweries Pubs Dashboard in Power BI
- 5 Power BI report pages: Overview Page, Pub Sales, Beer Mix, Service, and Trend.
- 4 KPI cards: Total Revenue, Total Pints Sold, Total Cost, and Target Achievement.
- 17 analytical visuals: Review revenue, cost, gross profit, profit margin, pints sold, orders, quality score, wait time, completion rate, target achievement, and seasonal trends.
- Interactive slicers: Filter quickly by brewery, pub, city, region, product, brew style, event type, server, sales channel, customer segment, and date fields.
- Editable .pbix file: Change visuals, labels, DAX measures, model relationships, and theme colors in Power BI Desktop.
- One-time download: No subscription, no per-user template fee, and no locked SaaS reporting layer.
Dashboard Pages Explanation
1 – Overview Page
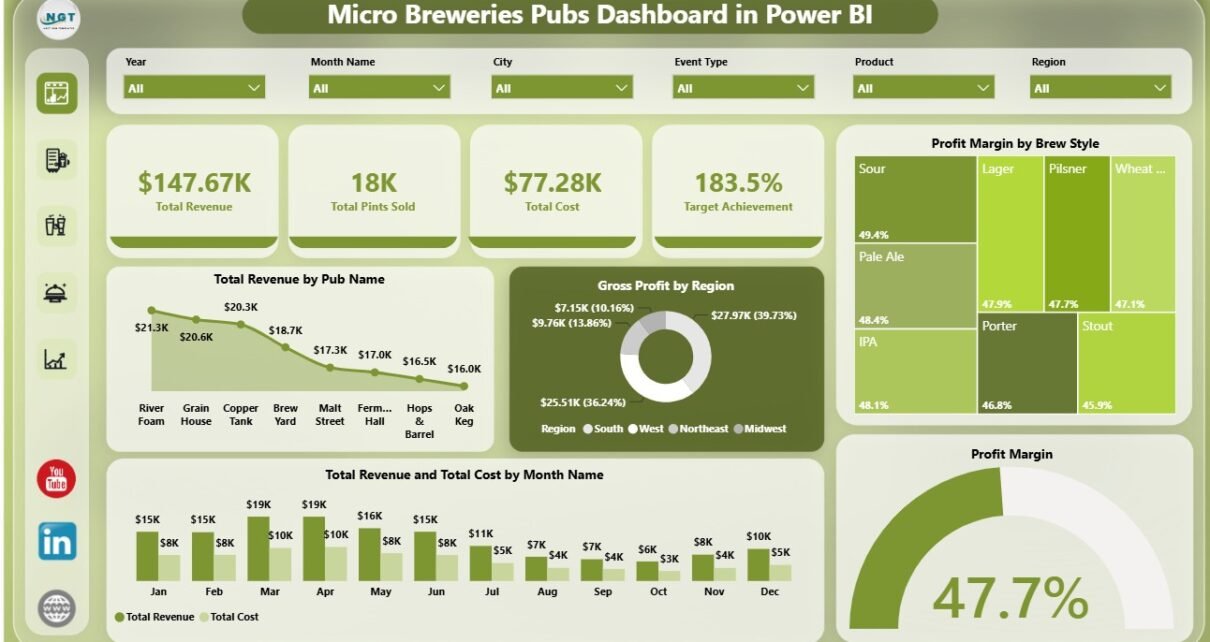
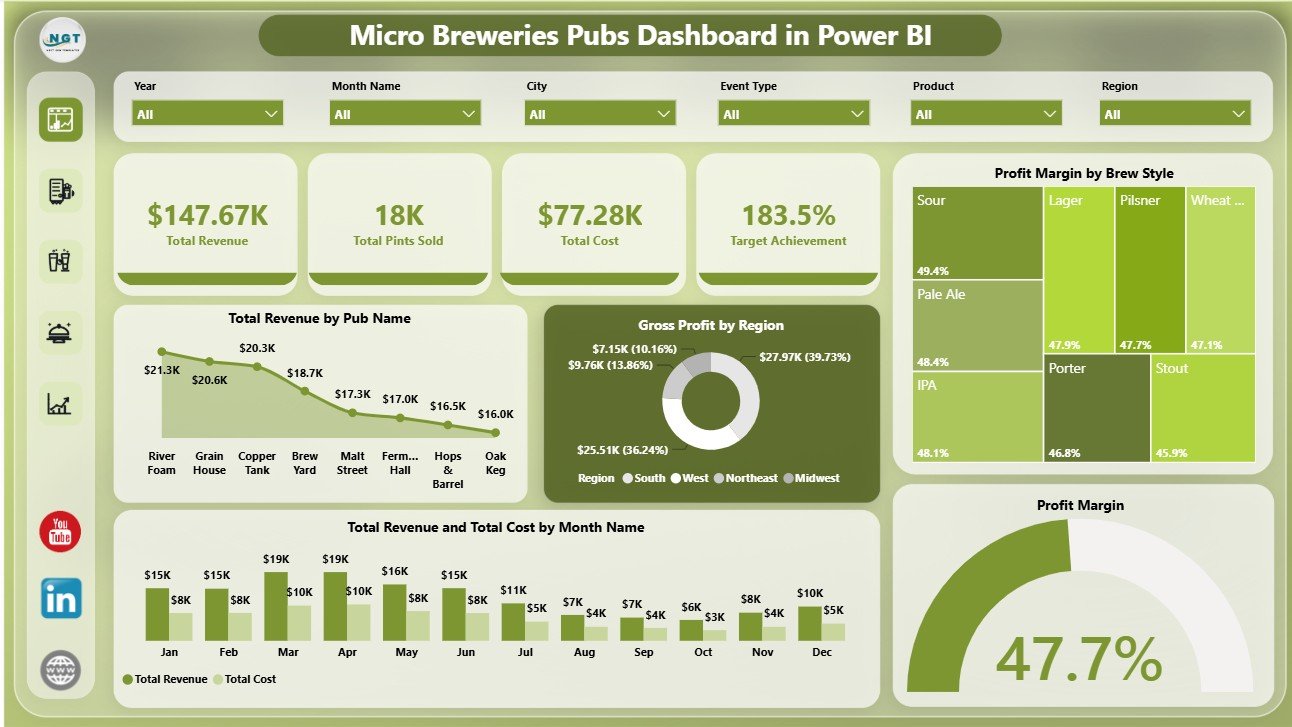
The Overview Page is the leadership snapshot. At the top, the KPI cards show Total Revenue, Total Pints Sold, Total Cost, and Target Achievement. This gives managers a quick read on sales scale, beer volume, cost pressure, and whether the business is on track against targets.
Total Revenue by Pub Name ranks pub locations by revenue. It helps owners compare outlets and identify pubs that may need marketing, menu, pricing, staffing, or event support.
Gross Profit by Region shows which regions are contributing the most profit. It supports regional performance reviews and helps teams decide where to focus growth or operational improvement.
Profit Margin by Brew Style compares margin across brew styles. It helps identify whether lagers, IPAs, stouts, ales, sours, or seasonal products are producing healthy enough returns.
Total Revenue and Total Cost by Month Name compares monthly income with monthly cost. It reveals seasonality, cost spikes, and months where revenue growth did not convert into stronger margin.
Profit Margin gives a quick profitability signal. It keeps the team focused on what remains after cost instead of judging performance by sales volume alone.
2 – Pub Sales
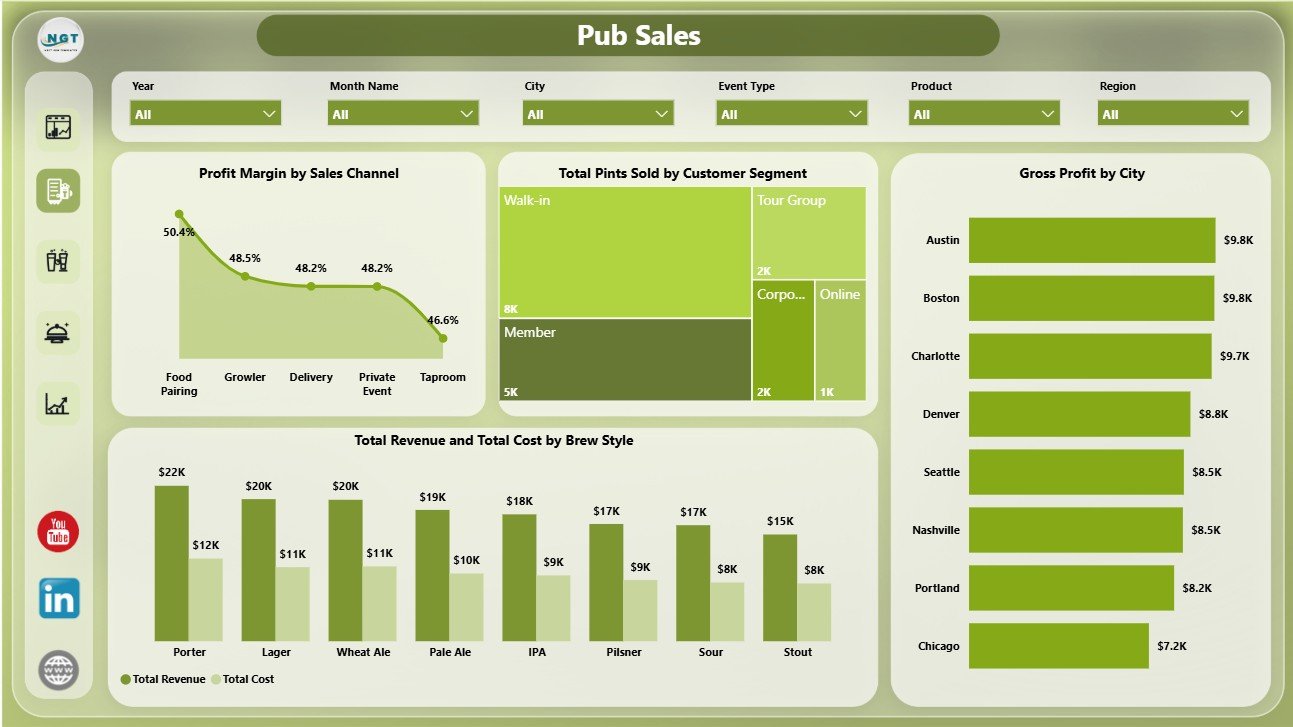
The Pub Sales page focuses on channel, segment, city, and brew style performance. Profit Margin by Sales Channel compares how each channel converts sales into profit. This is useful when taproom, dine-in, takeaway, event, online, or wholesale sales have different cost profiles.
Total Pints Sold by Customer Segment shows which customer groups drive drink volume. Gross Profit by City highlights stronger and weaker city markets. Total Revenue and Total Cost by Brew Style connects product mix with cost control so teams can see which brew styles deserve more attention.
3 – Beer Mix
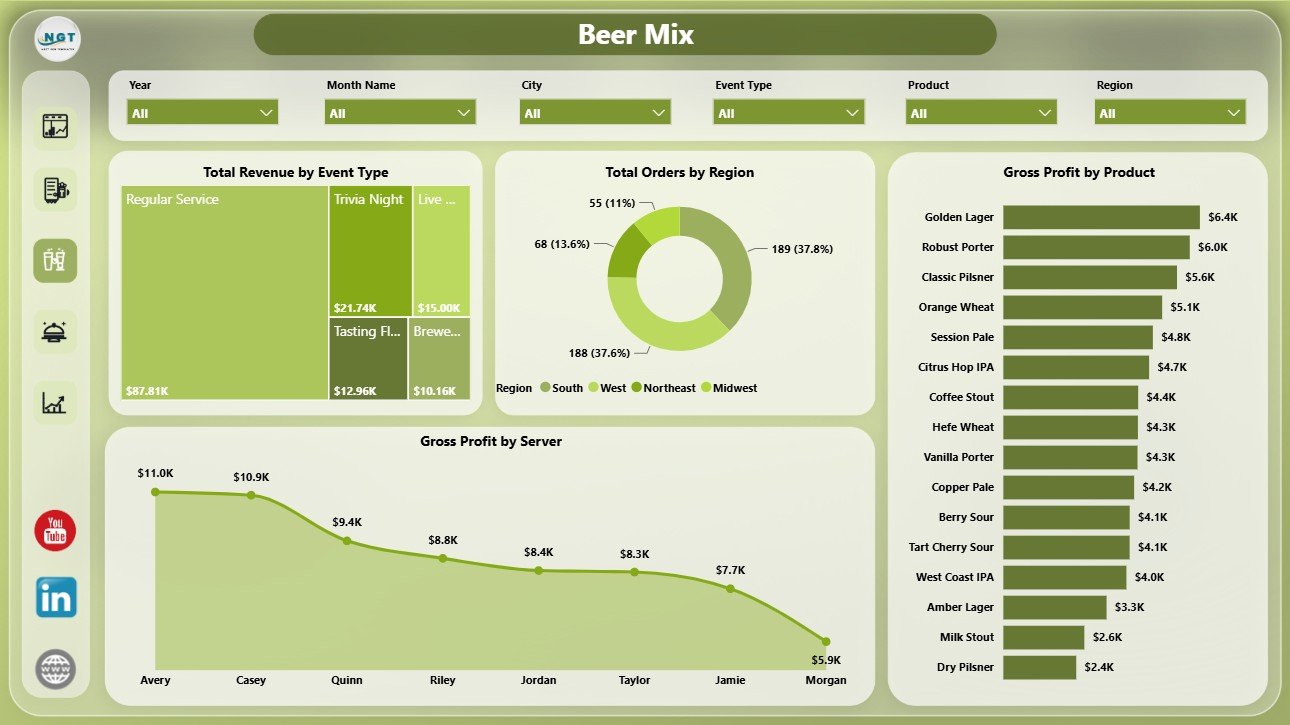
The Beer Mix page helps managers understand which events, regions, products, and servers are contributing to results. Total Revenue by Event Type shows whether regular service, tasting nights, live music, private events, festivals, or promotions generate the best sales.
Total Orders by Region compares order activity across territories. Gross Profit by Product identifies the beers or menu items producing the strongest return. Gross Profit by Server can support coaching, recognition, staffing decisions, and incentive discussions.
4 – Service
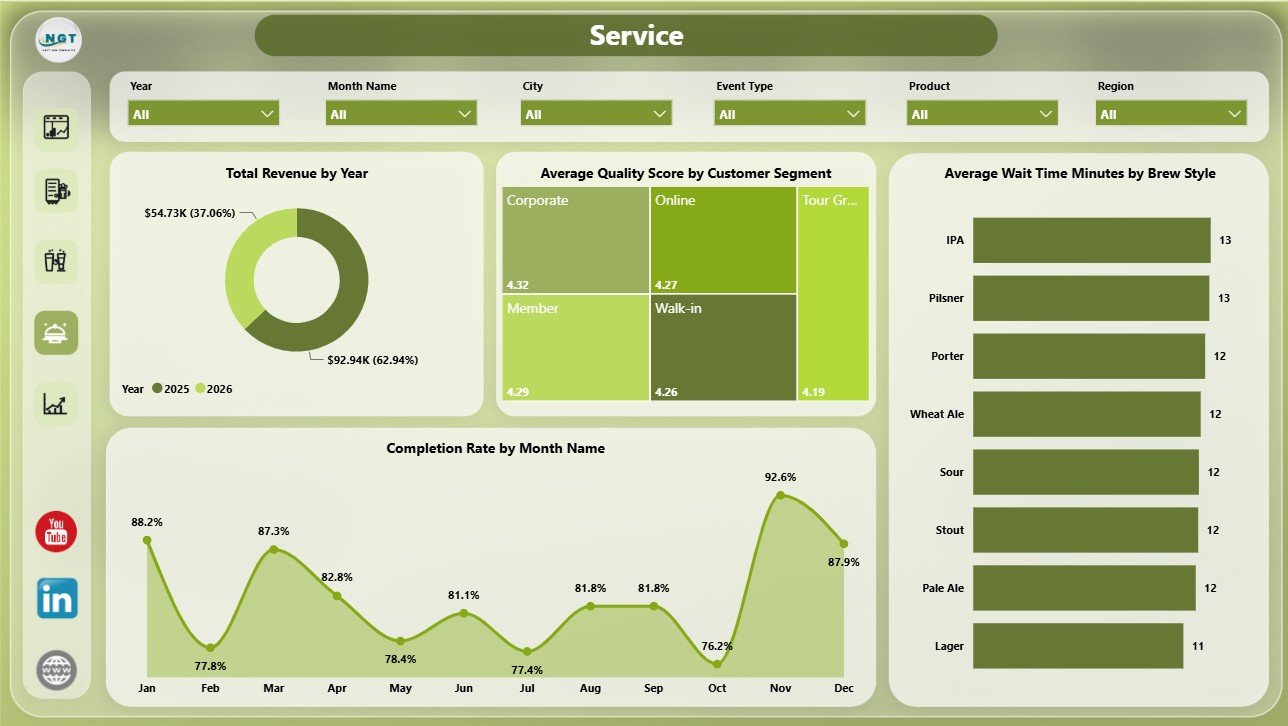
The Service page connects business performance with customer experience. Total Revenue by Year gives a year-level sales view. Average Quality Score by Customer Segment shows how different customer groups experience product and service quality.
Average Wait Time Minutes by Brew Style helps identify styles or service flows connected with longer wait times. Completion Rate by Month Name tracks monthly execution and helps managers review whether service consistency is improving.
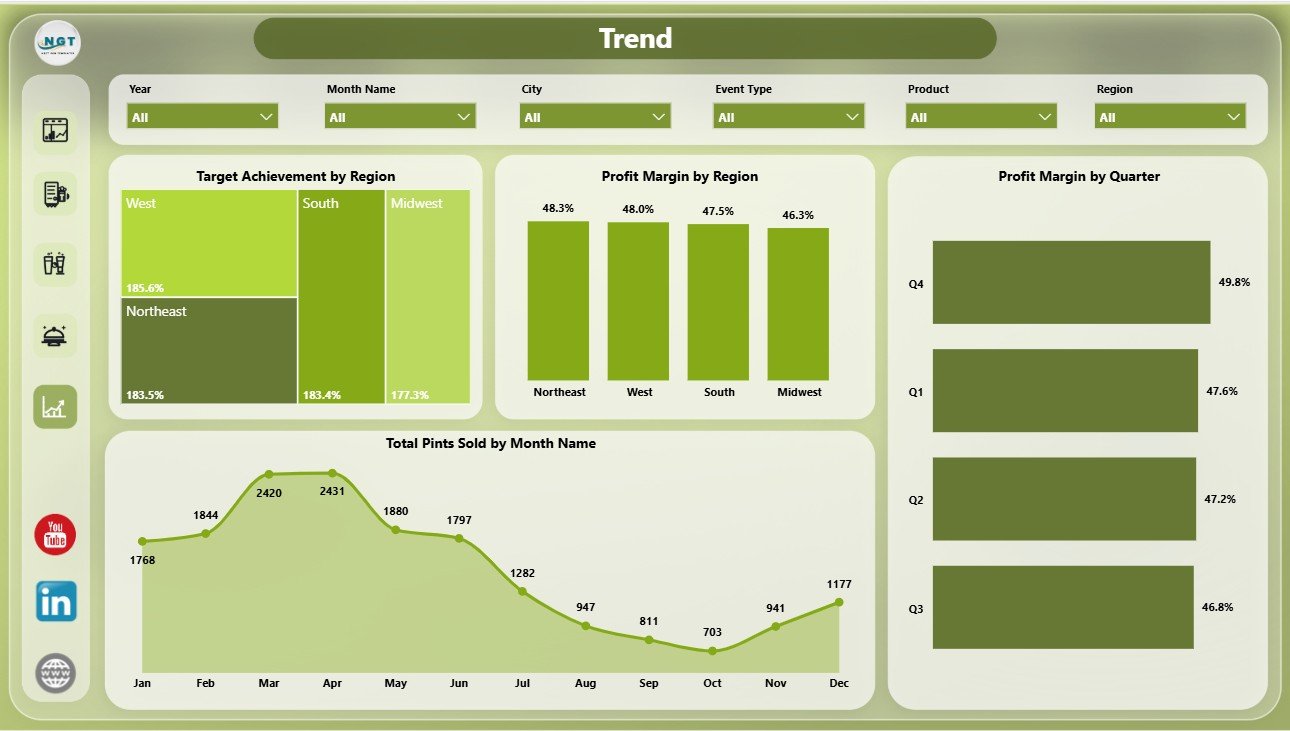
5 – Trend
The Trend page is designed for time-based and region-based movement. Target Achievement by Region compares actual results against regional targets. Profit Margin by Region highlights locations that are protecting margin and locations that may need pricing or cost review.
Profit Margin by Quarter shows whether profitability is improving or slipping through the year. Total Pints Sold by Month Name shows demand seasonality and supports production planning, staffing, stock planning, and promotion timing.
Micro Breweries Pubs Dashboard in Power BI vs. Tableau vs. Paid Brewery SaaS – Feature Comparison
| Feature | This Power BI template | Tableau or Qlik alternative | Paid brewery or pub SaaS |
|---|---|---|---|
| Cost | $17.99 one-time sale price | License and development cost | Recurring subscription |
| Platform | Power BI Desktop and Power BI Service | BI platform setup required | Vendor-hosted system |
| Setup time | Open .pbix, connect data, refresh | Build model and visuals | Onboarding and configuration |
| Real-time team collaboration | Available after publishing to Power BI Service | Available by plan | Usually included by plan |
| Mobile access | Available through Power BI mobile apps after publishing | Available by plan | Usually included |
| Customizable fields | Editable model, visuals, labels, theme, and measures | Editable with BI skills | Depends on vendor permissions |
| Share with link | Available through Power BI Service permissions | Available by plan | Depends on seats and plan |
| Year-1 cost at 5 users | $17.99 plus any Microsoft licensing needed | Often hundreds or thousands | Often hundreds or thousands |
| Pub and beer analytics | Revenue, cost, pints, profit, margin, targets, events, service, quality, and trends | Must be built or adapted | May require premium reporting |
Who Should Use This Template
This template is best for microbrewery owners, pub managers, taproom supervisors, hospitality finance teams, food and beverage analysts, event managers, regional managers, and Power BI consultants who report on pub or brewery performance.
It is not a POS system, payment terminal, booking system, inventory barcode app, recipe management tool, payroll platform, or live brewery production system. It works best as a reporting layer once your operational data is already available in structured rows.
Real-World Use Cases
Elena, taproom manager: reviews Total Pints Sold by Month before planning seasonal taps, tasting nights, and staffing levels for busy periods.
Marcus, microbrewery owner: compares Profit Margin by Brew Style with Total Revenue and Total Cost to decide which products deserve more production capacity.
Priya, hospitality analyst: uses city, region, event type, server, and sales channel visuals to prepare a monthly review for a pub group.
Advantages of Micro Breweries Pubs Dashboard in Power BI
- It combines pub sales, beer mix, service, and trend analysis in one report.
- It uses Power BI visuals and slicers for faster drill-down than static spreadsheets.
- It helps managers review revenue and profit together instead of looking only at sales.
- It is editable, so analysts can adjust measures, relationships, labels, colors, and pages.
- It can be published to Power BI Service for controlled sharing when your team has the right Microsoft licensing.
Opportunities for Improvement
The dashboard is intentionally focused on management reporting. Advanced users may extend it with POS import automation, keg tracking, recipe-cost logic, inventory depletion, forecasting, staff scheduling, or a separate production page. Teams with more complex brewery workflows can pair this report with dedicated operations software and still use Power BI for executive reporting.
Best Practices
- Keep source-data field names consistent when replacing sample data.
- Refresh the model after every data update and check each page before sharing.
- Review revenue, cost, and margin together so high sales do not hide weak profitability.
- Use slicers during weekly or monthly management meetings to answer follow-up questions quickly.
- Use Microsoft guidance for Power BI Desktop setup and publishing when needed: Get Power BI Desktop.
Explore Relevant Templates
You may also like Micro Breweries Pubs Dashboard in Excel, Brewery & Winery Dashboard in Power BI, and Restaurant Order Data Entry System in Excel. You can also browse all Power BI dashboard templates.
Frequently Asked Questions
What does the Micro Breweries Pubs Dashboard in Power BI track?
It tracks total revenue, total pints sold, total cost, target achievement, gross profit, profit margin, orders, quality score, wait time, completion rate, pub, city, region, brew style, product, event type, server, sales channel, customer segment, month, quarter, and year.
Do I need to buy Power BI to use this template?
No. Power BI Desktop is free from Microsoft. You only need Power BI Pro or related Microsoft licensing if you want to publish and share through Power BI Service.
Can I replace the sample data with my own pub or brewery data?
Yes. Open Transform Data in Power BI Desktop, point the report to your own source, keep the needed fields aligned, and refresh the model.
Can I customize the dashboard?
Yes. The .pbix file is editable, so you can change visuals, DAX measures, relationships, page names, colors, and labels if you are comfortable with Power BI.
Is this a subscription?
No. It is a one-time downloadable template from NextGenTemplates.
Is this a complete brewery operations system?
No. It is a Power BI analytics dashboard for reporting. It does not replace POS, recipe, inventory barcode, payroll, booking, or production management software.
About the Author
Built by PK – Microsoft Certified Professional with 15+ years of Excel, Google Sheets, and Power BI experience. Founder of NextGenTemplates, reaching 300K+ subscribers across YouTube channels. Every template is hand-built and tested before release.
Conclusion
The Micro Breweries Pubs Dashboard in Power BI gives pub and brewery teams a practical way to review revenue, cost, pints sold, target achievement, profit margin, service quality, wait time, and regional trends without building a report from scratch. It is a focused Power BI template for teams that want clearer performance conversations and faster management reviews.
Click here to purchase the Micro Breweries Pubs Dashboard in Power BI
Visit our YouTube channel for step-by-step Excel and Power BI tutorials: youtube.com/@PKAnExcelExpert